| Param | Original file | Final file |
|---|---|---|
| Filename | modeM0/AS1A10_056T01_9000004626_31663cztM0_level2.evt | modeM0/AS1A10_056T01_9000004626_31663cztM0_level2_quad_clean.evt |
| Size (bytes) | 563,644,800 | 94,032,000 |
| Size | 537.5 MB | 89.7 MB |
| Events in quadrant A | 3,290,553 | 596,920 |
| Events in quadrant B | 5,459,611 | 598,110 |
| Events in quadrant C | 3,942,577 | 577,307 |
| Events in quadrant D | 3,887,619 | 572,194 |
| Mode M0 | |||
|---|---|---|---|
| Quadrant | BADHDUFLAG | Total packets | Discarded packets |
| A | 0 | 14649 | 1 |
| B | 0 | 21878 | 1 |
| C | 0 | 16400 | 1 |
| D | 0 | 16374 | 1 |
| Mode M9 | |||
|---|---|---|---|
| Quadrant | BADHDUFLAG | Total packets | Discarded packets |
| A | 0 | 4 | 0 |
| B | 0 | 4 | 0 |
| C | 0 | 4 | 0 |
| D | 0 | 4 | 0 |
| Mode SS | |||
|---|---|---|---|
| Quadrant | BADHDUFLAG | Total packets | Discarded packets |
| A | 0 | 146 | 0 |
| B | 0 | 146 | 0 |
| C | 0 | 146 | 0 |
| D | 0 | 146 | 0 |
| Quadrant | Total seconds | Saturated seconds | Saturation percentage |
|---|---|---|---|
| A | 7228 | 49 | 0.677919% |
| B | 7228 | 106 | 1.466519% |
| C | 7228 | 131 | 1.812396% |
| D | 7228 | 30 | 0.415053% |
Noise dominated data is calculated using 1-second bins in cleaned event files. If a bin has >2000 counts, and if more than 50% of those come from <1% of pixels, then it is considered to be noise-dominated and hence unusable.
| Quadrant | # 1 sec bins | Bins with >0 counts | Bins with >2000 counts | High rate bins dominated by noise | Noise dominated (total time) | Noise dominated (detector-on time) | Marked lightcurve |
|---|---|---|---|---|---|---|---|
| A | 7638 | 7229 | 0 | 0 | 0.00% | 0.00% | 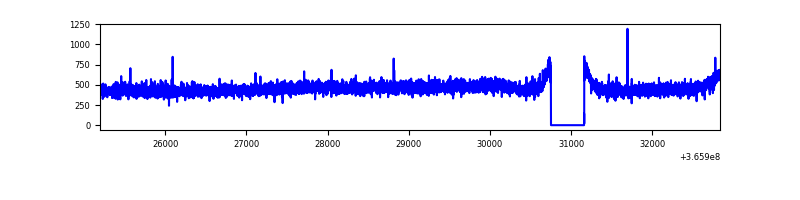 |
| B | 7638 | 7229 | 0 | 0 | 0.00% | 0.00% | 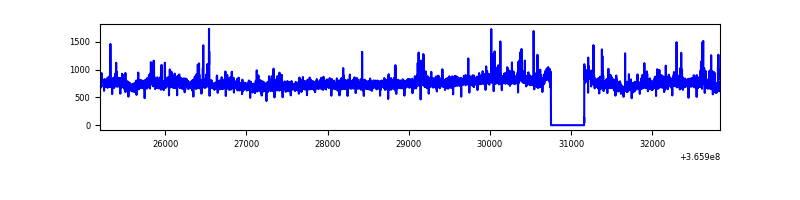 |
| C | 7638 | 7229 | 15 | 15 | 0.20% | 0.21% | 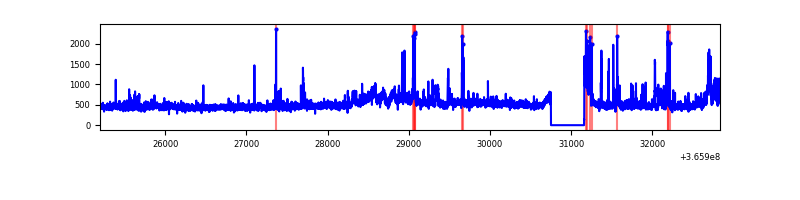 |
| D | 7638 | 7229 | 4 | 4 | 0.05% | 0.06% | 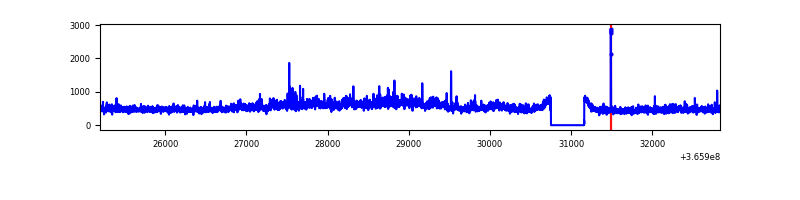 |
Top three noisy pixels from each quadrant. If the there are fewer than three noisy pixels in the level2.evt file, extra rows are filled as -1
| Pixel properties | Quadrant properties | ||||||
|---|---|---|---|---|---|---|---|
| Quadrant | DetID | PixID | Counts | Sigma | Mean | Median | Sigma |
| A | 15 | 174 | 24380 | 138.16 | 844 | 825 | 170.5 |
| A | 13 | 254 | 12346 | 67.57 | 844 | 825 | 170.5 |
| A | 3 | 137 | 8842 | 47.02 | 844 | 825 | 170.5 |
| B | 6 | 159 | 1982746 | 12240.86 | 838 | 815 | 161.9 |
| B | 4 | 80 | 85264 | 521.58 | 838 | 815 | 161.9 |
| B | 10 | 245 | 39512 | 239.0 | 838 | 815 | 161.9 |
| C | 3 | 233 | 373873 | 1961.93 | 806 | 810 | 190.2 |
| C | 10 | 22 | 138884 | 726.13 | 806 | 810 | 190.2 |
| C | 14 | 238 | 129657 | 677.6 | 806 | 810 | 190.2 |
| D | 8 | 195 | 747681 | 3843.06 | 815 | 792 | 194.3 |
| D | 2 | 234 | 36161 | 181.99 | 815 | 792 | 194.3 |
| D | 2 | 250 | 26123 | 130.34 | 815 | 792 | 194.3 |
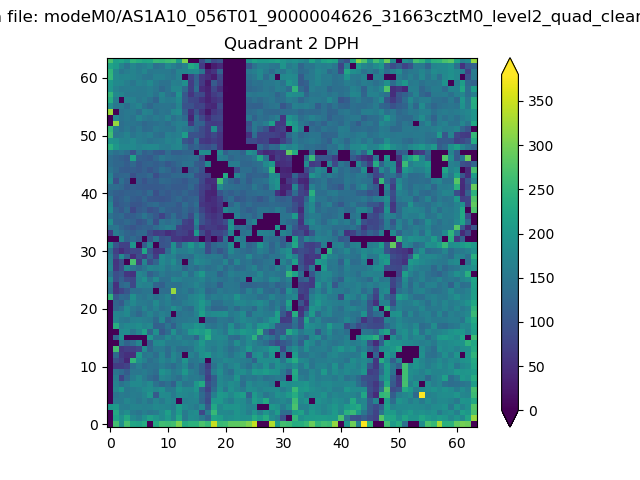
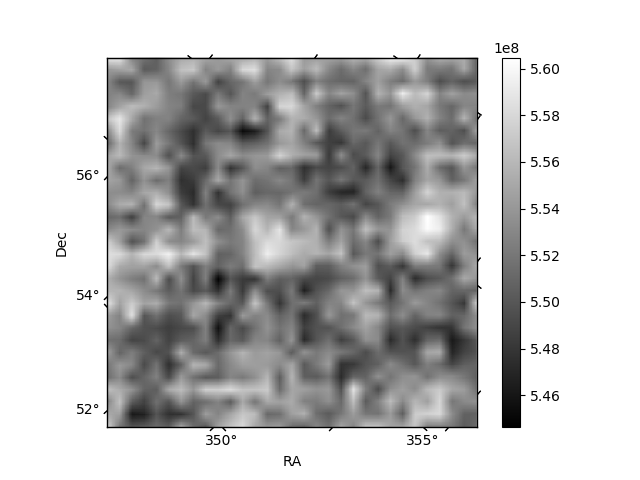
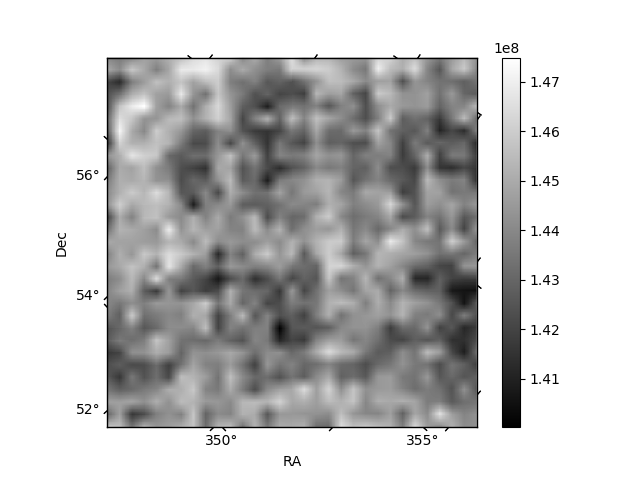
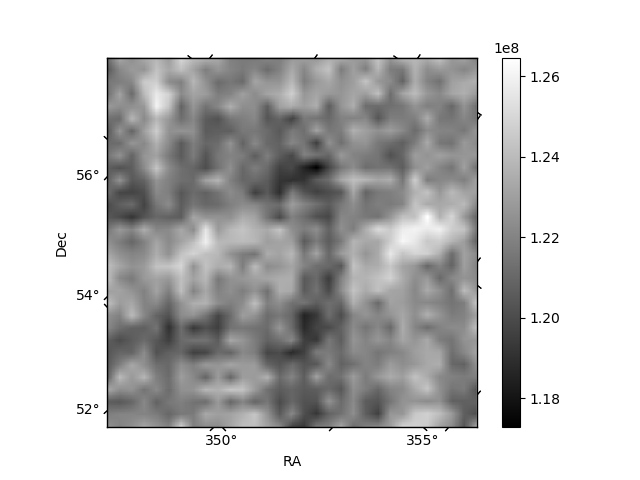
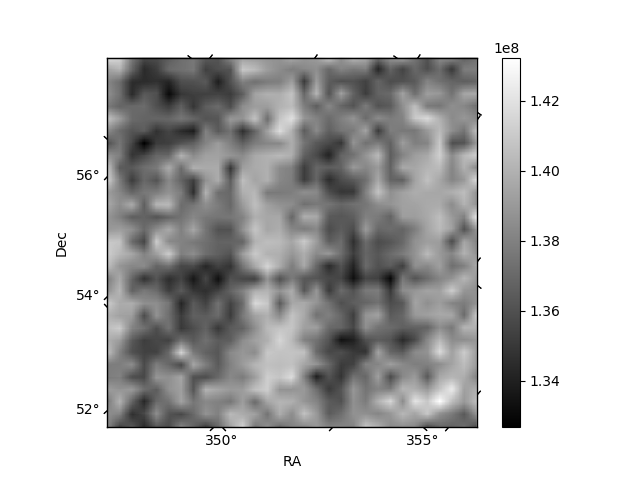
Histogram calculated using DETX and DETY for each event in the final _common_clean file
| Quadrant A | 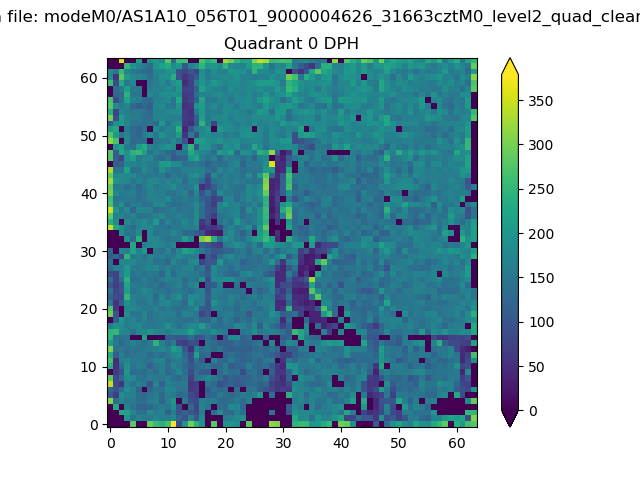 |
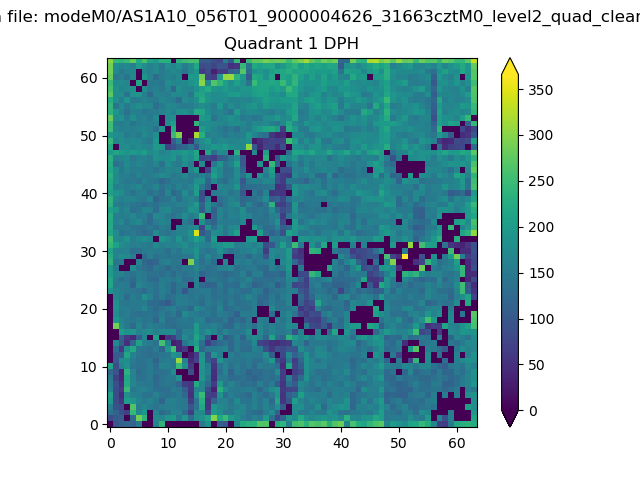 |
Quadrant B |
|---|---|---|---|
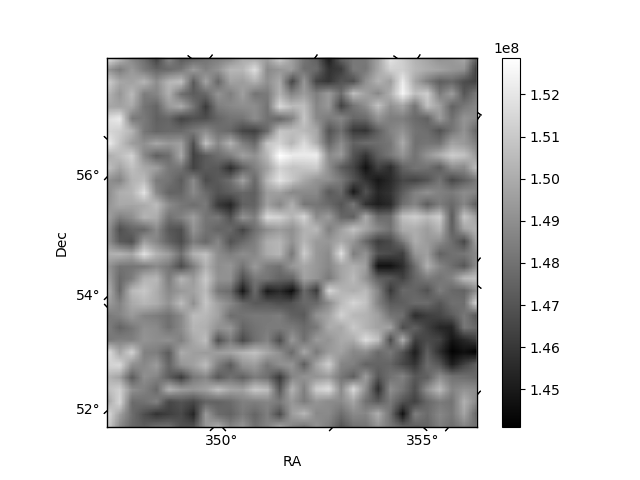
| Quadrant D | 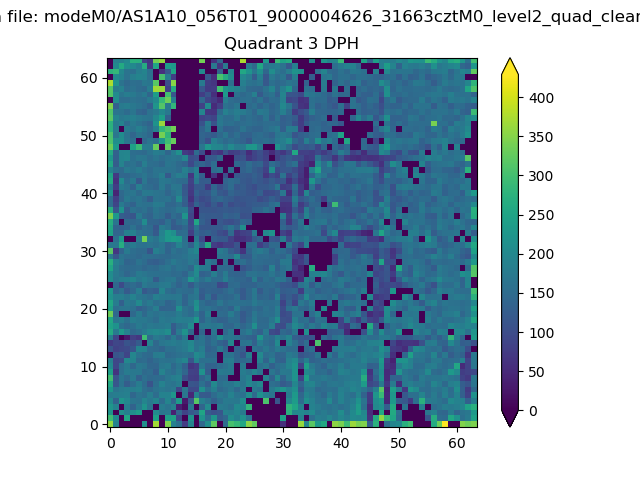 |
 |
Quadrant C |
| Plot type | Count rate plots | Images |
|---|---|---|
| Comparison with Poisson distribution Blue bars denote a histogram of data divided into 1 sec bins. Red curve is a Poisson curve with rate = median count rate of data. |
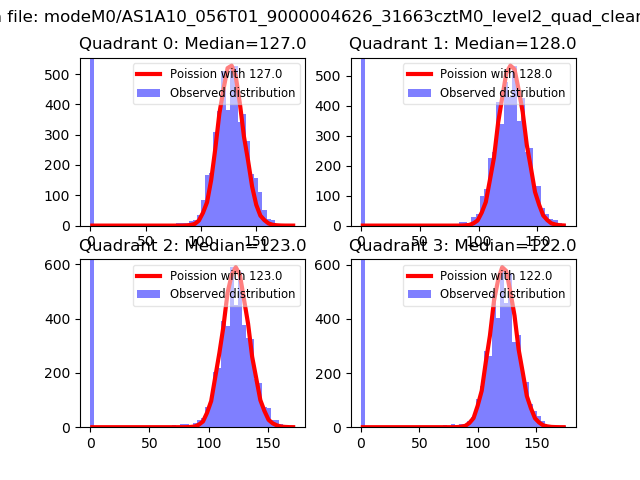 |
 |
| Quadrant-wise count rates Data is divided into 100 sec bins |
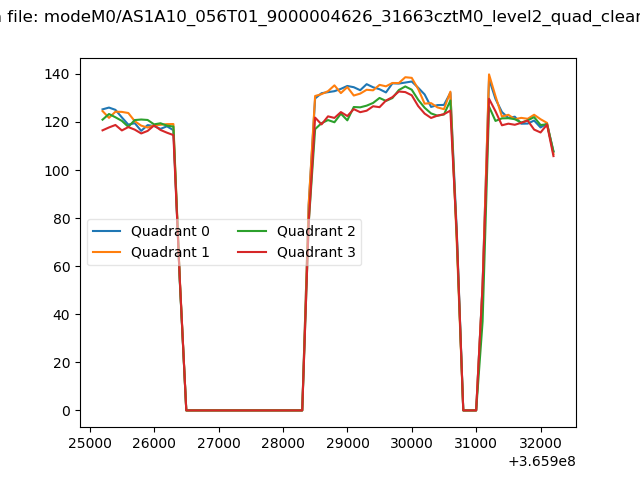 |
|
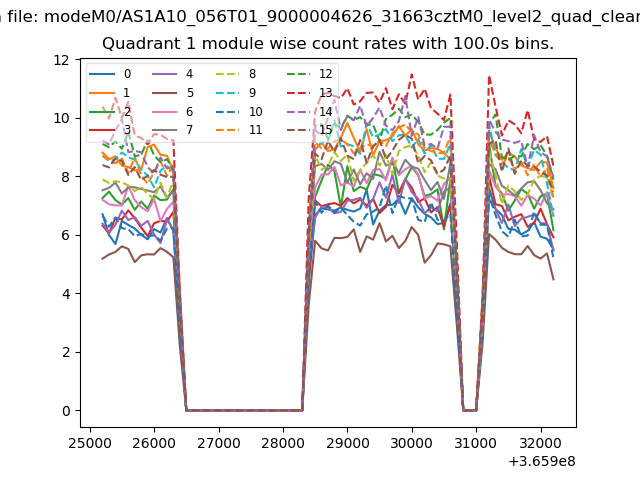
| Module-wise count rates for Quadrant A Data is divided into 100 sec bins |
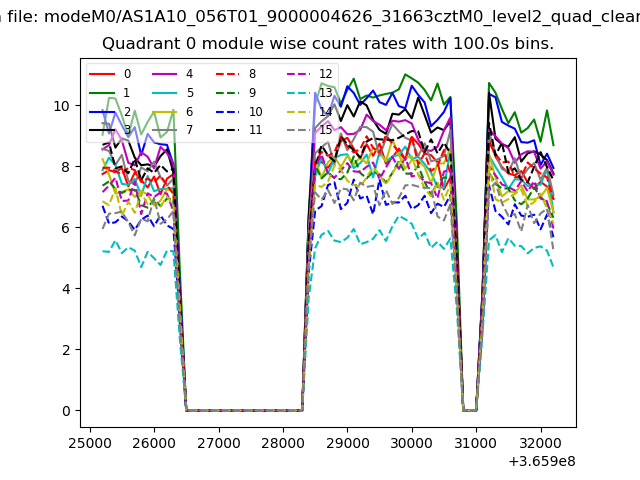 |
 |
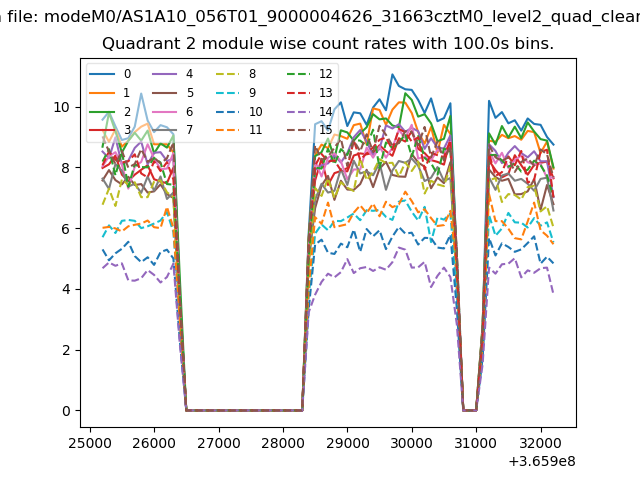
| Module-wise count rates for Quadrant B Data is divided into 100 sec bins |
 |
 |
| Module-wise count rates for Quadrant C Data is divided into 100 sec bins |
 |
 |
| Module-wise count rates for Quadrant D Data is divided into 100 sec bins |
 |
 |
| Parameter | Plot |
|---|---|
| CZT HV Monitor | 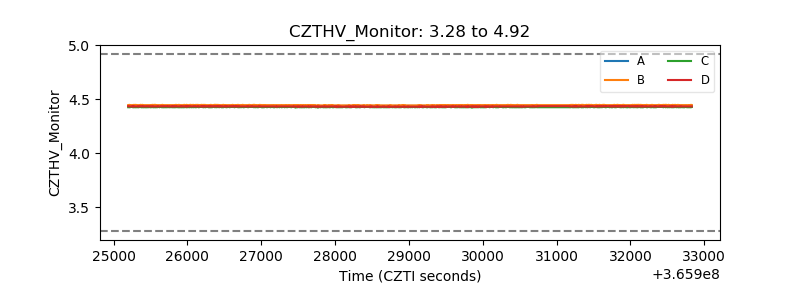 |
| D_VDD | 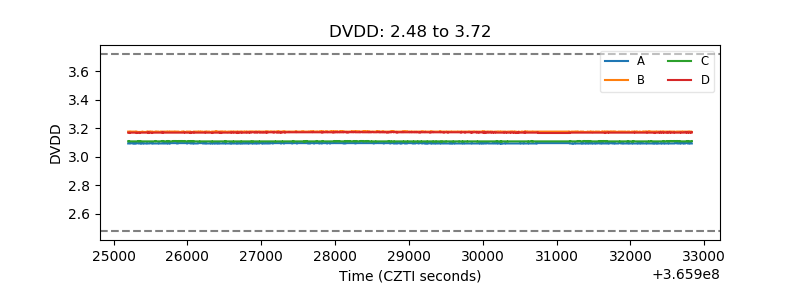 |
| Temperature 1 | 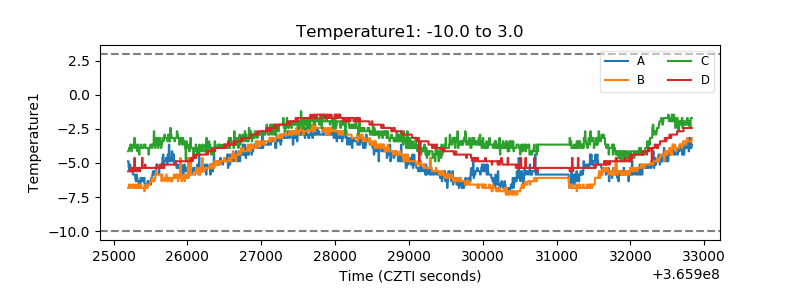 |
| Veto HV Monitor | 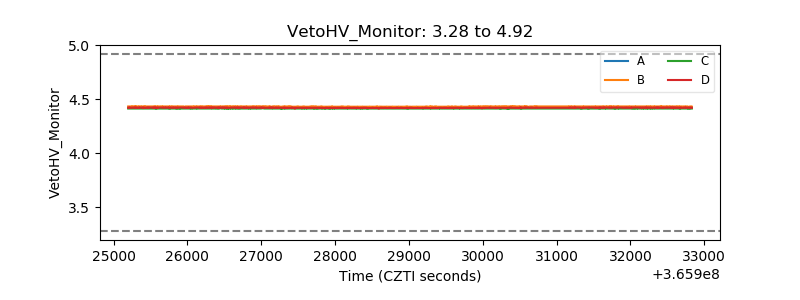 |
| Veto LLD | 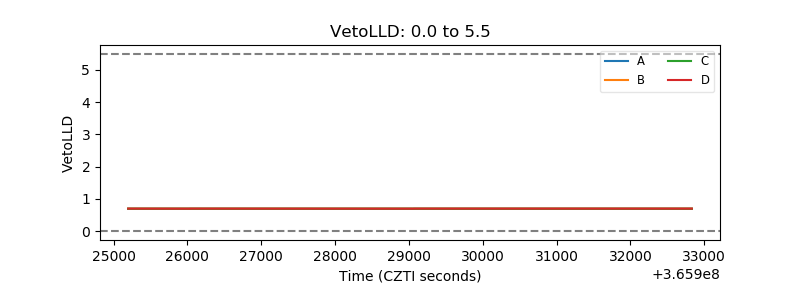 |
| Alpha Counter | 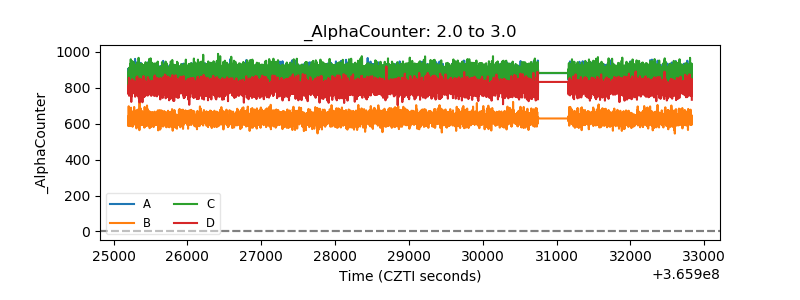 |
| _CPM_Rate | 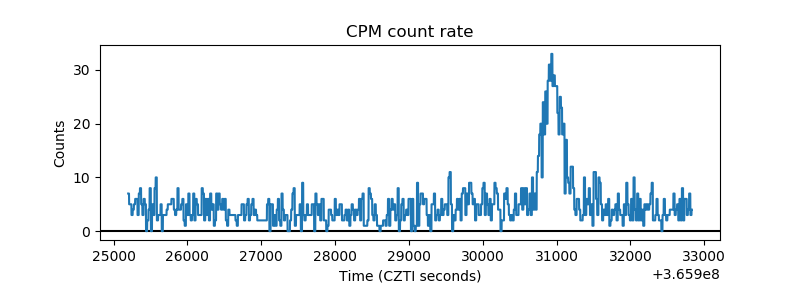 |
| CZT Counter | 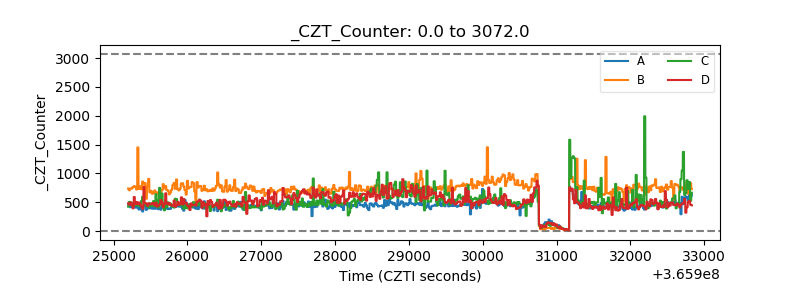 |
| +2.5 Volts monitor |  |
| +5 Volts monitor |  |
| _ROLL_ROT |  |
| _Roll_DEC |  |
| _Roll_RA | 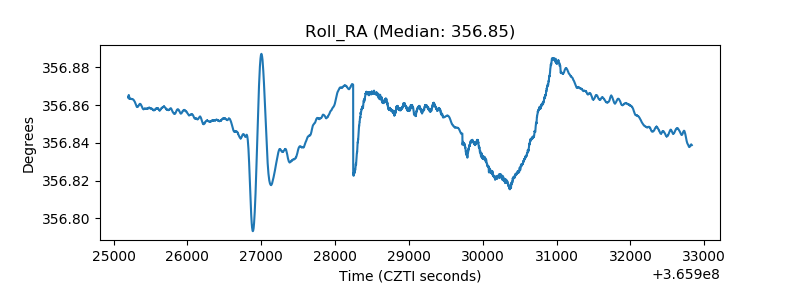 |
| Veto Counter |  |