| Param | Original file | Final file |
|---|---|---|
| Filename | modeM0/AS1A10_056T01_9000004626_31665cztM0_level2.evt | modeM0/AS1A10_056T01_9000004626_31665cztM0_level2_quad_clean.evt |
| Size (bytes) | 1,021,593,600 | 154,540,800 |
| Size | 974.3 MB | 147.4 MB |
| Events in quadrant A | 6,173,211 | 966,988 |
| Events in quadrant B | 9,953,644 | 968,435 |
| Events in quadrant C | 7,308,939 | 925,265 |
| Events in quadrant D | 6,628,585 | 924,371 |
| Mode M0 | |||
|---|---|---|---|
| Quadrant | BADHDUFLAG | Total packets | Discarded packets |
| A | 0 | 26765 | 3 |
| B | 0 | 39538 | 4 |
| C | 0 | 29634 | 3 |
| D | 0 | 27861 | 3 |
| Mode M9 | |||
|---|---|---|---|
| Quadrant | BADHDUFLAG | Total packets | Discarded packets |
| A | 0 | 13 | 0 |
| B | 0 | 14 | 0 |
| C | 0 | 14 | 0 |
| D | 0 | 14 | 0 |
| Mode SS | |||
|---|---|---|---|
| Quadrant | BADHDUFLAG | Total packets | Discarded packets |
| A | 0 | 262 | 0 |
| B | 0 | 262 | 0 |
| C | 0 | 262 | 0 |
| D | 0 | 262 | 0 |
| Quadrant | Total seconds | Saturated seconds | Saturation percentage |
|---|---|---|---|
| A | 12956 | 162 | 1.250386% |
| B | 12955 | 281 | 2.169047% |
| C | 12955 | 376 | 2.902354% |
| D | 12955 | 139 | 1.072945% |
Noise dominated data is calculated using 1-second bins in cleaned event files. If a bin has >2000 counts, and if more than 50% of those come from <1% of pixels, then it is considered to be noise-dominated and hence unusable.
| Quadrant | # 1 sec bins | Bins with >0 counts | Bins with >2000 counts | High rate bins dominated by noise | Noise dominated (total time) | Noise dominated (detector-on time) | Marked lightcurve |
|---|---|---|---|---|---|---|---|
| A | 14256 | 12958 | 3 | 3 | 0.02% | 0.02% | 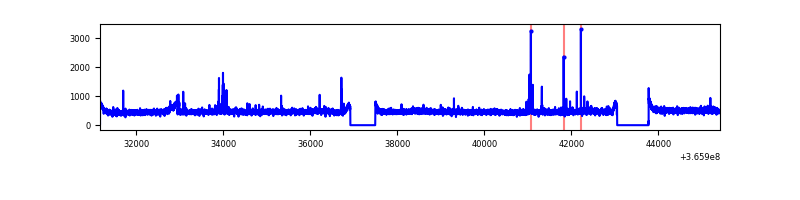 |
| B | 14255 | 12957 | 11 | 11 | 0.08% | 0.08% | 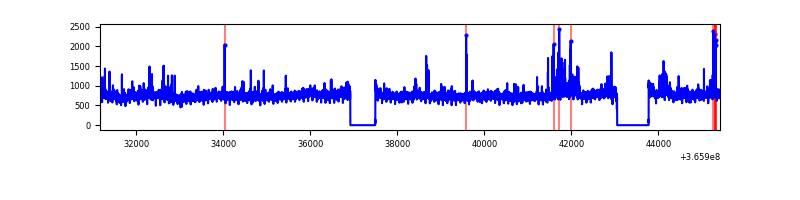 |
| C | 14255 | 12957 | 82 | 82 | 0.58% | 0.63% | 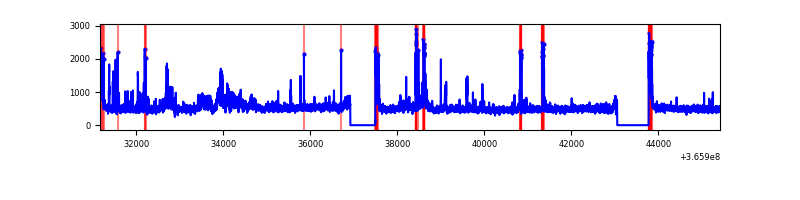 |
| D | 14255 | 12957 | 11 | 11 | 0.08% | 0.08% | 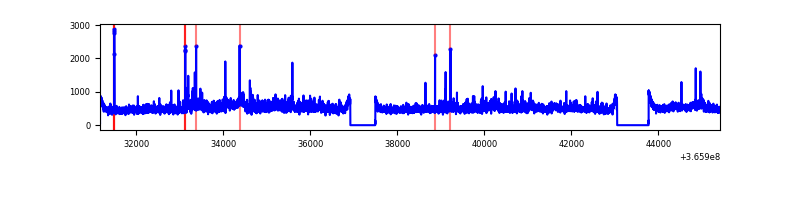 |
Top three noisy pixels from each quadrant. If the there are fewer than three noisy pixels in the level2.evt file, extra rows are filled as -1
| Pixel properties | Quadrant properties | ||||||
|---|---|---|---|---|---|---|---|
| Quadrant | DetID | PixID | Counts | Sigma | Mean | Median | Sigma |
| A | 15 | 174 | 80150 | 252.1 | 1553 | 1519 | 311.9 |
| A | 12 | 96 | 77583 | 243.87 | 1553 | 1519 | 311.9 |
| A | 13 | 254 | 21902 | 65.35 | 1553 | 1519 | 311.9 |
| B | 6 | 159 | 3473432 | 11789.5 | 1536 | 1496 | 294.5 |
| B | 10 | 245 | 125564 | 421.29 | 1536 | 1496 | 294.5 |
| B | 4 | 80 | 91510 | 305.66 | 1536 | 1496 | 294.5 |
| C | 3 | 233 | 648834 | 1881.53 | 1472 | 1482 | 344.1 |
| C | 0 | 10 | 313626 | 907.25 | 1472 | 1482 | 344.1 |
| C | 10 | 22 | 304031 | 879.36 | 1472 | 1482 | 344.1 |
| D | 8 | 195 | 834684 | 2347.6 | 1500 | 1457 | 354.9 |
| D | 2 | 234 | 60352 | 165.94 | 1500 | 1457 | 354.9 |
| D | 2 | 250 | 54984 | 150.81 | 1500 | 1457 | 354.9 |
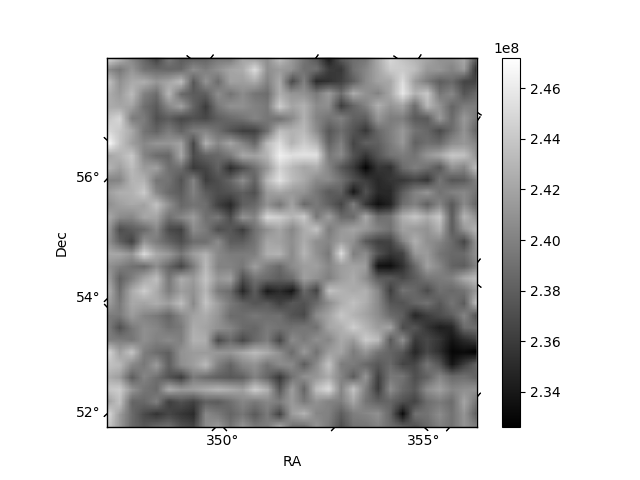
Histogram calculated using DETX and DETY for each event in the final _common_clean file
| Quadrant A | 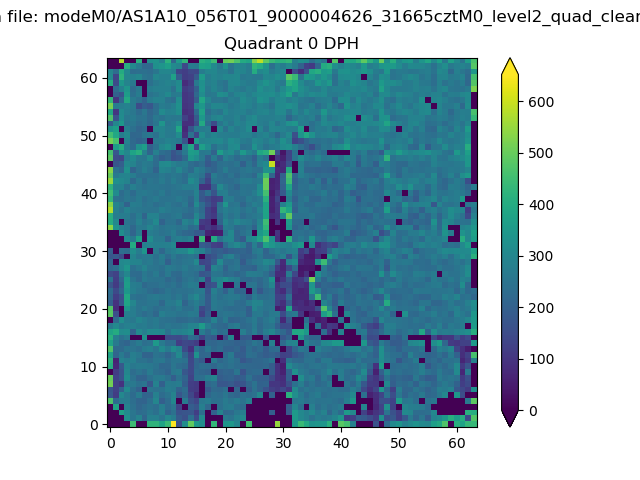 |
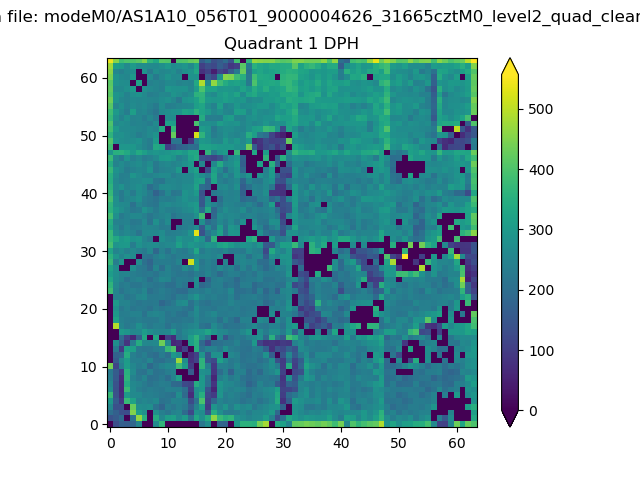 |
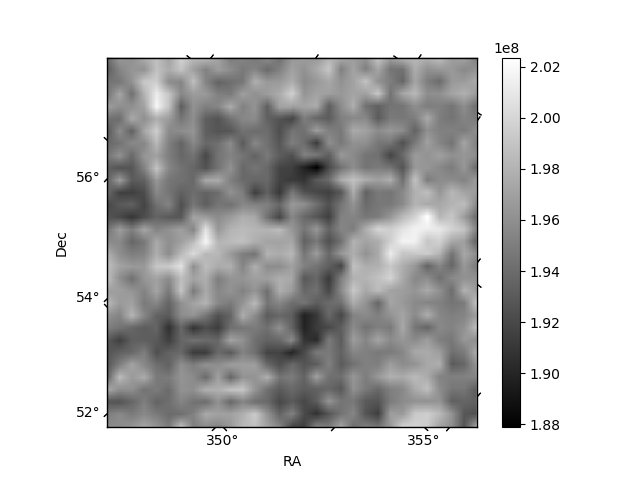
Quadrant B |
|---|---|---|---|
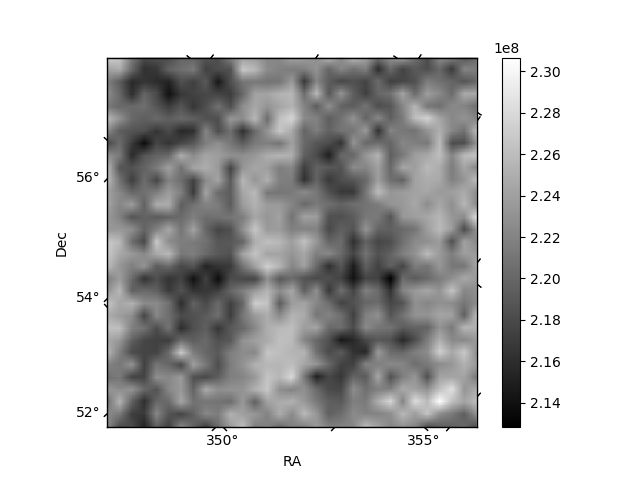
| Quadrant D | 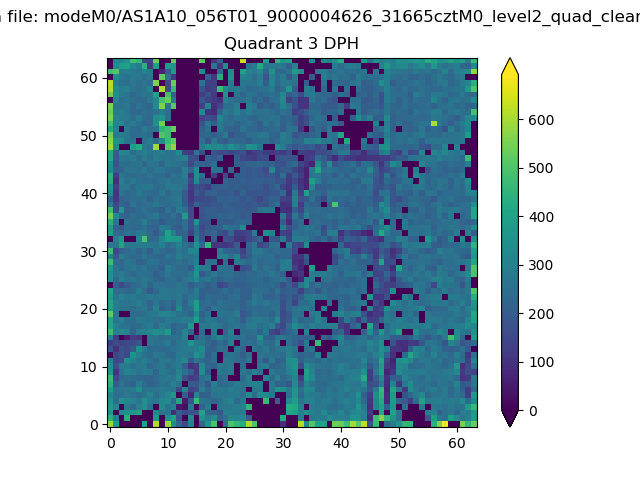 |
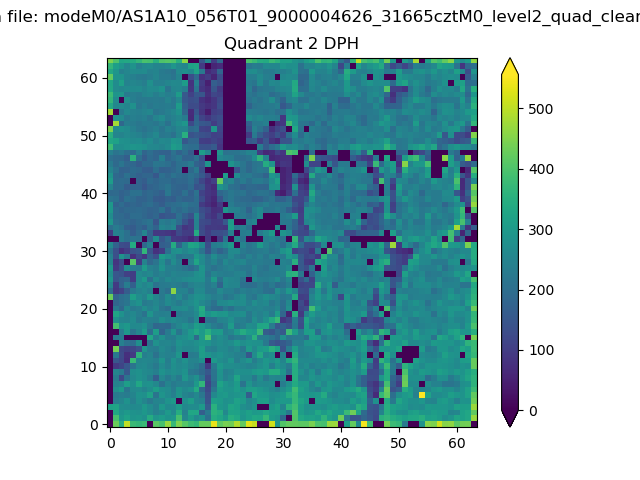 |
Quadrant C |
| Plot type | Count rate plots | Images |
|---|---|---|
| Comparison with Poisson distribution Blue bars denote a histogram of data divided into 1 sec bins. Red curve is a Poisson curve with rate = median count rate of data. |
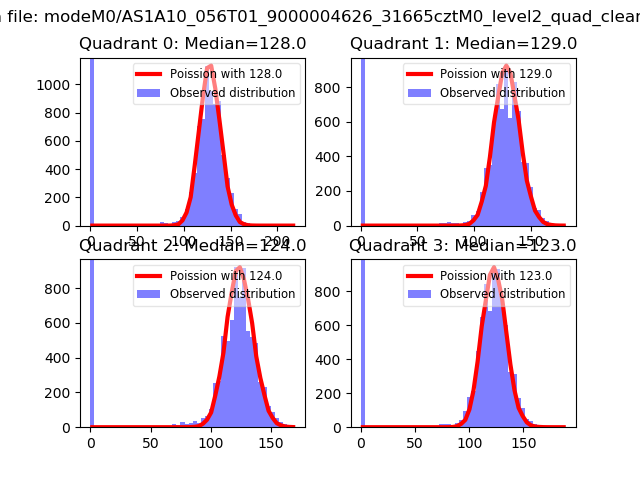 |
 |
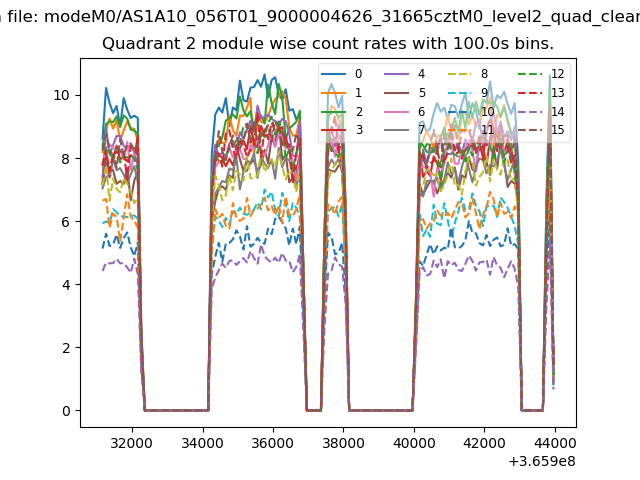
| Quadrant-wise count rates Data is divided into 100 sec bins |
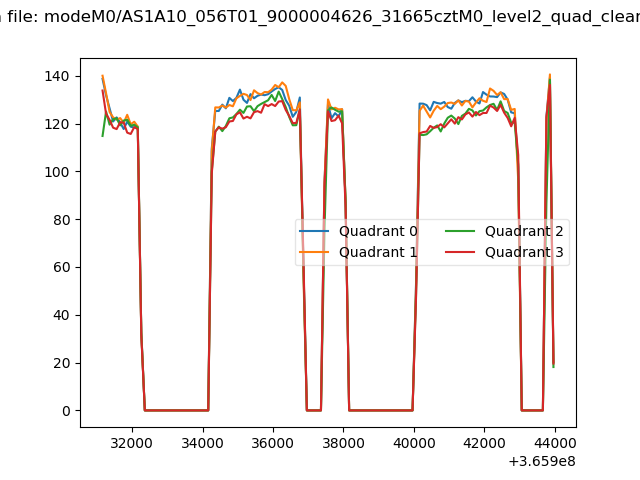 |
|
| Module-wise count rates for Quadrant A Data is divided into 100 sec bins |
 |
 |
| Module-wise count rates for Quadrant B Data is divided into 100 sec bins |
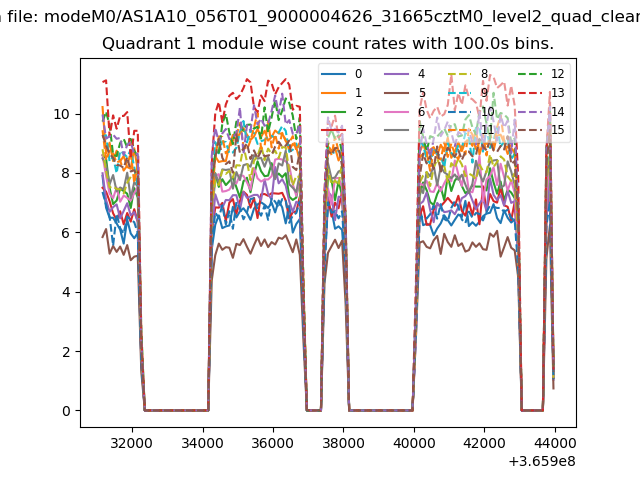 |
 |
| Module-wise count rates for Quadrant C Data is divided into 100 sec bins |
 |
 |
| Module-wise count rates for Quadrant D Data is divided into 100 sec bins |
 |
 |
| Parameter | Plot |
|---|---|
| CZT HV Monitor | 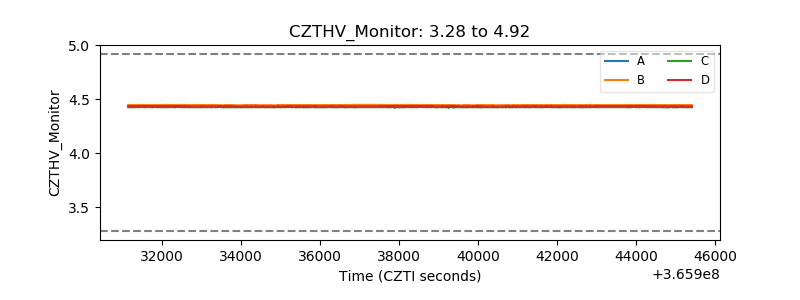 |
| D_VDD | 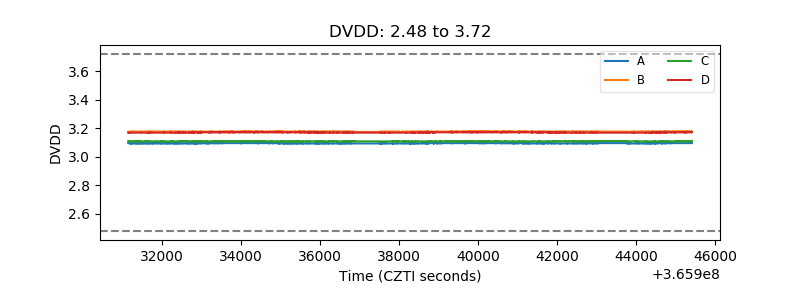 |
| Temperature 1 | 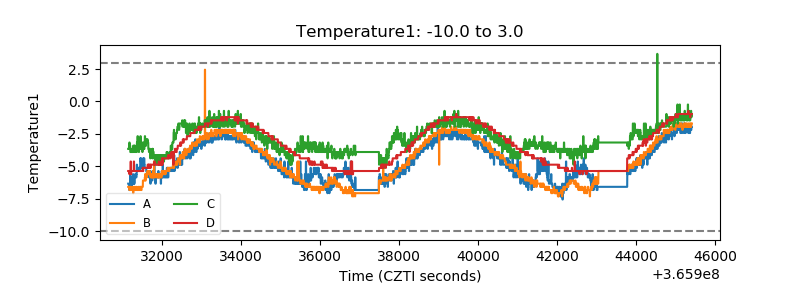 |
| Veto HV Monitor |  |
| Veto LLD | 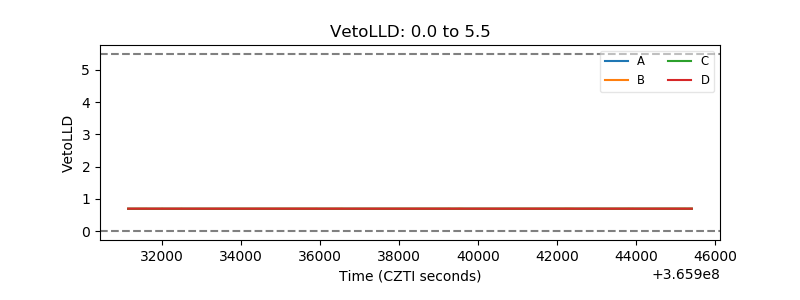 |
| Alpha Counter | 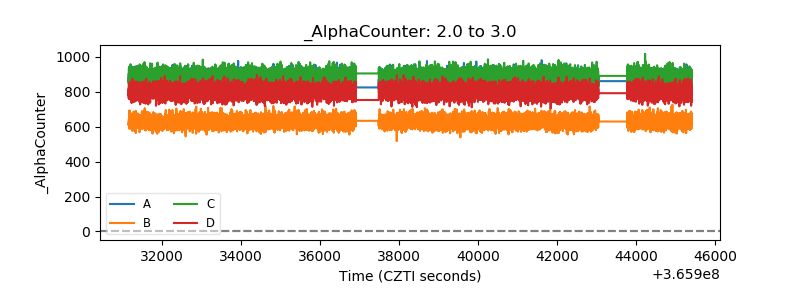 |
| _CPM_Rate | 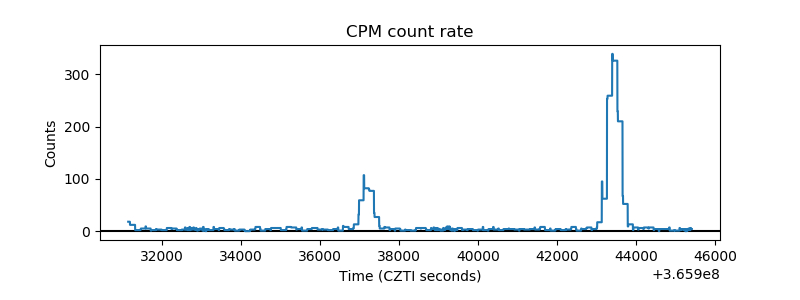 |
| CZT Counter |  |
| +2.5 Volts monitor | 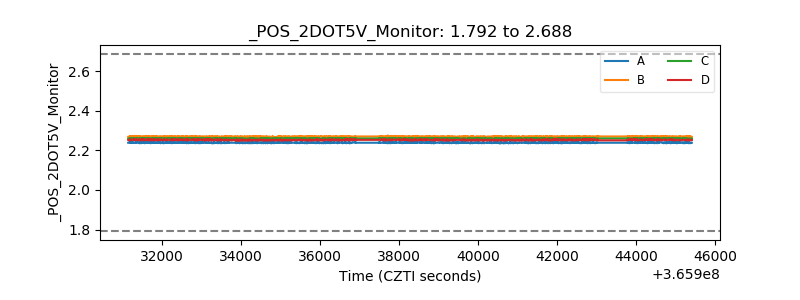 |
| +5 Volts monitor |  |
| _ROLL_ROT | 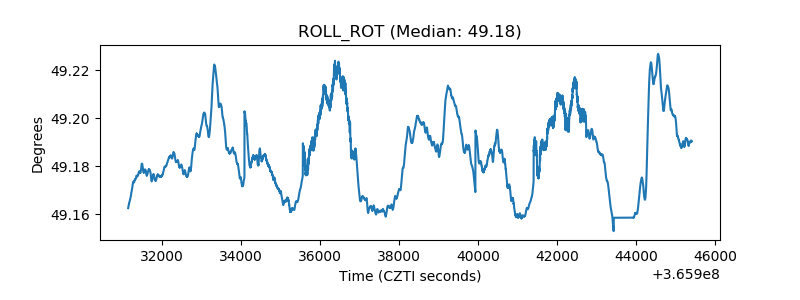 |
| _Roll_DEC | 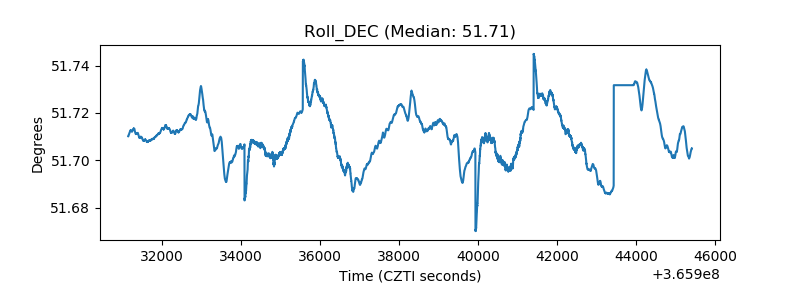 |
| _Roll_RA |  |
| Veto Counter | 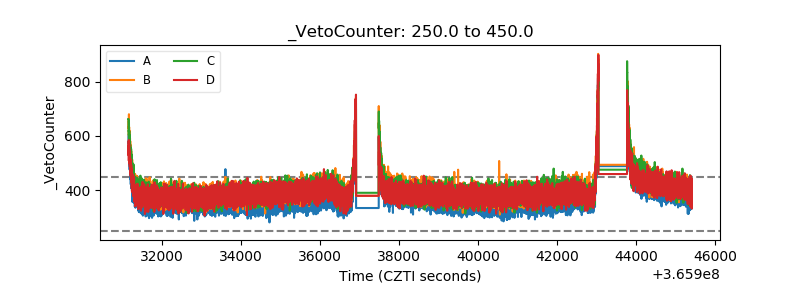 |