| Param | Original file | Final file |
|---|---|---|
| Filename | modeM0/AS1A10_056T01_9000004626_31666cztM0_level2.evt | modeM0/AS1A10_056T01_9000004626_31666cztM0_level2_quad_clean.evt |
| Size (bytes) | 549,671,040 | 72,385,920 |
| Size | 524.2 MB | 69.0 MB |
| Events in quadrant A | 3,352,657 | 439,824 |
| Events in quadrant B | 5,456,742 | 438,130 |
| Events in quadrant C | 3,653,853 | 416,619 |
| Events in quadrant D | 3,715,492 | 416,037 |
| Mode M0 | |||
|---|---|---|---|
| Quadrant | BADHDUFLAG | Total packets | Discarded packets |
| A | 0 | 14332 | 2 |
| B | 0 | 21231 | 4 |
| C | 0 | 14943 | 2 |
| D | 0 | 15366 | 2 |
| Mode M9 | |||
|---|---|---|---|
| Quadrant | BADHDUFLAG | Total packets | Discarded packets |
| A | 0 | 16 | 0 |
| B | 0 | 16 | 0 |
| C | 0 | 16 | 0 |
| D | 0 | 16 | 0 |
| Mode SS | |||
|---|---|---|---|
| Quadrant | BADHDUFLAG | Total packets | Discarded packets |
| A | 0 | 144 | 0 |
| B | 0 | 144 | 0 |
| C | 0 | 144 | 0 |
| D | 0 | 144 | 0 |
| Quadrant | Total seconds | Saturated seconds | Saturation percentage |
|---|---|---|---|
| A | 6898 | 99 | 1.435199% |
| B | 6898 | 172 | 2.493476% |
| C | 6898 | 190 | 2.754422% |
| D | 6898 | 112 | 1.623659% |
Noise dominated data is calculated using 1-second bins in cleaned event files. If a bin has >2000 counts, and if more than 50% of those come from <1% of pixels, then it is considered to be noise-dominated and hence unusable.
| Quadrant | # 1 sec bins | Bins with >0 counts | Bins with >2000 counts | High rate bins dominated by noise | Noise dominated (total time) | Noise dominated (detector-on time) | Marked lightcurve |
|---|---|---|---|---|---|---|---|
| A | 8548 | 6900 | 0 | 0 | 0.00% | 0.00% | 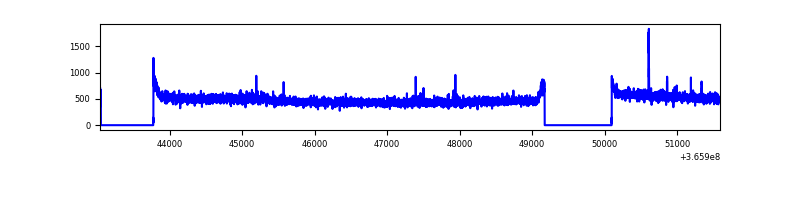 |
| B | 8548 | 6900 | 10 | 10 | 0.12% | 0.14% | 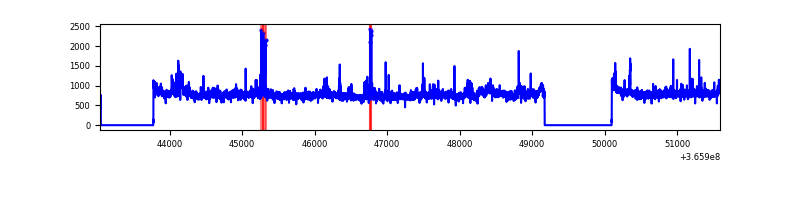 |
| C | 8548 | 6900 | 50 | 50 | 0.58% | 0.72% | 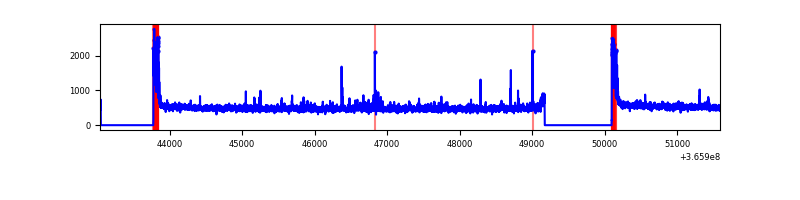 |
| D | 8548 | 6900 | 38 | 38 | 0.44% | 0.55% | 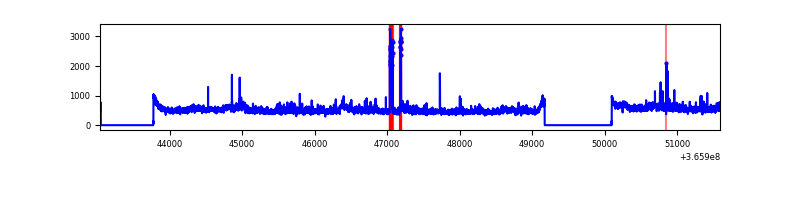 |
Top three noisy pixels from each quadrant. If the there are fewer than three noisy pixels in the level2.evt file, extra rows are filled as -1
| Pixel properties | Quadrant properties | ||||||
|---|---|---|---|---|---|---|---|
| Quadrant | DetID | PixID | Counts | Sigma | Mean | Median | Sigma |
| A | 15 | 174 | 14954 | 82.02 | 862 | 844 | 172.0 |
| A | 13 | 254 | 11871 | 64.1 | 862 | 844 | 172.0 |
| A | 3 | 137 | 8905 | 46.86 | 862 | 844 | 172.0 |
| B | 6 | 159 | 1817895 | 11073.03 | 849 | 829 | 164.1 |
| B | 0 | 190 | 93258 | 563.25 | 849 | 829 | 164.1 |
| B | 3 | 209 | 63167 | 379.88 | 849 | 829 | 164.1 |
| C | 0 | 10 | 247136 | 1300.62 | 811 | 816 | 189.4 |
| C | 14 | 238 | 131531 | 690.2 | 811 | 816 | 189.4 |
| C | 3 | 233 | 44515 | 230.74 | 811 | 816 | 189.4 |
| D | 8 | 195 | 386603 | 1942.08 | 832 | 806 | 198.7 |
| D | 13 | 249 | 101790 | 508.35 | 832 | 806 | 198.7 |
| D | 2 | 250 | 42556 | 210.17 | 832 | 806 | 198.7 |
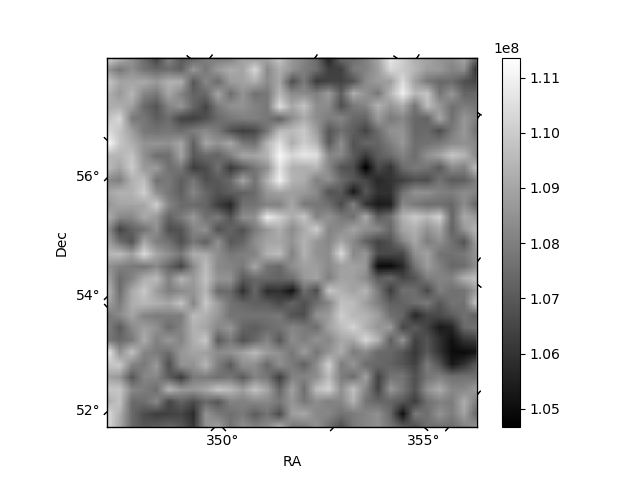
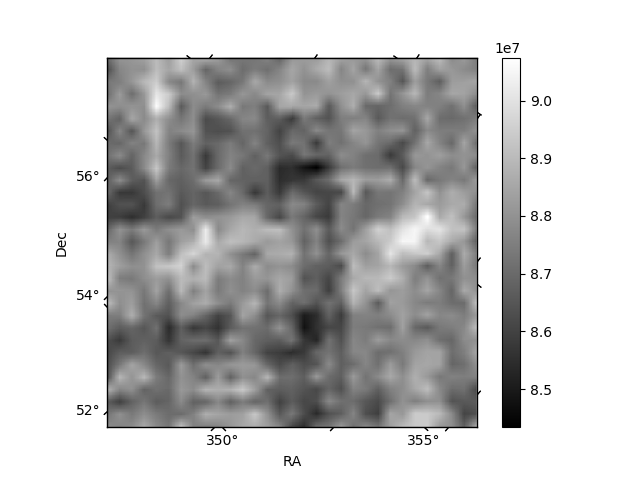
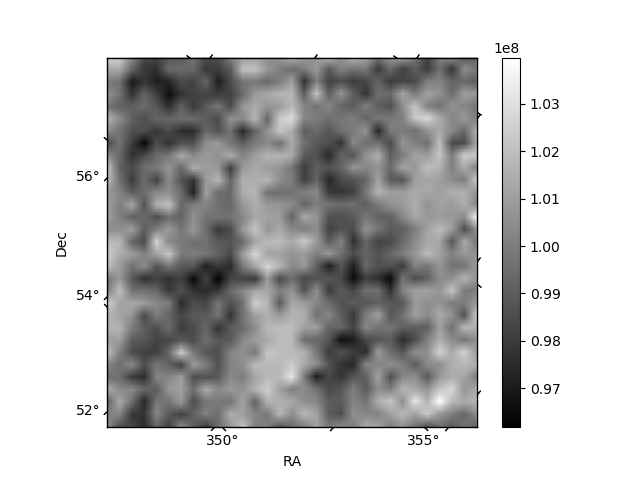
Histogram calculated using DETX and DETY for each event in the final _common_clean file
| Quadrant A | 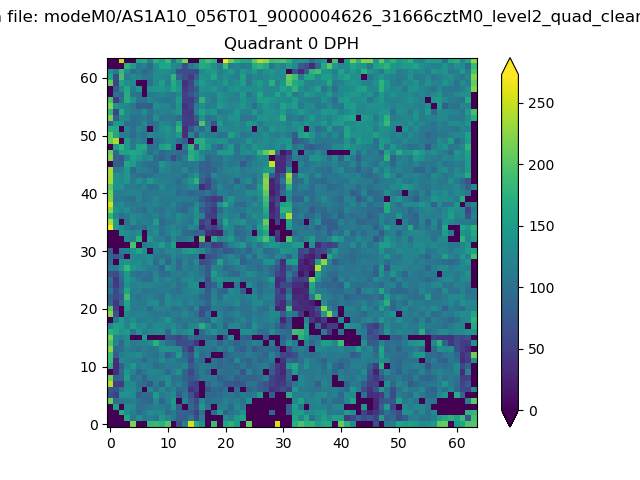 |
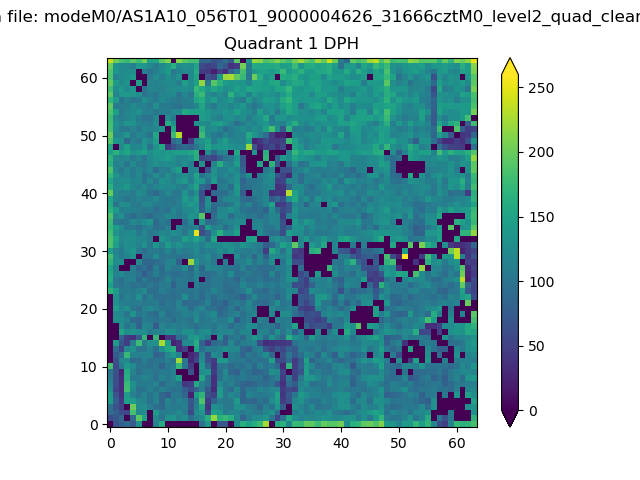 |
Quadrant B |
|---|---|---|---|
| Quadrant D | 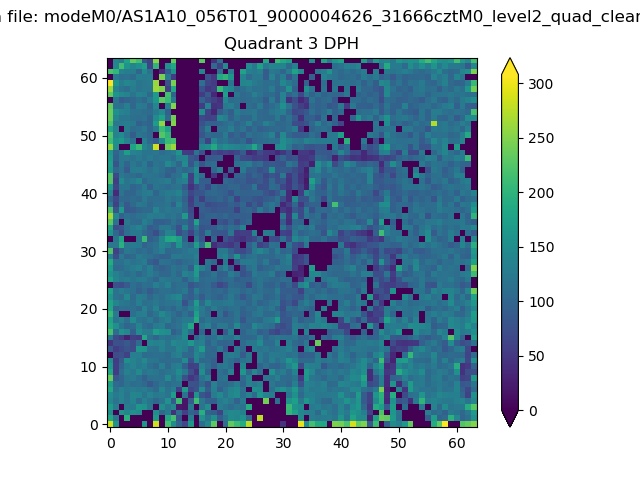 |
 |
Quadrant C |
| Plot type | Count rate plots | Images |
|---|---|---|
| Comparison with Poisson distribution Blue bars denote a histogram of data divided into 1 sec bins. Red curve is a Poisson curve with rate = median count rate of data. |
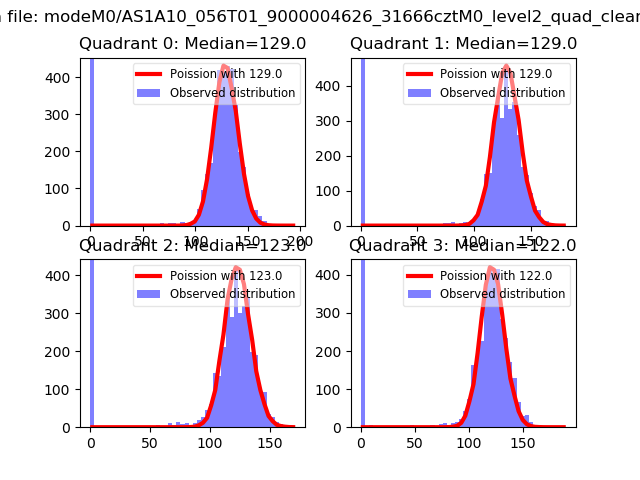 |
 |
| Quadrant-wise count rates Data is divided into 100 sec bins |
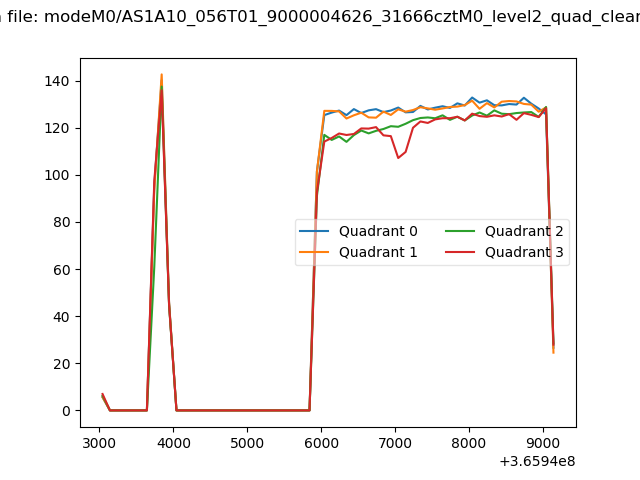 |
|
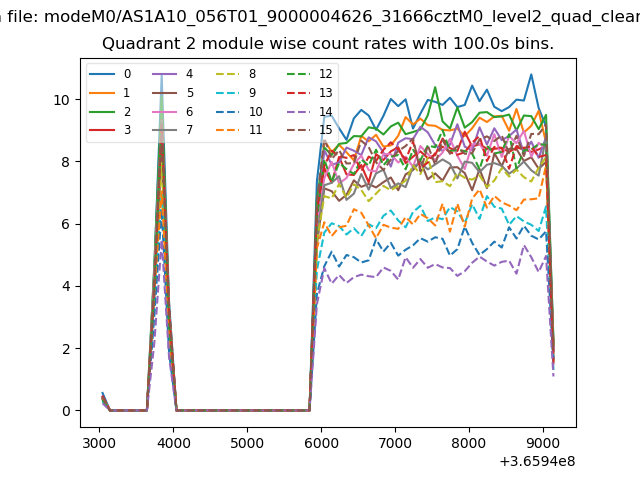
| Module-wise count rates for Quadrant A Data is divided into 100 sec bins |
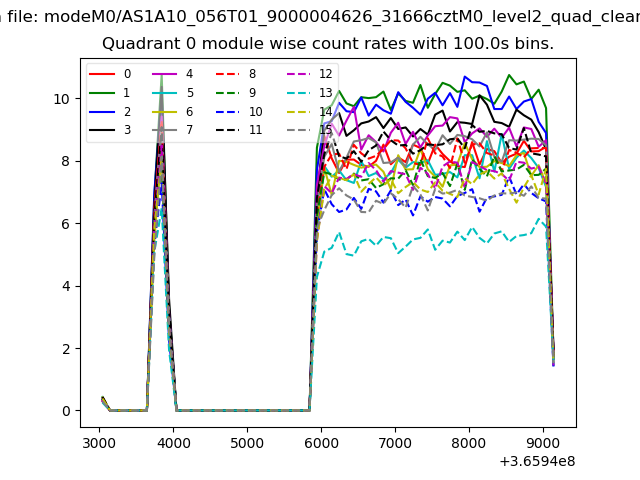 |
 |
| Module-wise count rates for Quadrant B Data is divided into 100 sec bins |
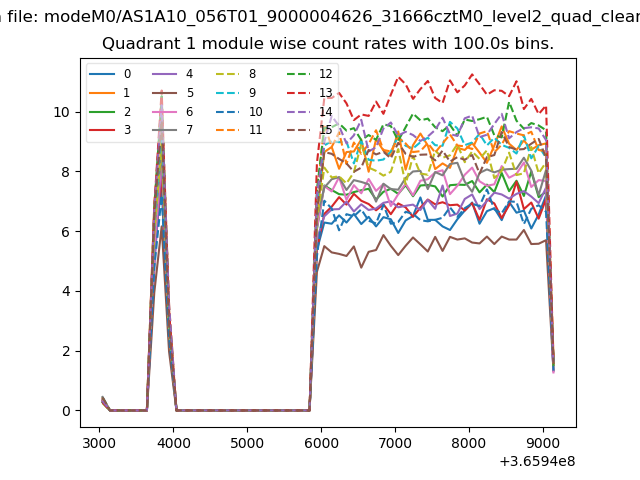 |
 |
| Module-wise count rates for Quadrant C Data is divided into 100 sec bins |
 |
 |
| Module-wise count rates for Quadrant D Data is divided into 100 sec bins |
 |
 |
| Parameter | Plot |
|---|---|
| CZT HV Monitor | 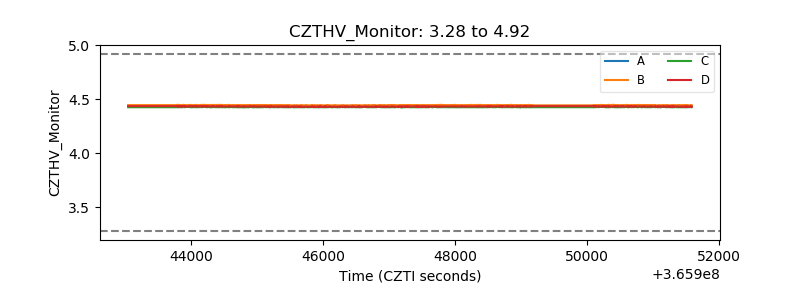 |
| D_VDD | 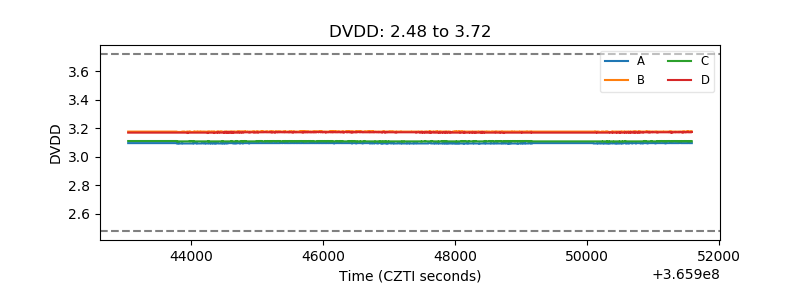 |
| Temperature 1 | 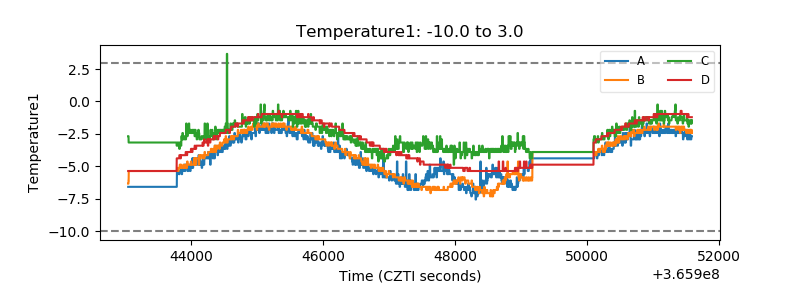 |
| Veto HV Monitor | 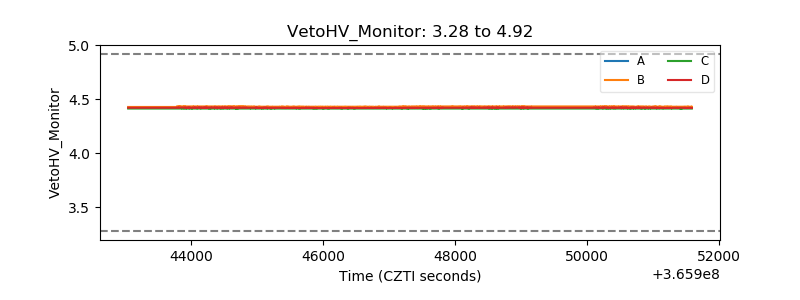 |
| Veto LLD | 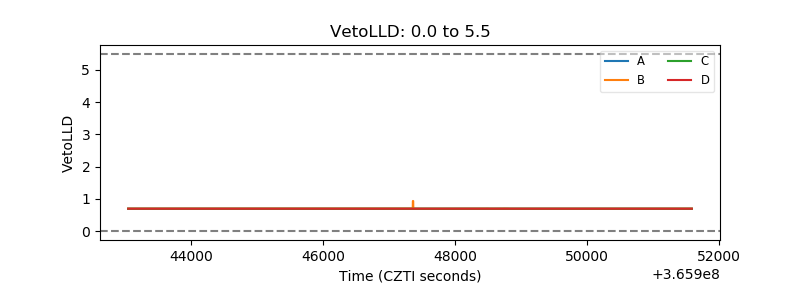 |
| Alpha Counter | 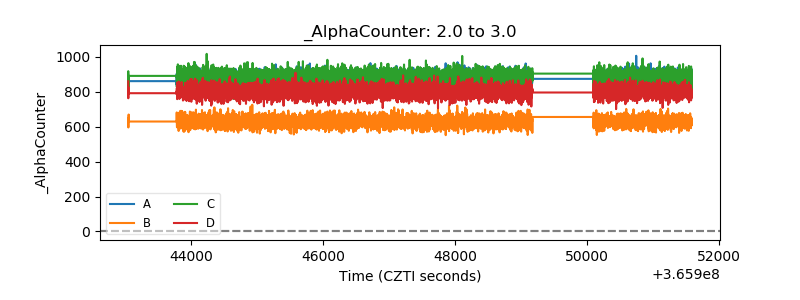 |
| _CPM_Rate | 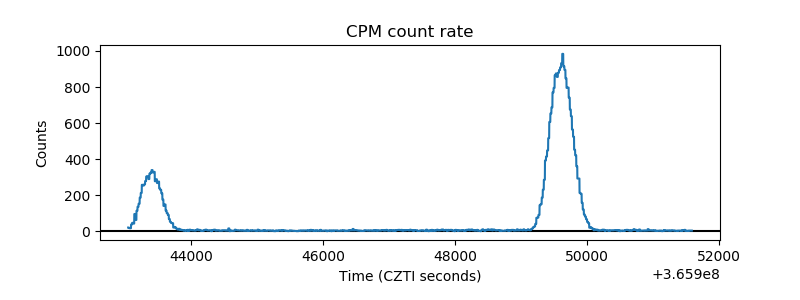 |
| CZT Counter |  |
| +2.5 Volts monitor |  |
| +5 Volts monitor | 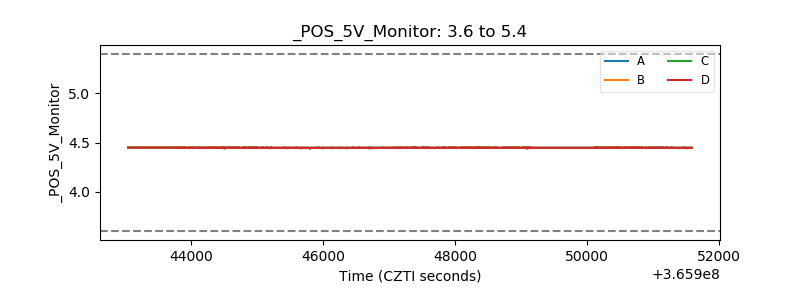 |
| _ROLL_ROT |  |
| _Roll_DEC |  |
| _Roll_RA |  |
| Veto Counter |  |