| Param | Original file | Final file |
|---|---|---|
| Filename | modeM0/AS1A10_056T01_9000004626_31669cztM0_level2.evt | modeM0/AS1A10_056T01_9000004626_31669cztM0_level2_quad_clean.evt |
| Size (bytes) | 1,238,826,240 | 188,190,720 |
| Size | 1.2 GB | 179.5 MB |
| Events in quadrant A | 7,326,585 | 1,192,472 |
| Events in quadrant B | 11,689,715 | 1,193,612 |
| Events in quadrant C | 8,784,610 | 1,147,677 |
| Events in quadrant D | 8,711,290 | 1,136,178 |
| Mode M0 | |||
|---|---|---|---|
| Quadrant | BADHDUFLAG | Total packets | Discarded packets |
| A | 0 | 31825 | 6 |
| B | 0 | 45871 | 3 |
| C | 0 | 35993 | 4 |
| D | 0 | 36253 | 3 |
| Mode M9 | |||
|---|---|---|---|
| Quadrant | BADHDUFLAG | Total packets | Discarded packets |
| A | 0 | 27 | 0 |
| B | 0 | 27 | 0 |
| C | 0 | 27 | 0 |
| D | 0 | 27 | 0 |
| Mode SS | |||
|---|---|---|---|
| Quadrant | BADHDUFLAG | Total packets | Discarded packets |
| A | 0 | 304 | 0 |
| B | 0 | 304 | 0 |
| C | 0 | 304 | 0 |
| D | 0 | 304 | 0 |
| Quadrant | Total seconds | Saturated seconds | Saturation percentage |
|---|---|---|---|
| A | 14920 | 131 | 0.878016% |
| B | 14922 | 307 | 2.057365% |
| C | 14921 | 443 | 2.968970% |
| D | 14922 | 115 | 0.770674% |
Noise dominated data is calculated using 1-second bins in cleaned event files. If a bin has >2000 counts, and if more than 50% of those come from <1% of pixels, then it is considered to be noise-dominated and hence unusable.
| Quadrant | # 1 sec bins | Bins with >0 counts | Bins with >2000 counts | High rate bins dominated by noise | Noise dominated (total time) | Noise dominated (detector-on time) | Marked lightcurve |
|---|---|---|---|---|---|---|---|
| A | 38050 | 14924 | 0 | 0 | 0.00% | 0.00% | 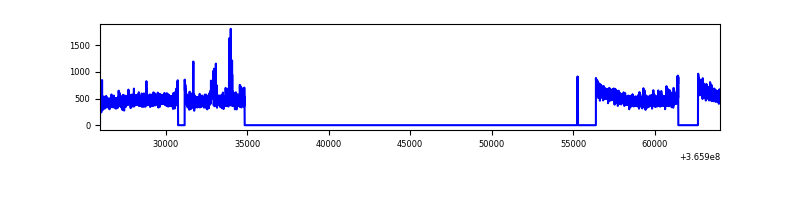 |
| B | 38050 | 14926 | 19 | 19 | 0.05% | 0.13% | 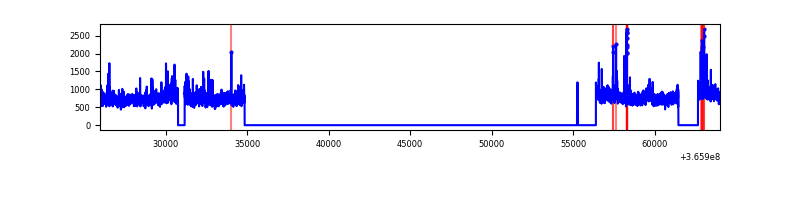 |
| C | 38049 | 14925 | 71 | 71 | 0.19% | 0.48% | 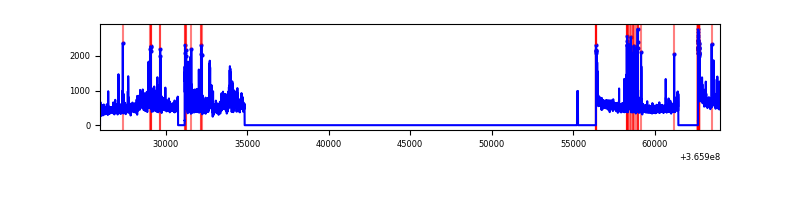 |
| D | 38050 | 14926 | 18 | 18 | 0.05% | 0.12% | 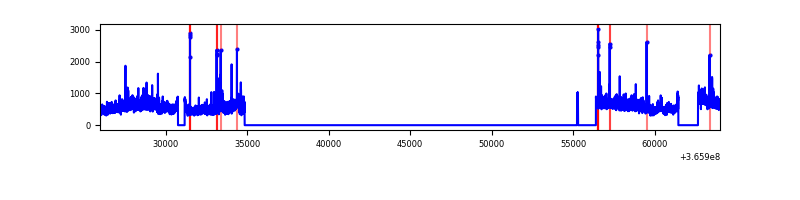 |
Top three noisy pixels from each quadrant. If the there are fewer than three noisy pixels in the level2.evt file, extra rows are filled as -1
| Pixel properties | Quadrant properties | ||||||
|---|---|---|---|---|---|---|---|
| Quadrant | DetID | PixID | Counts | Sigma | Mean | Median | Sigma |
| A | 15 | 174 | 68548 | 179.47 | 1869 | 1832 | 371.7 |
| A | 12 | 96 | 36738 | 93.9 | 1869 | 1832 | 371.7 |
| A | 13 | 254 | 26105 | 65.3 | 1869 | 1832 | 371.7 |
| B | 6 | 159 | 4044234 | 11668.8 | 1846 | 1802 | 346.4 |
| B | 4 | 80 | 116848 | 332.09 | 1846 | 1802 | 346.4 |
| B | 10 | 245 | 49983 | 139.08 | 1846 | 1802 | 346.4 |
| C | 3 | 233 | 719219 | 1739.86 | 1783 | 1797 | 412.3 |
| C | 10 | 22 | 394409 | 952.14 | 1783 | 1797 | 412.3 |
| C | 0 | 10 | 348571 | 840.98 | 1783 | 1797 | 412.3 |
| D | 8 | 195 | 1688546 | 3942.38 | 1815 | 1762 | 427.9 |
| D | 2 | 250 | 83155 | 190.23 | 1815 | 1762 | 427.9 |
| D | 2 | 234 | 71129 | 162.13 | 1815 | 1762 | 427.9 |
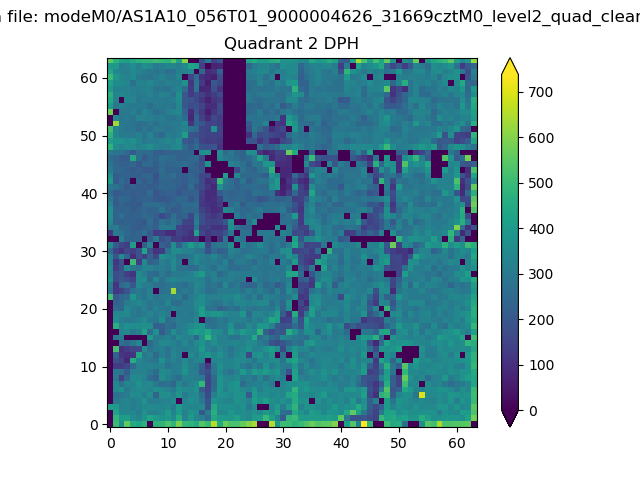
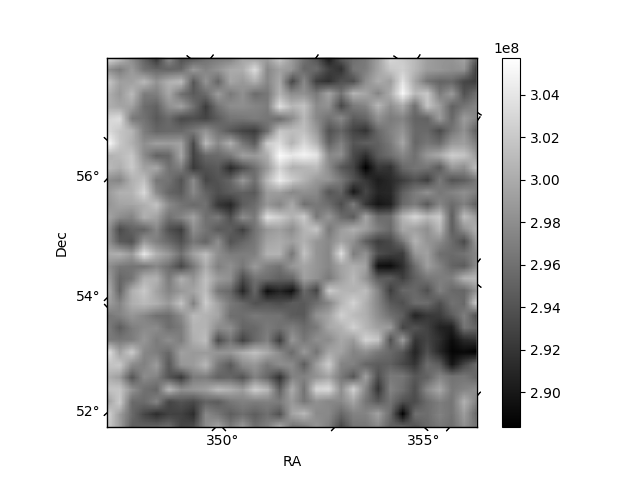
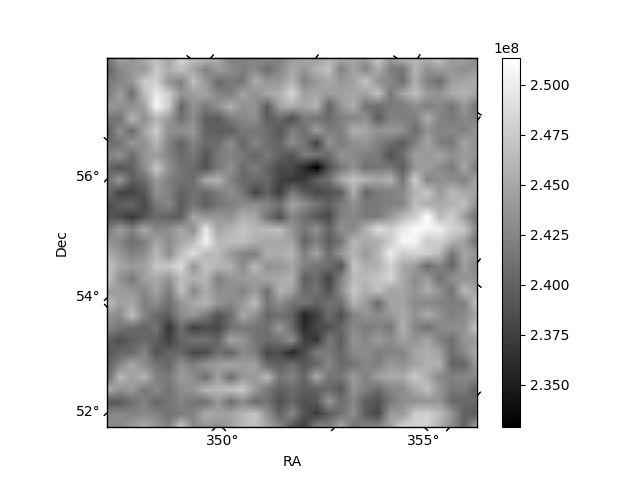
Histogram calculated using DETX and DETY for each event in the final _common_clean file
| Quadrant A | 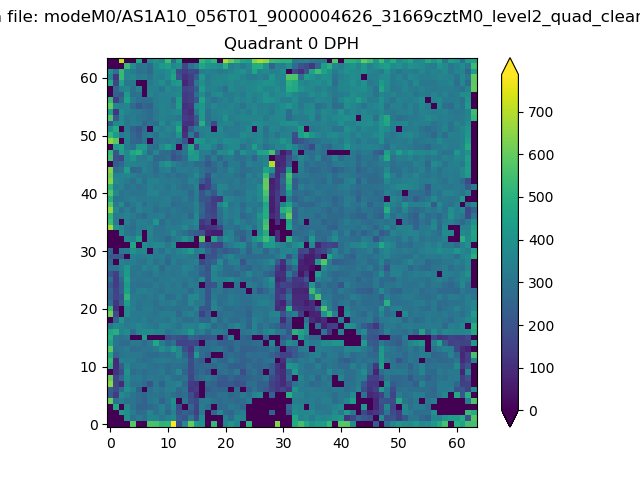 |
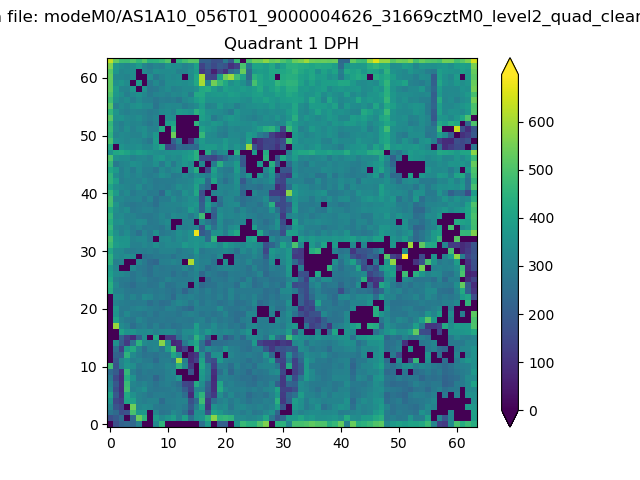 |
Quadrant B |
|---|---|---|---|
| Quadrant D | 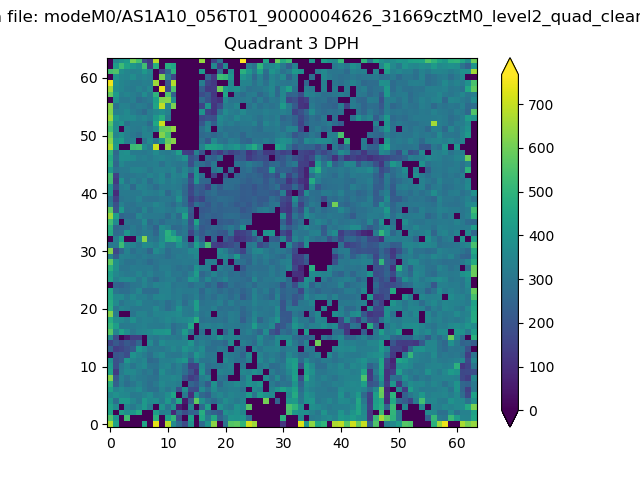 |
 |
Quadrant C |
| Plot type | Count rate plots | Images |
|---|---|---|
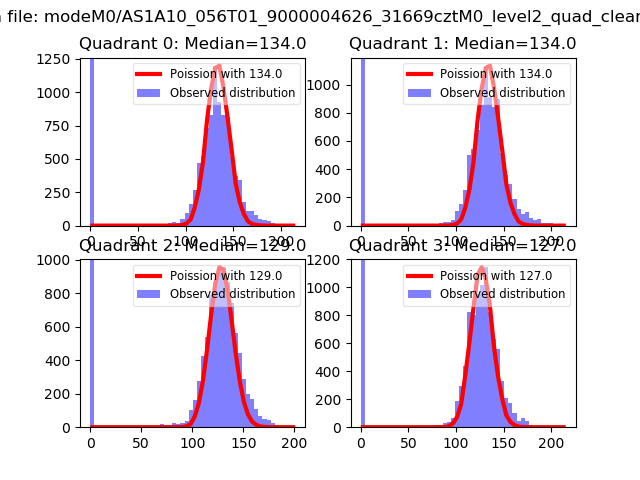
| Comparison with Poisson distribution Blue bars denote a histogram of data divided into 1 sec bins. Red curve is a Poisson curve with rate = median count rate of data. |
 |
 |
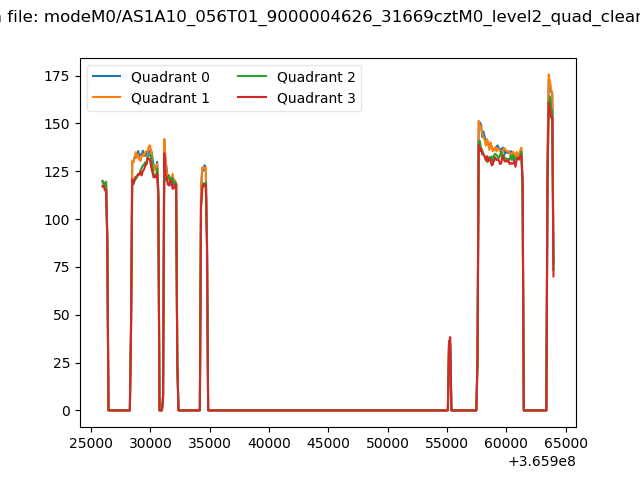
| Quadrant-wise count rates Data is divided into 100 sec bins |
 |
|
| Module-wise count rates for Quadrant A Data is divided into 100 sec bins |
 |
 |
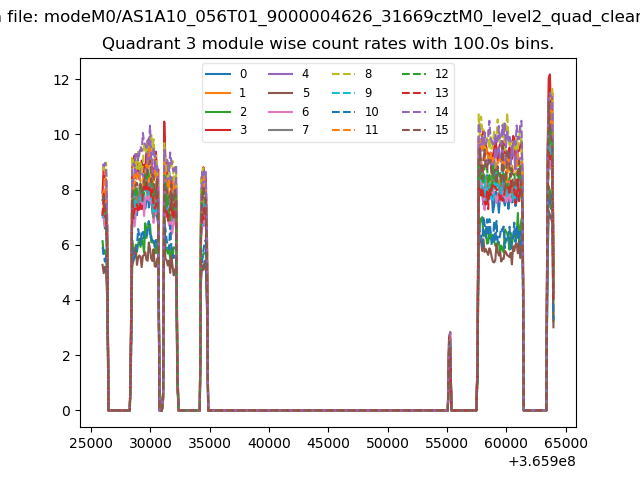
| Module-wise count rates for Quadrant B Data is divided into 100 sec bins |
 |
 |
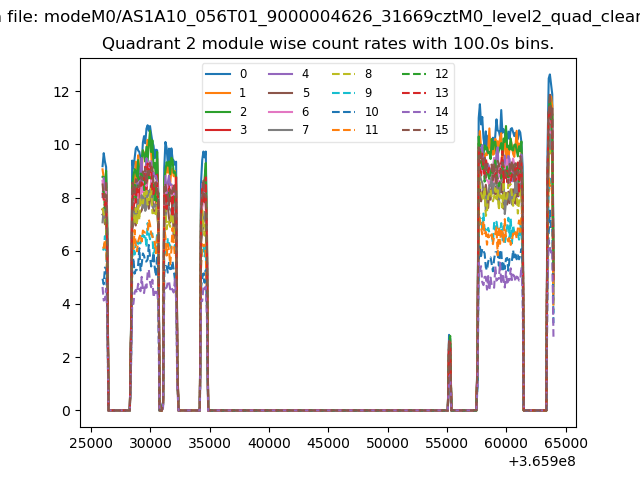
| Module-wise count rates for Quadrant C Data is divided into 100 sec bins |
 |
 |
| Module-wise count rates for Quadrant D Data is divided into 100 sec bins |
 |
 |
| Parameter | Plot |
|---|---|
| CZT HV Monitor |  |
| D_VDD | 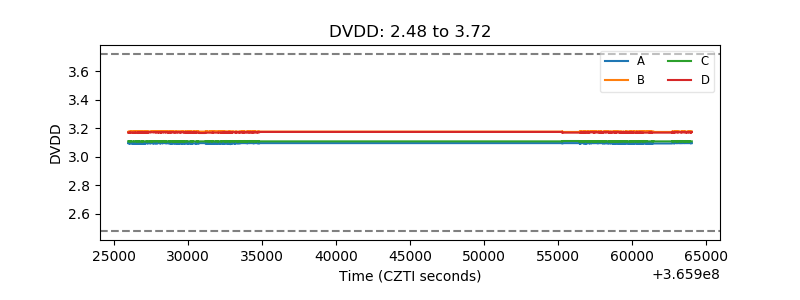 |
| Temperature 1 | 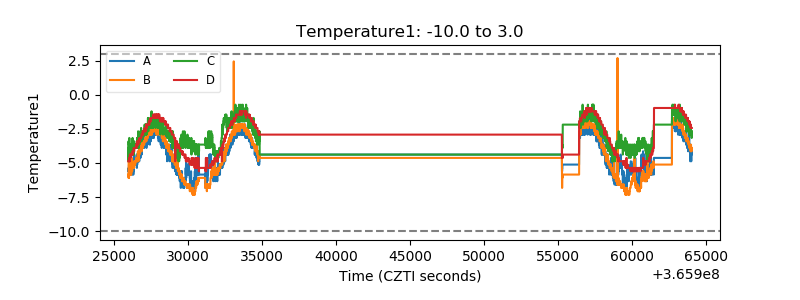 |
| Veto HV Monitor |  |
| Veto LLD | 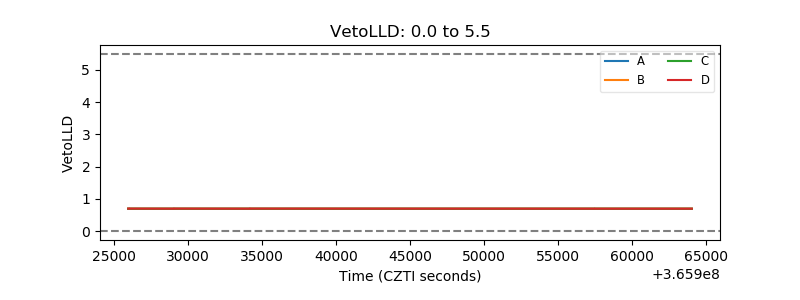 |
| Alpha Counter | 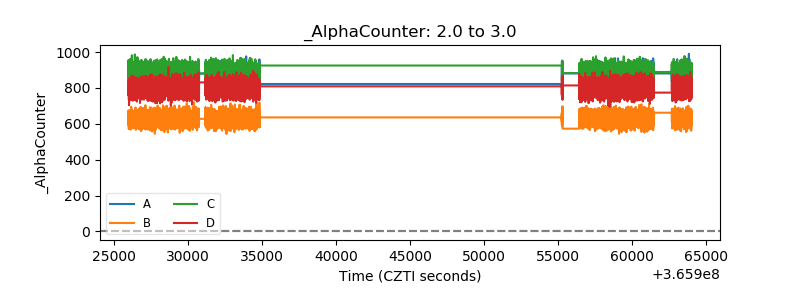 |
| _CPM_Rate | 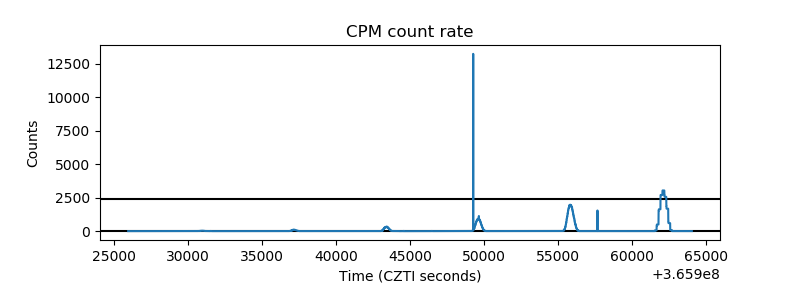 |
| CZT Counter | 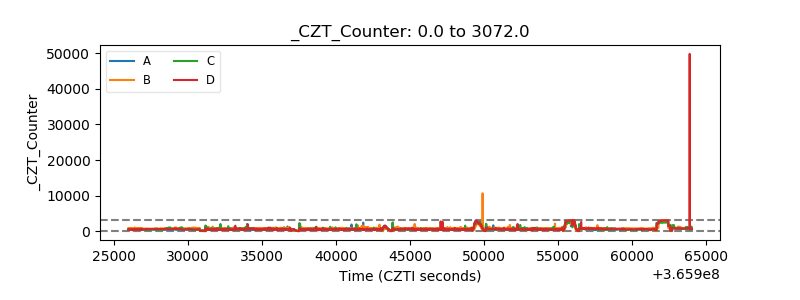 |
| +2.5 Volts monitor | 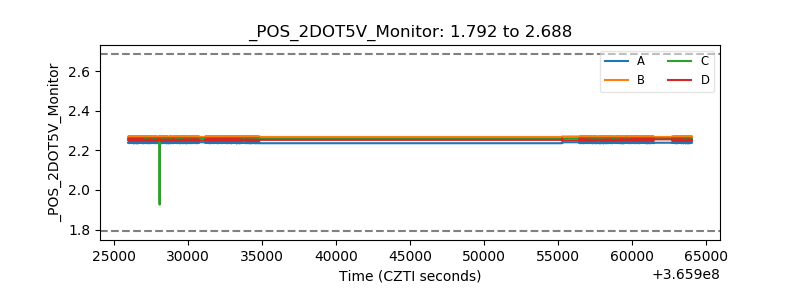 |
| +5 Volts monitor |  |
| _ROLL_ROT | 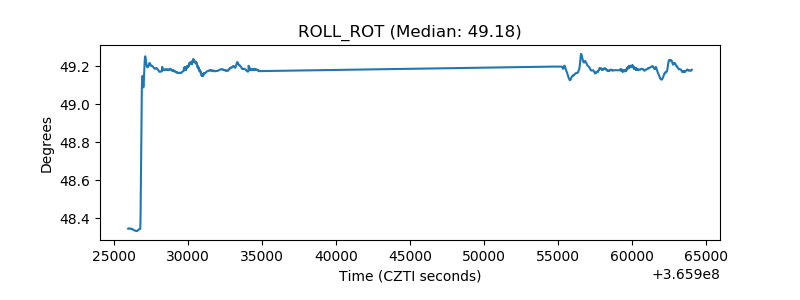 |
| _Roll_DEC | 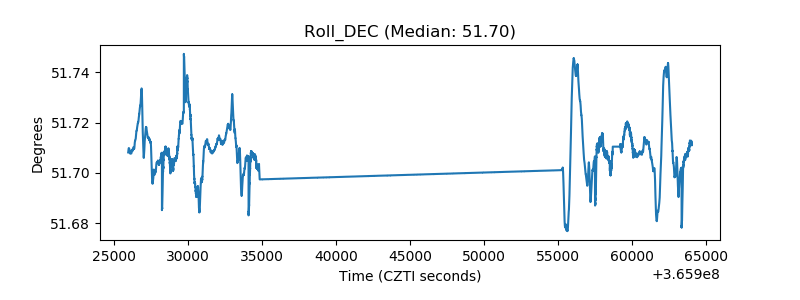 |
| _Roll_RA | 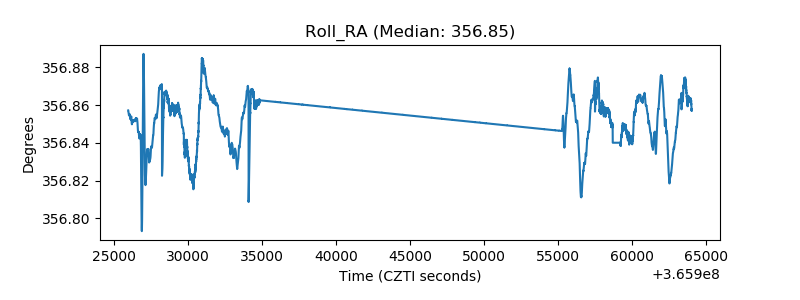 |
| Veto Counter |  |