| Param | Original file | Final file |
|---|---|---|
| Filename | modeM0/AS1A10_056T01_9000004626_31670cztM0_level2.evt | modeM0/AS1A10_056T01_9000004626_31670cztM0_level2_quad_clean.evt |
| Size (bytes) | 582,226,560 | 110,145,600 |
| Size | 555.3 MB | 105.0 MB |
| Events in quadrant A | 3,437,281 | 735,041 |
| Events in quadrant B | 5,477,258 | 741,377 |
| Events in quadrant C | 4,239,930 | 717,467 |
| Events in quadrant D | 4,049,082 | 699,455 |
| Mode M0 | |||
|---|---|---|---|
| Quadrant | BADHDUFLAG | Total packets | Discarded packets |
| A | 0 | 14461 | 2 |
| B | 0 | 20802 | 2 |
| C | 0 | 16838 | 2 |
| D | 0 | 16332 | 2 |
| Mode M9 | |||
|---|---|---|---|
| Quadrant | BADHDUFLAG | Total packets | Discarded packets |
| A | 0 | 25 | 0 |
| B | 0 | 25 | 0 |
| C | 0 | 25 | 0 |
| D | 0 | 25 | 0 |
| Mode SS | |||
|---|---|---|---|
| Quadrant | BADHDUFLAG | Total packets | Discarded packets |
| A | 0 | 132 | 0 |
| B | 0 | 132 | 0 |
| C | 0 | 132 | 0 |
| D | 0 | 132 | 0 |
| Quadrant | Total seconds | Saturated seconds | Saturation percentage |
|---|---|---|---|
| A | 6338 | 117 | 1.846008% |
| B | 6339 | 251 | 3.959615% |
| C | 6339 | 414 | 6.530999% |
| D | 6339 | 123 | 1.940369% |
Noise dominated data is calculated using 1-second bins in cleaned event files. If a bin has >2000 counts, and if more than 50% of those come from <1% of pixels, then it is considered to be noise-dominated and hence unusable.
| Quadrant | # 1 sec bins | Bins with >0 counts | Bins with >2000 counts | High rate bins dominated by noise | Noise dominated (total time) | Noise dominated (detector-on time) | Marked lightcurve |
|---|---|---|---|---|---|---|---|
| A | 8838 | 6340 | 0 | 0 | 0.00% | 0.00% | 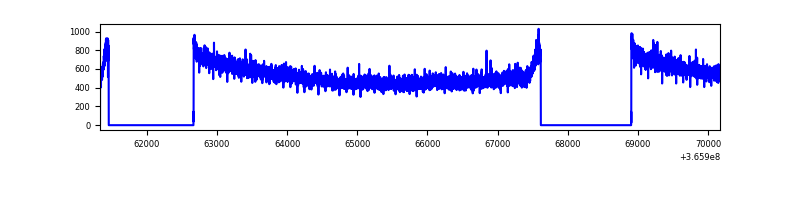 |
| B | 8839 | 6341 | 27 | 27 | 0.31% | 0.43% | 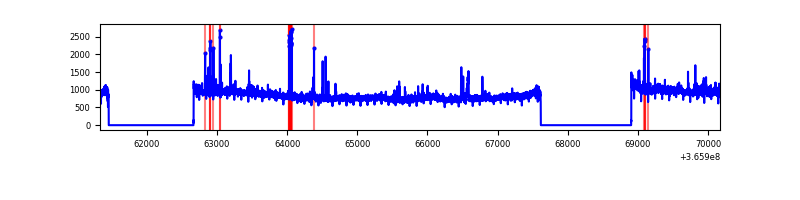 |
| C | 8839 | 6341 | 108 | 108 | 1.22% | 1.70% | 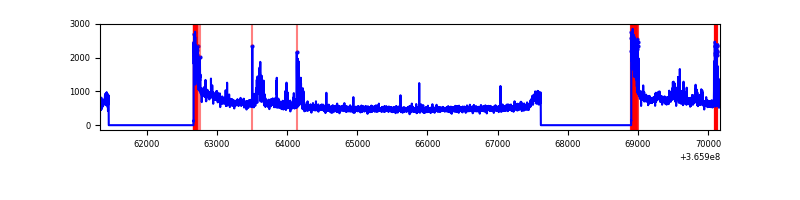 |
| D | 8839 | 6341 | 25 | 25 | 0.28% | 0.39% | 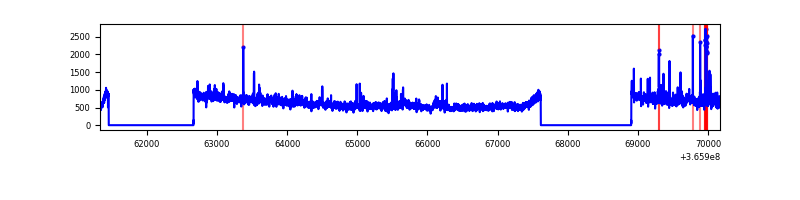 |
Top three noisy pixels from each quadrant. If the there are fewer than three noisy pixels in the level2.evt file, extra rows are filled as -1
| Pixel properties | Quadrant properties | ||||||
|---|---|---|---|---|---|---|---|
| Quadrant | DetID | PixID | Counts | Sigma | Mean | Median | Sigma |
| A | 13 | 254 | 12609 | 66.74 | 889 | 875 | 175.8 |
| A | 3 | 137 | 8154 | 41.4 | 889 | 875 | 175.8 |
| A | 0 | 226 | 7538 | 37.89 | 889 | 875 | 175.8 |
| B | 6 | 159 | 1773853 | 10893.98 | 881 | 860 | 162.7 |
| B | 0 | 190 | 66767 | 404.96 | 881 | 860 | 162.7 |
| B | 4 | 80 | 54202 | 327.75 | 881 | 860 | 162.7 |
| C | 0 | 10 | 394567 | 2023.56 | 851 | 857 | 194.6 |
| C | 10 | 22 | 205059 | 1049.54 | 851 | 857 | 194.6 |
| C | 14 | 238 | 136759 | 698.5 | 851 | 857 | 194.6 |
| D | 8 | 195 | 641150 | 3143.76 | 873 | 853 | 203.7 |
| D | 13 | 249 | 69956 | 339.28 | 873 | 853 | 203.7 |
| D | 2 | 234 | 26476 | 125.8 | 873 | 853 | 203.7 |
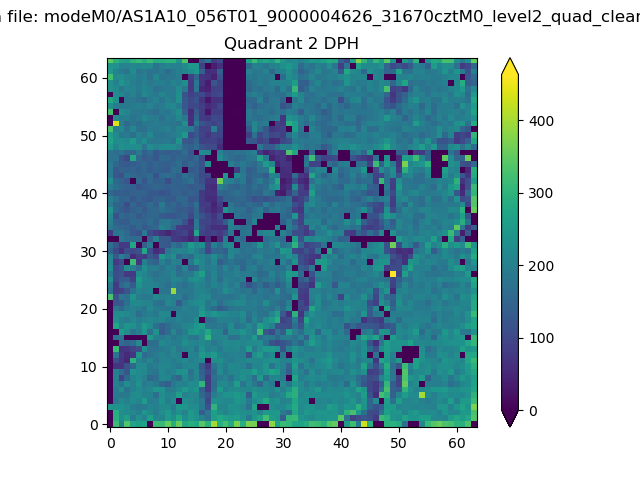
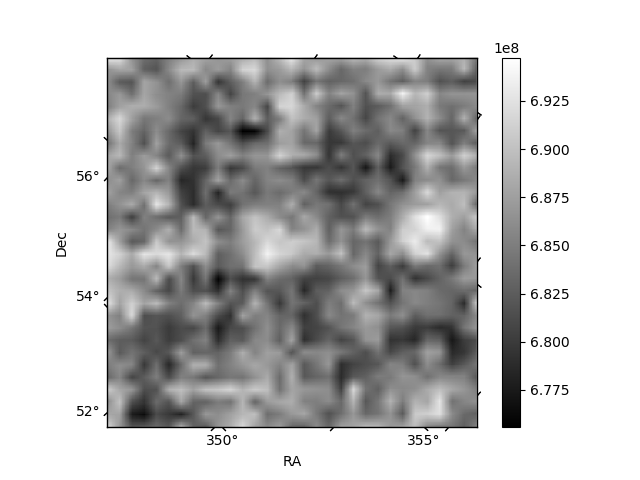
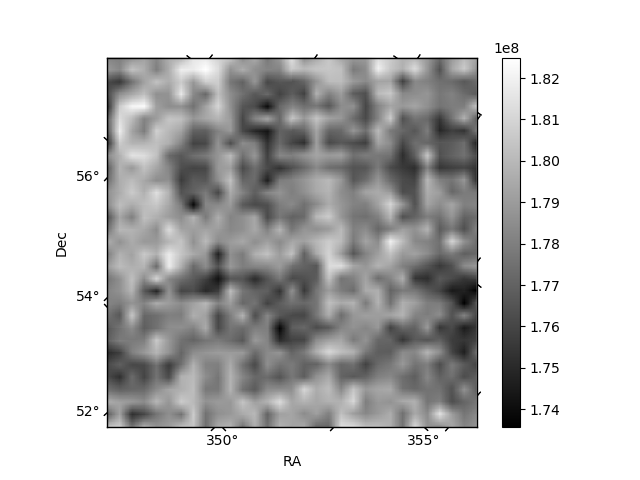
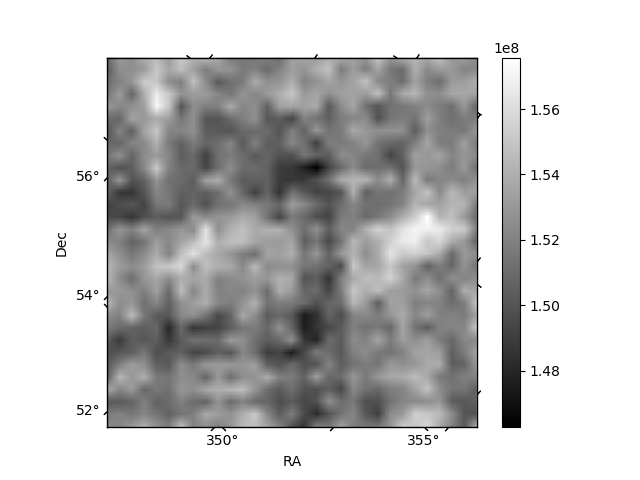
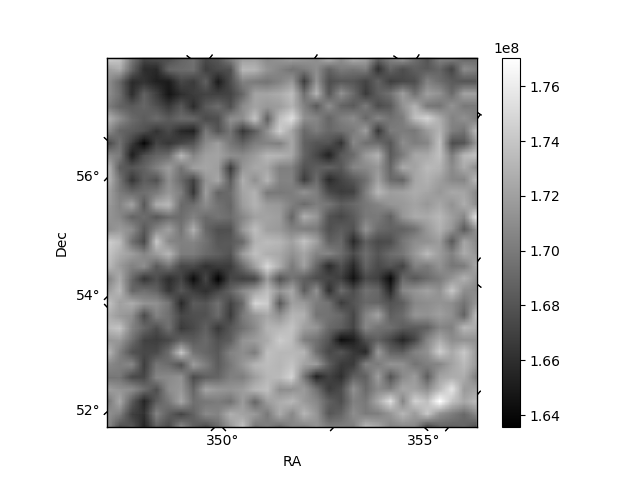
Histogram calculated using DETX and DETY for each event in the final _common_clean file
| Quadrant A | 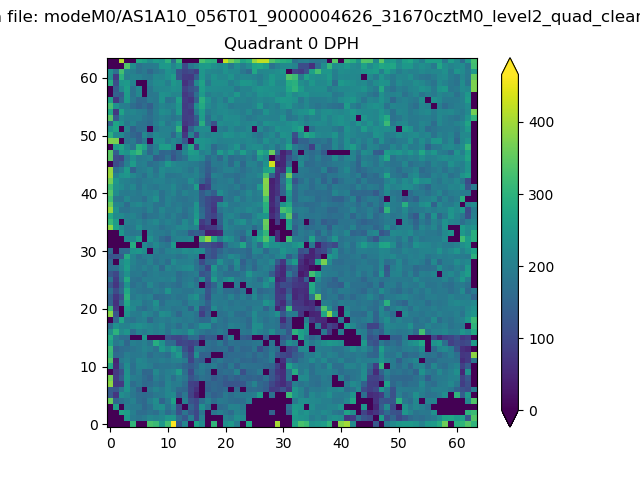 |
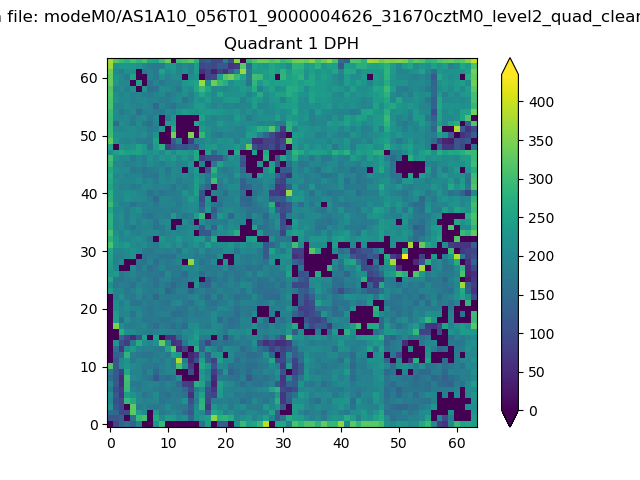 |
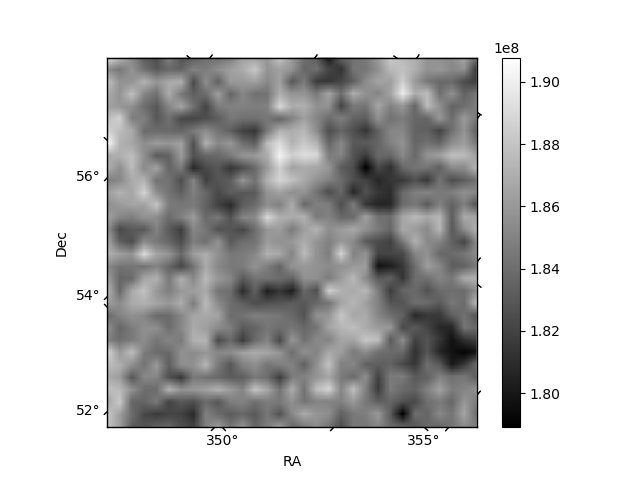
Quadrant B |
|---|---|---|---|
| Quadrant D | 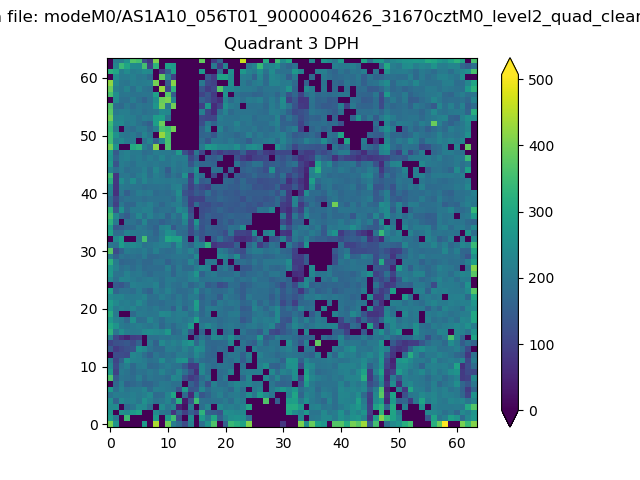 |
 |
Quadrant C |
| Plot type | Count rate plots | Images |
|---|---|---|
| Comparison with Poisson distribution Blue bars denote a histogram of data divided into 1 sec bins. Red curve is a Poisson curve with rate = median count rate of data. |
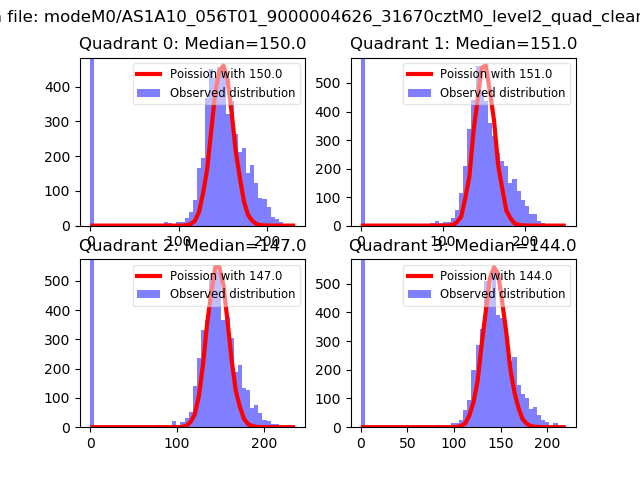 |
 |
| Quadrant-wise count rates Data is divided into 100 sec bins |
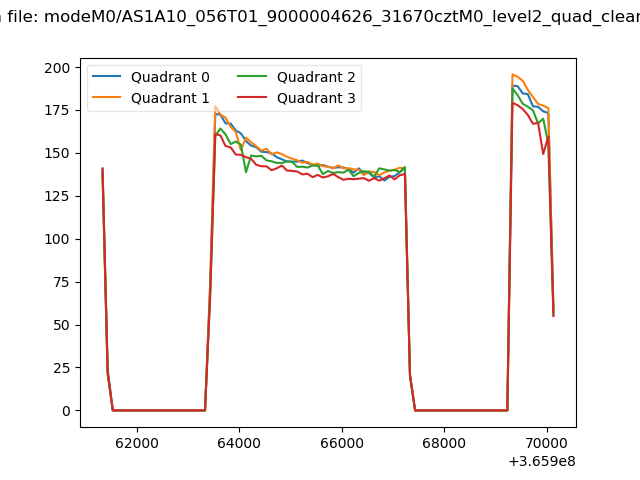 |
|
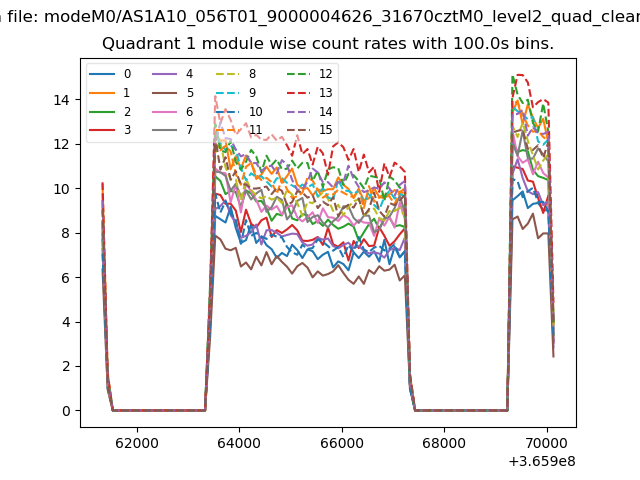
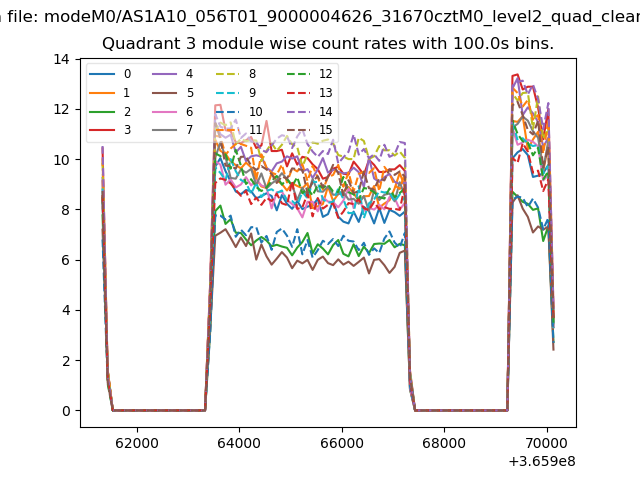
| Module-wise count rates for Quadrant A Data is divided into 100 sec bins |
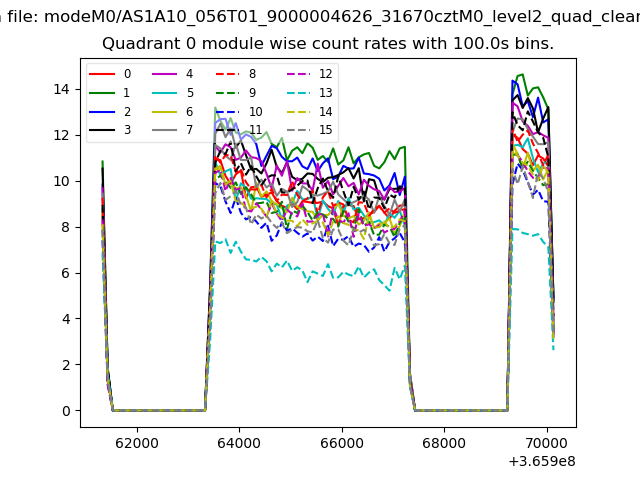 |
 |
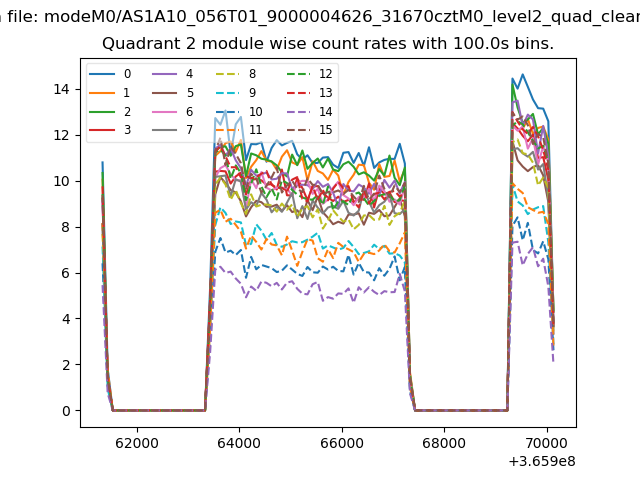
| Module-wise count rates for Quadrant B Data is divided into 100 sec bins |
 |
 |
| Module-wise count rates for Quadrant C Data is divided into 100 sec bins |
 |
 |
| Module-wise count rates for Quadrant D Data is divided into 100 sec bins |
 |
 |
| Parameter | Plot |
|---|---|
| CZT HV Monitor | 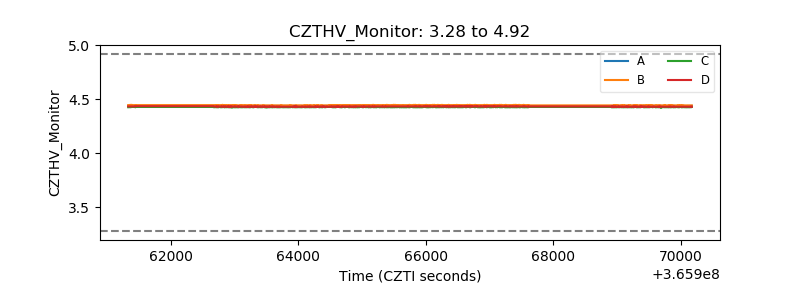 |
| D_VDD | 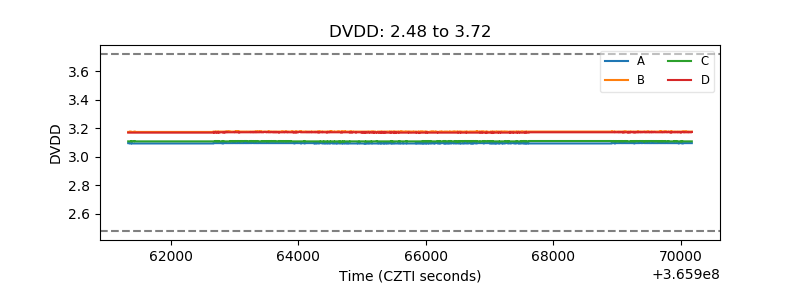 |
| Temperature 1 | 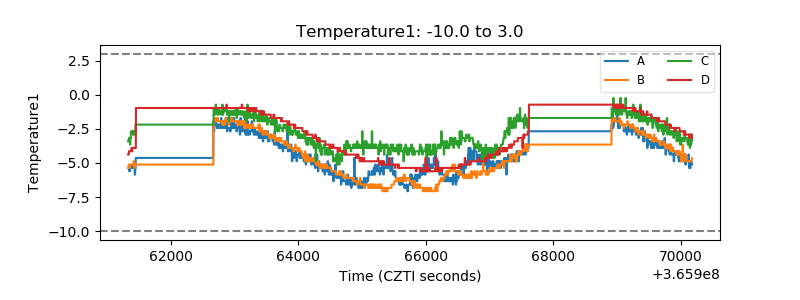 |
| Veto HV Monitor |  |
| Veto LLD | 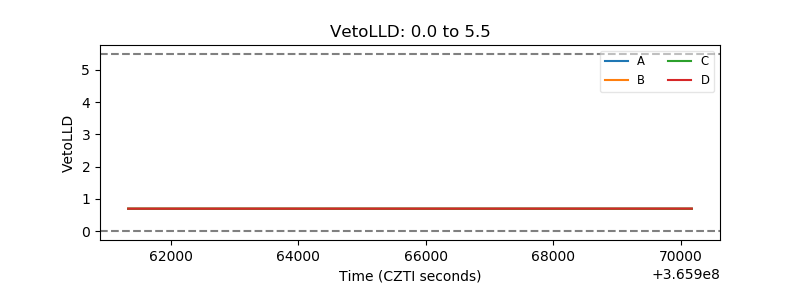 |
| Alpha Counter | 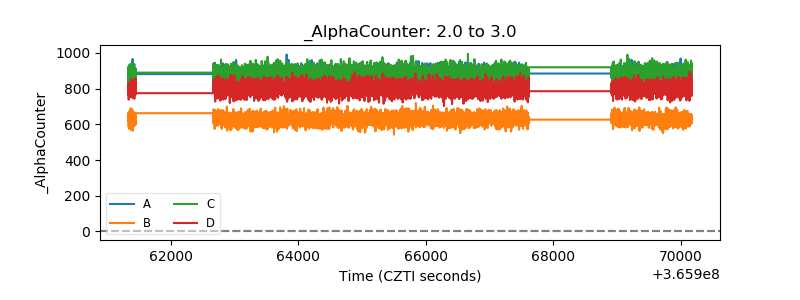 |
| _CPM_Rate | 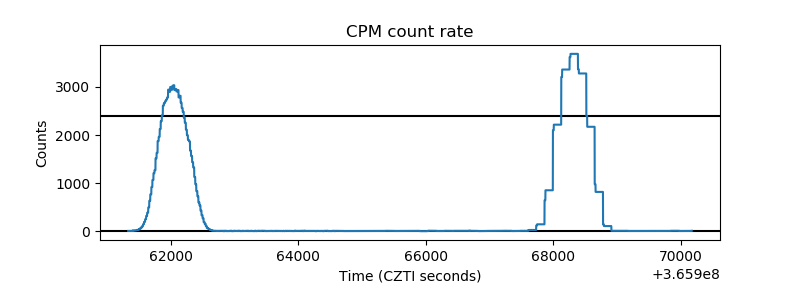 |
| CZT Counter | 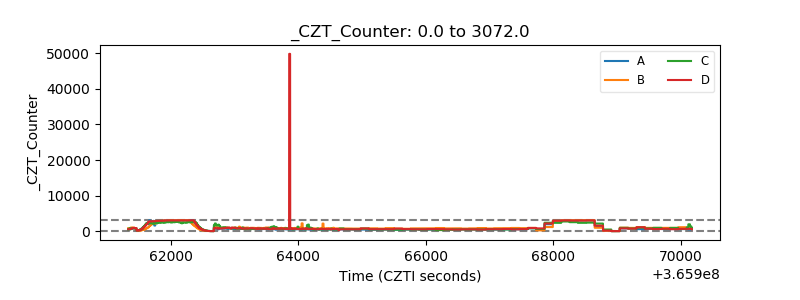 |
| +2.5 Volts monitor |  |
| +5 Volts monitor |  |
| _ROLL_ROT | 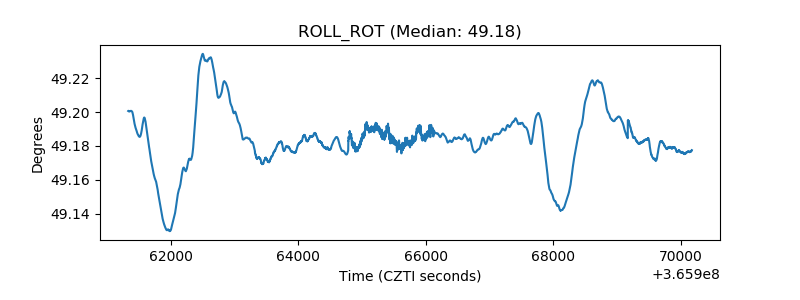 |
| _Roll_DEC |  |
| _Roll_RA | 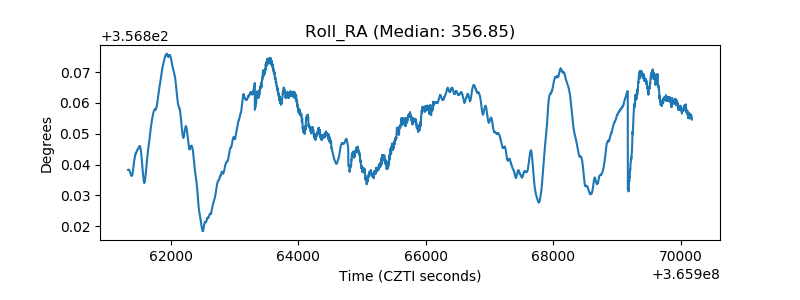 |
| Veto Counter | 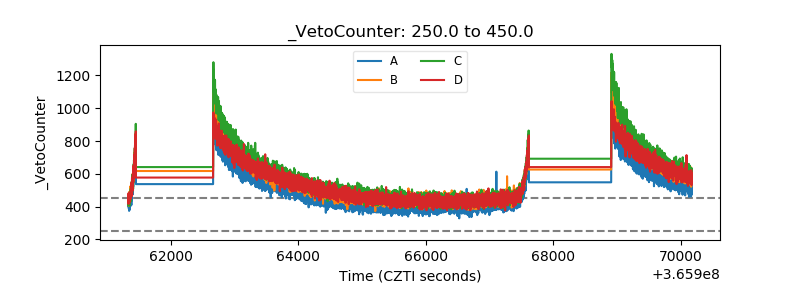 |