| Param | Original file | Final file |
|---|---|---|
| Filename | modeM0/AS1A10_056T01_9000004626_31672cztM0_level2.evt | modeM0/AS1A10_056T01_9000004626_31672cztM0_level2_quad_clean.evt |
| Size (bytes) | 559,805,760 | 121,138,560 |
| Size | 533.9 MB | 115.5 MB |
| Events in quadrant A | 3,330,900 | 817,339 |
| Events in quadrant B | 5,156,381 | 839,657 |
| Events in quadrant C | 4,013,801 | 798,604 |
| Events in quadrant D | 4,029,543 | 777,036 |
| Mode M0 | |||
|---|---|---|---|
| Quadrant | BADHDUFLAG | Total packets | Discarded packets |
| A | 0 | 13895 | 2 |
| B | 0 | 19483 | 3 |
| C | 0 | 16032 | 2 |
| D | 0 | 16051 | 2 |
| Mode M9 | |||
|---|---|---|---|
| Quadrant | BADHDUFLAG | Total packets | Discarded packets |
| A | 0 | 28 | 0 |
| B | 0 | 28 | 0 |
| C | 0 | 28 | 0 |
| D | 0 | 28 | 0 |
| Mode SS | |||
|---|---|---|---|
| Quadrant | BADHDUFLAG | Total packets | Discarded packets |
| A | 0 | 128 | 0 |
| B | 0 | 128 | 0 |
| C | 0 | 128 | 0 |
| D | 0 | 128 | 0 |
| Quadrant | Total seconds | Saturated seconds | Saturation percentage |
|---|---|---|---|
| A | 6256 | 105 | 1.678389% |
| B | 6255 | 179 | 2.861711% |
| C | 6256 | 373 | 5.962276% |
| D | 6256 | 123 | 1.966113% |
Noise dominated data is calculated using 1-second bins in cleaned event files. If a bin has >2000 counts, and if more than 50% of those come from <1% of pixels, then it is considered to be noise-dominated and hence unusable.
| Quadrant | # 1 sec bins | Bins with >0 counts | Bins with >2000 counts | High rate bins dominated by noise | Noise dominated (total time) | Noise dominated (detector-on time) | Marked lightcurve |
|---|---|---|---|---|---|---|---|
| A | 8991 | 6258 | 7 | 7 | 0.08% | 0.11% | 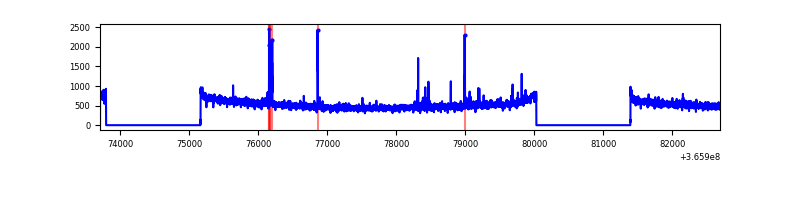 |
| B | 8990 | 6257 | 3 | 3 | 0.03% | 0.05% | 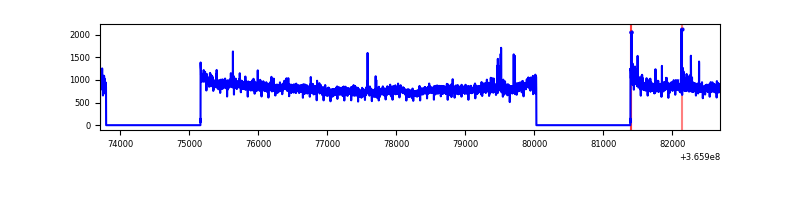 |
| C | 8991 | 6258 | 108 | 108 | 1.20% | 1.73% | 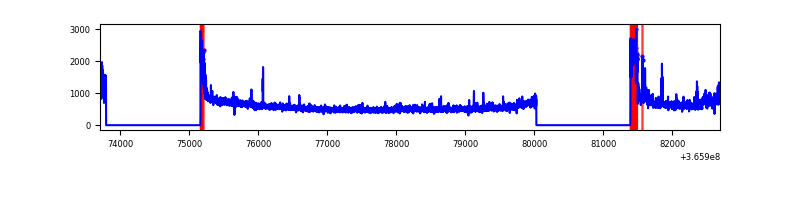 |
| D | 8991 | 6258 | 32 | 32 | 0.36% | 0.51% | 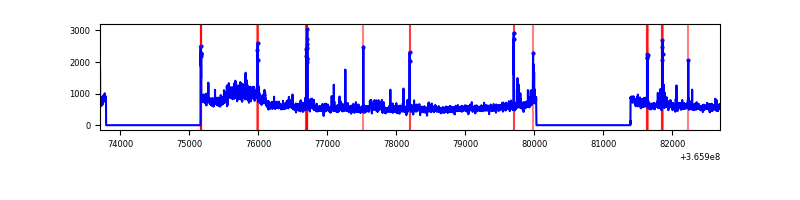 |
Top three noisy pixels from each quadrant. If the there are fewer than three noisy pixels in the level2.evt file, extra rows are filled as -1
| Pixel properties | Quadrant properties | ||||||
|---|---|---|---|---|---|---|---|
| Quadrant | DetID | PixID | Counts | Sigma | Mean | Median | Sigma |
| A | 12 | 96 | 61220 | 363.95 | 840 | 827 | 165.9 |
| A | 0 | 13 | 26547 | 155.0 | 840 | 827 | 165.9 |
| A | 13 | 254 | 11886 | 66.64 | 840 | 827 | 165.9 |
| B | 6 | 159 | 1712180 | 11008.87 | 844 | 826 | 155.5 |
| B | 0 | 190 | 37380 | 235.15 | 844 | 826 | 155.5 |
| B | 4 | 80 | 29107 | 181.93 | 844 | 826 | 155.5 |
| C | 0 | 10 | 382704 | 2049.54 | 810 | 818 | 186.3 |
| C | 3 | 233 | 263350 | 1408.98 | 810 | 818 | 186.3 |
| C | 14 | 238 | 133566 | 712.44 | 810 | 818 | 186.3 |
| D | 8 | 195 | 771541 | 4017.83 | 824 | 807 | 191.8 |
| D | 2 | 250 | 46537 | 238.39 | 824 | 807 | 191.8 |
| D | 13 | 249 | 44679 | 228.7 | 824 | 807 | 191.8 |
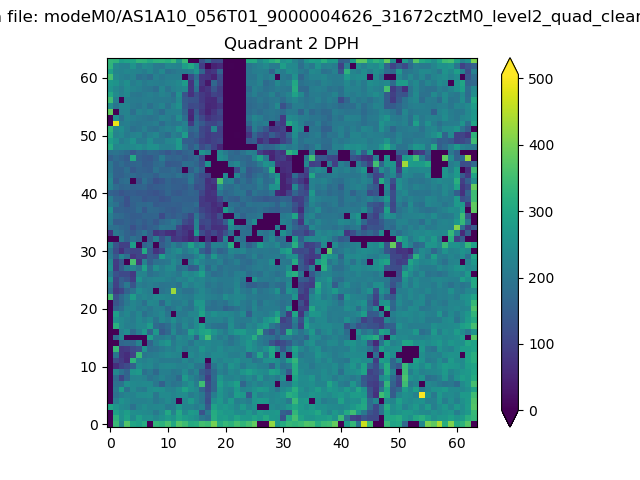
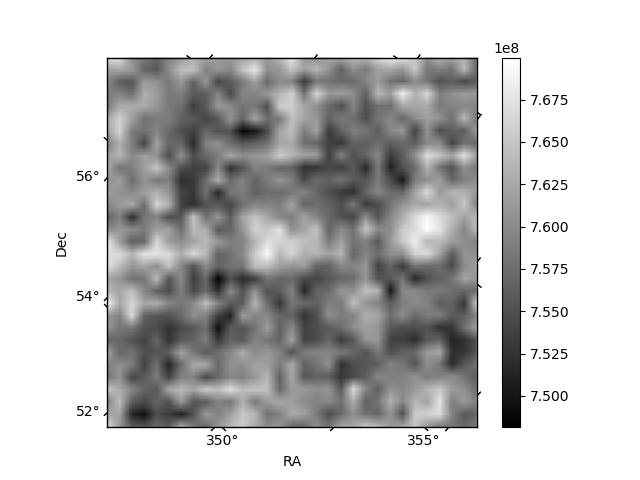
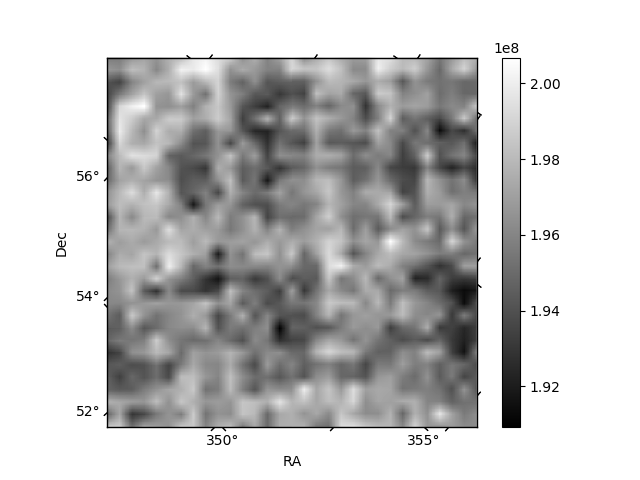
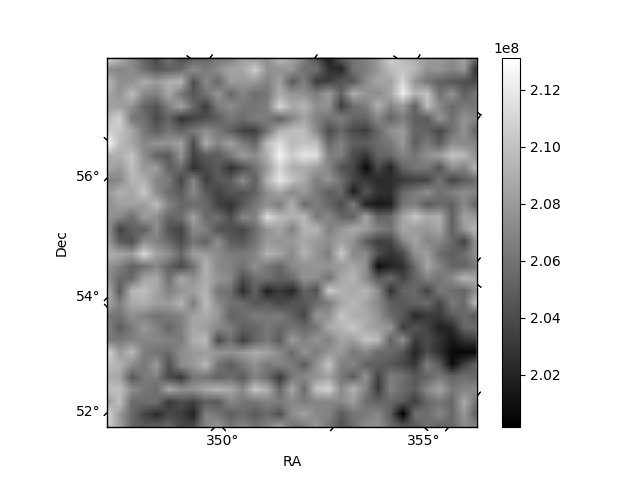
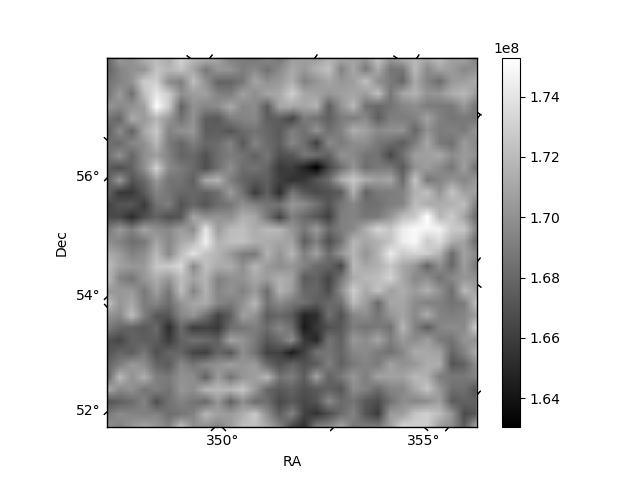
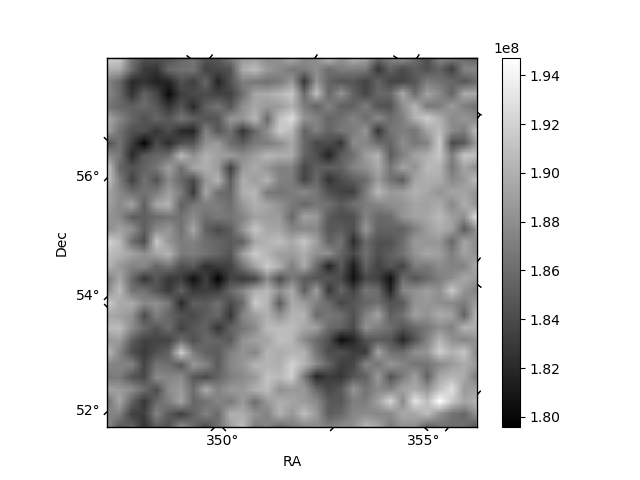
Histogram calculated using DETX and DETY for each event in the final _common_clean file
| Quadrant A | 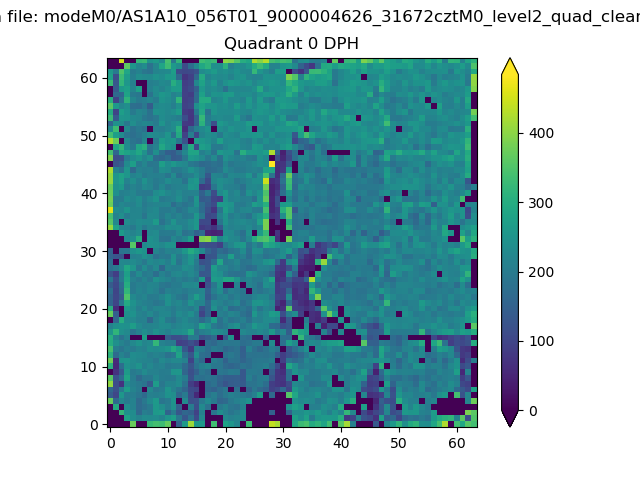 |
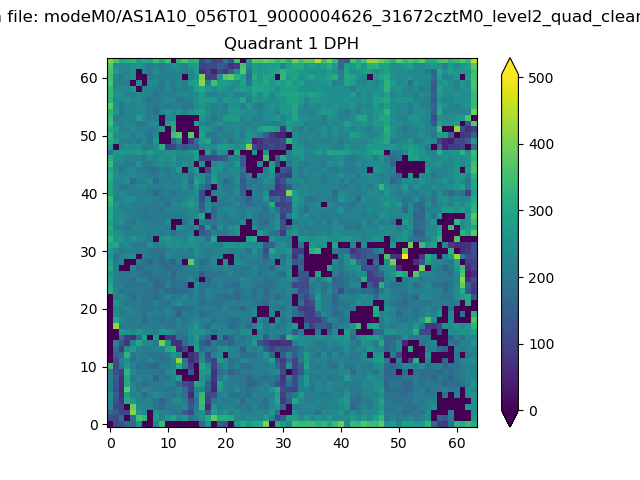 |
Quadrant B |
|---|---|---|---|
| Quadrant D | 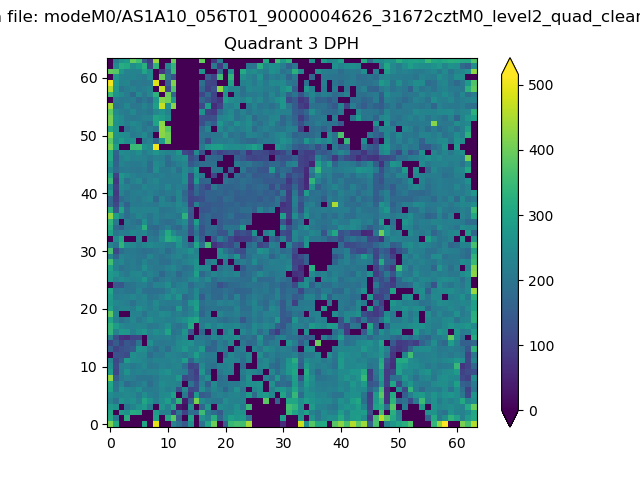 |
 |
Quadrant C |
| Plot type | Count rate plots | Images |
|---|---|---|
| Comparison with Poisson distribution Blue bars denote a histogram of data divided into 1 sec bins. Red curve is a Poisson curve with rate = median count rate of data. |
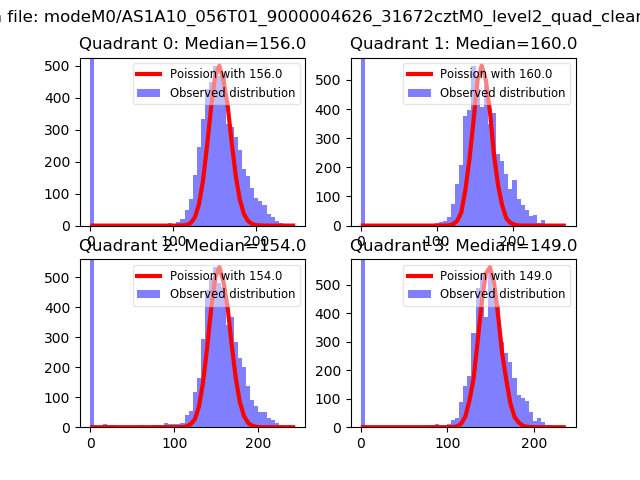 |
 |
| Quadrant-wise count rates Data is divided into 100 sec bins |
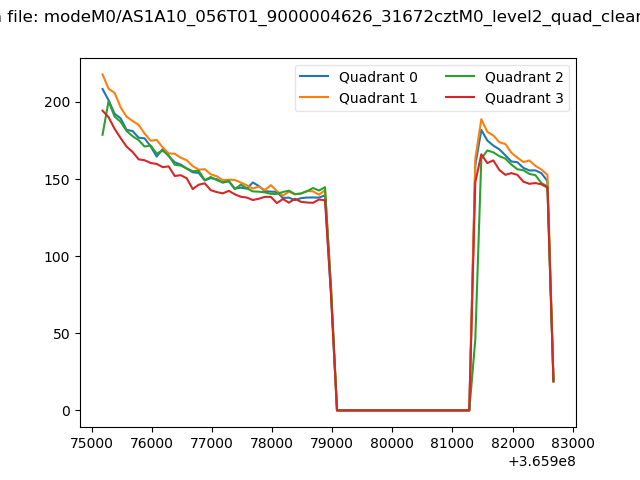 |
|
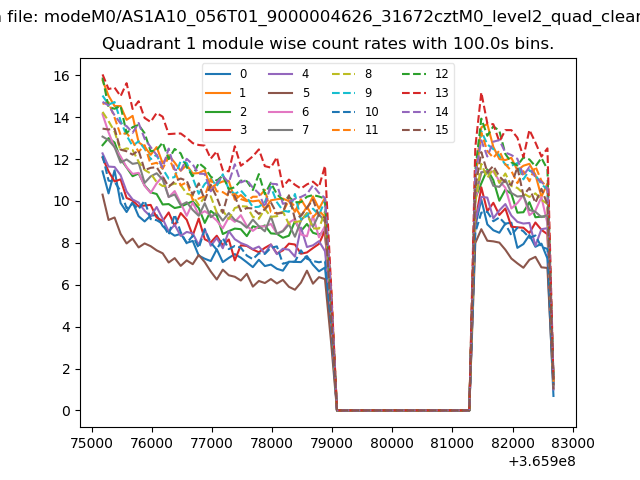
| Module-wise count rates for Quadrant A Data is divided into 100 sec bins |
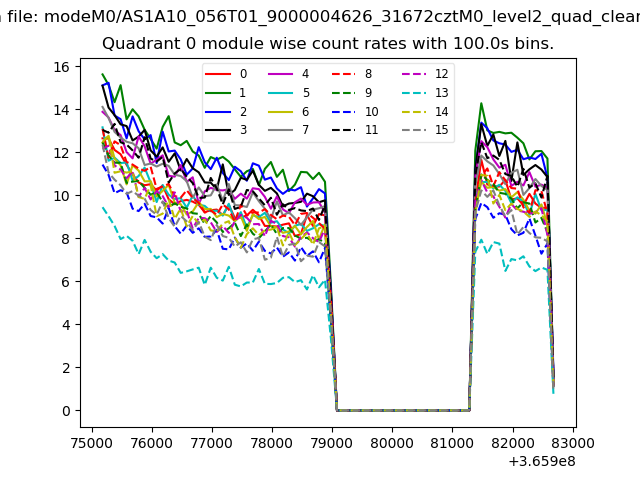 |
 |
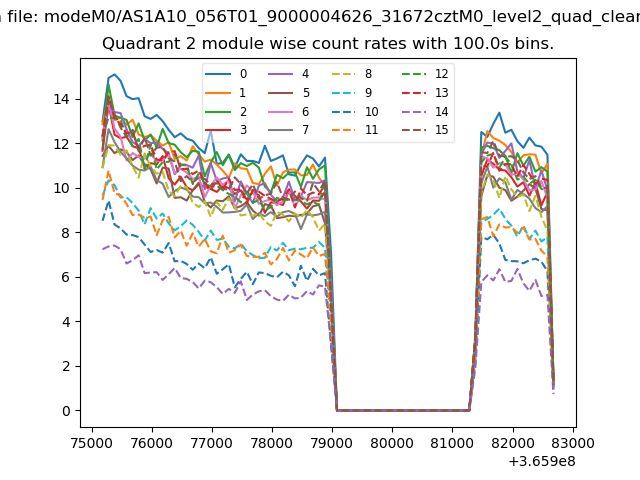
| Module-wise count rates for Quadrant B Data is divided into 100 sec bins |
 |
 |
| Module-wise count rates for Quadrant C Data is divided into 100 sec bins |
 |
 |
| Module-wise count rates for Quadrant D Data is divided into 100 sec bins |
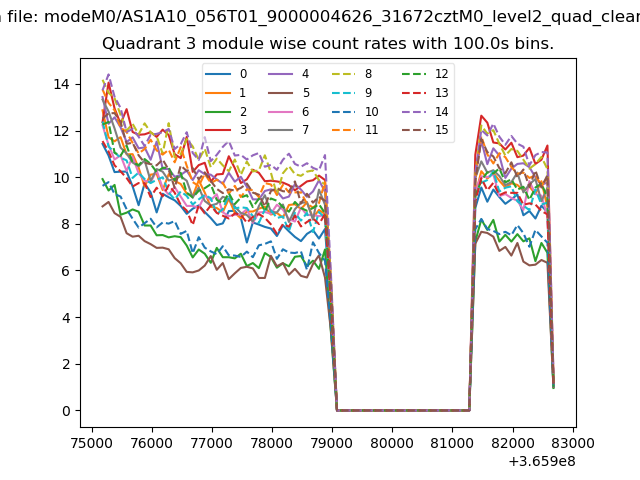 |
 |
| Parameter | Plot |
|---|---|
| CZT HV Monitor | 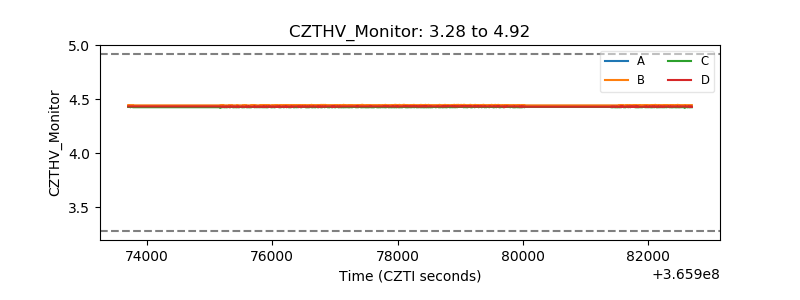 |
| D_VDD | 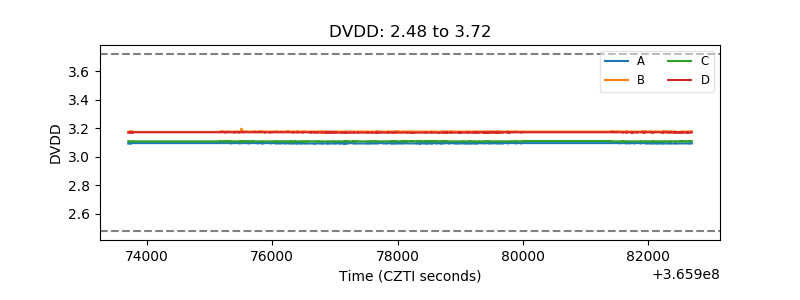 |
| Temperature 1 | 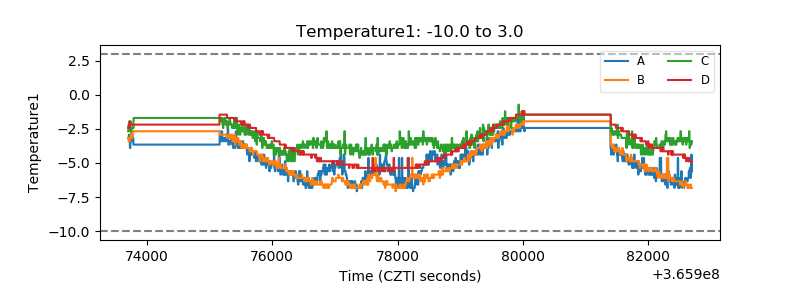 |
| Veto HV Monitor |  |
| Veto LLD | 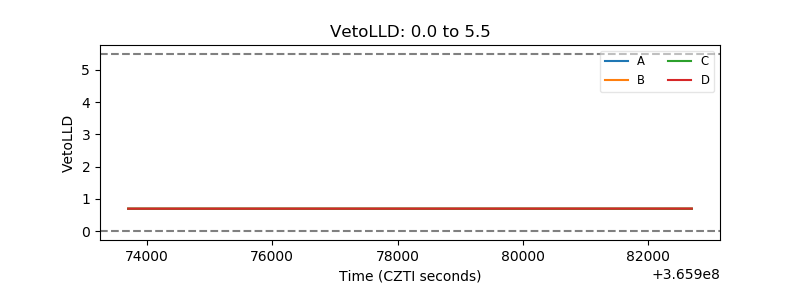 |
| Alpha Counter | 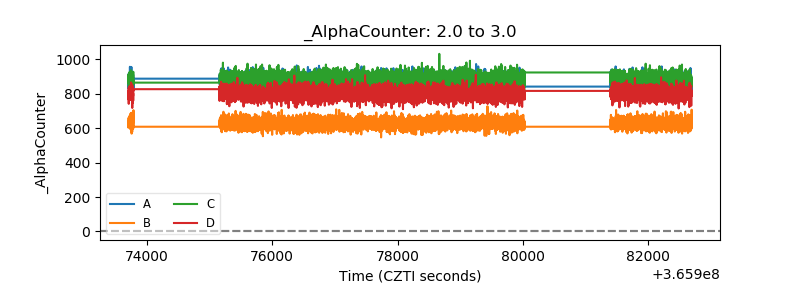 |
| _CPM_Rate | 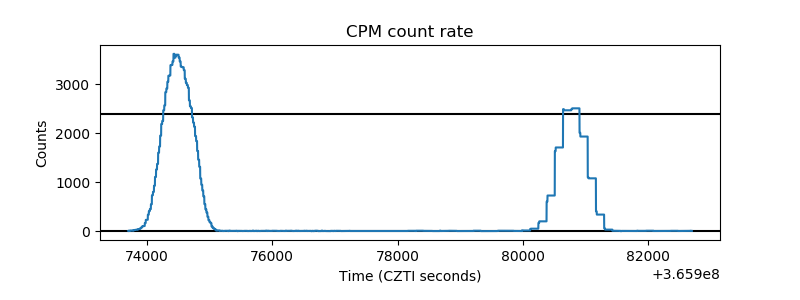 |
| CZT Counter | 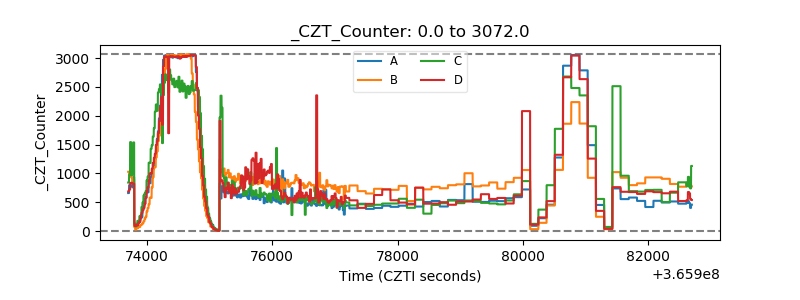 |
| +2.5 Volts monitor | 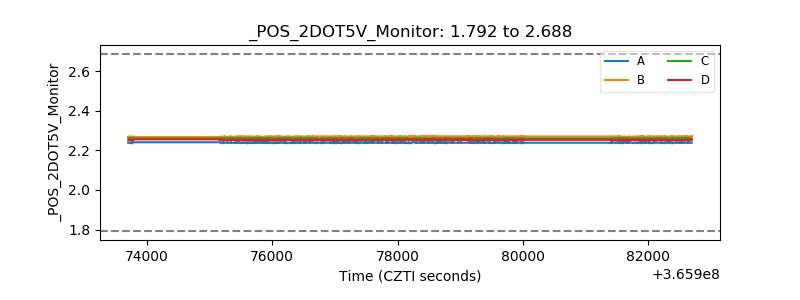 |
| +5 Volts monitor |  |
| _ROLL_ROT | 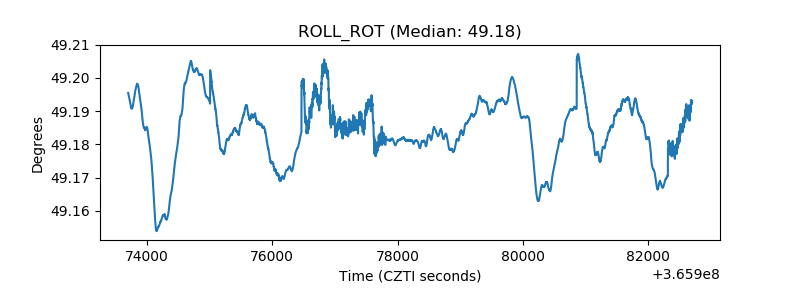 |
| _Roll_DEC | 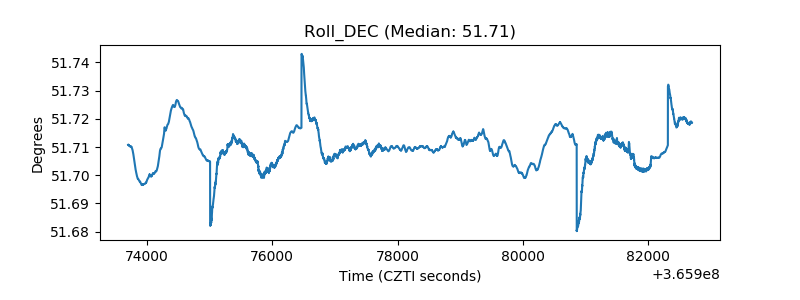 |
| _Roll_RA | 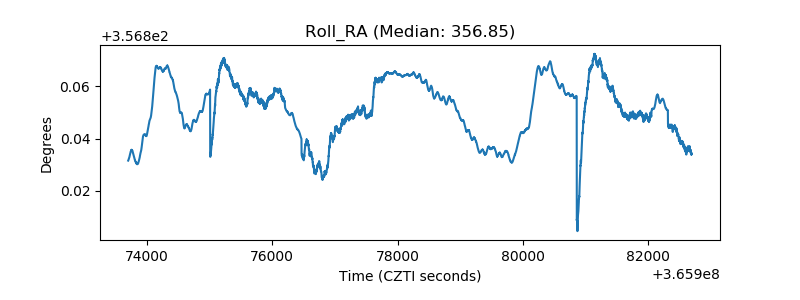 |
| Veto Counter | 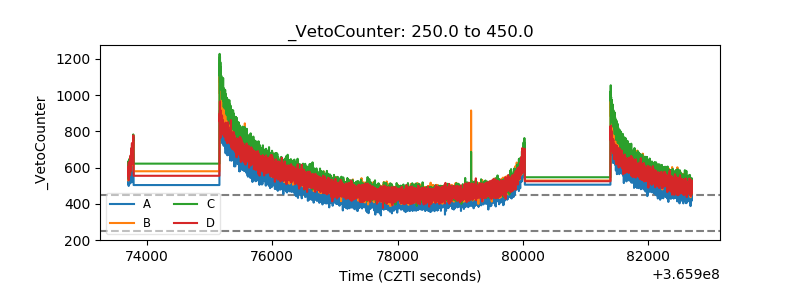 |