| Param | Original file | Final file |
|---|---|---|
| Filename | modeM0/AS1A10_056T01_9000004626_31674cztM0_level2.evt | modeM0/AS1A10_056T01_9000004626_31674cztM0_level2_quad_clean.evt |
| Size (bytes) | 626,650,560 | 98,815,680 |
| Size | 597.6 MB | 94.2 MB |
| Events in quadrant A | 4,203,891 | 617,530 |
| Events in quadrant B | 5,267,573 | 661,090 |
| Events in quadrant C | 5,397,145 | 616,465 |
| Events in quadrant D | 3,649,339 | 623,184 |
| Mode M0 | |||
|---|---|---|---|
| Quadrant | BADHDUFLAG | Total packets | Discarded packets |
| A | 0 | 17058 | 2 |
| B | 0 | 20721 | 4 |
| C | 0 | 20774 | 2 |
| D | 0 | 15260 | 2 |
| Mode M9 | |||
|---|---|---|---|
| Quadrant | BADHDUFLAG | Total packets | Discarded packets |
| A | 0 | 21 | 0 |
| B | 0 | 21 | 0 |
| C | 0 | 21 | 0 |
| D | 0 | 21 | 0 |
| Mode SS | |||
|---|---|---|---|
| Quadrant | BADHDUFLAG | Total packets | Discarded packets |
| A | 0 | 140 | 0 |
| B | 0 | 140 | 0 |
| C | 0 | 140 | 0 |
| D | 0 | 140 | 0 |
| Quadrant | Total seconds | Saturated seconds | Saturation percentage |
|---|---|---|---|
| A | 6805 | 431 | 6.333578% |
| B | 6805 | 138 | 2.027921% |
| C | 6805 | 403 | 5.922116% |
| D | 6805 | 21 | 0.308597% |
Noise dominated data is calculated using 1-second bins in cleaned event files. If a bin has >2000 counts, and if more than 50% of those come from <1% of pixels, then it is considered to be noise-dominated and hence unusable.
| Quadrant | # 1 sec bins | Bins with >0 counts | Bins with >2000 counts | High rate bins dominated by noise | Noise dominated (total time) | Noise dominated (detector-on time) | Marked lightcurve |
|---|---|---|---|---|---|---|---|
| A | 8940 | 6807 | 294 | 294 | 3.29% | 4.32% | 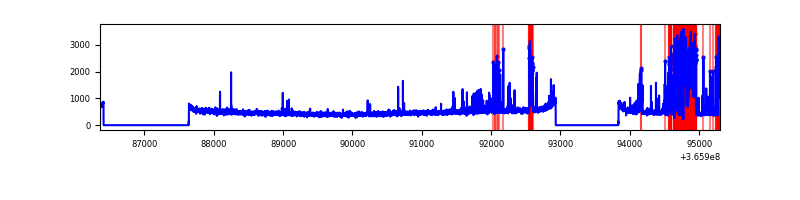 |
| B | 8940 | 6807 | 0 | 0 | 0.00% | 0.00% | 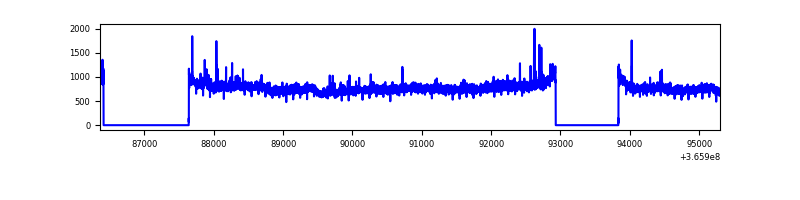 |
| C | 8940 | 6807 | 99 | 99 | 1.11% | 1.45% | 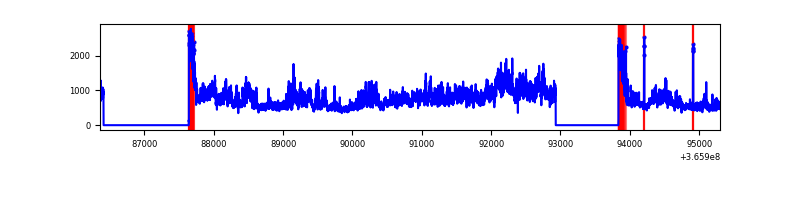 |
| D | 8940 | 6807 | 3 | 3 | 0.03% | 0.04% | 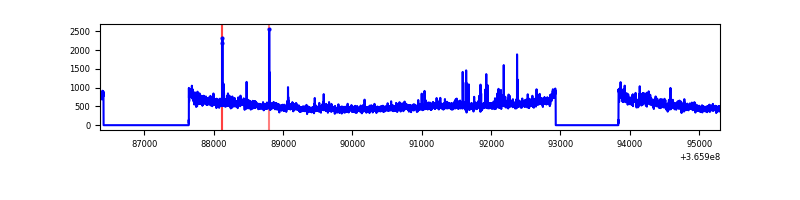 |
Top three noisy pixels from each quadrant. If the there are fewer than three noisy pixels in the level2.evt file, extra rows are filled as -1
| Pixel properties | Quadrant properties | ||||||
|---|---|---|---|---|---|---|---|
| Quadrant | DetID | PixID | Counts | Sigma | Mean | Median | Sigma |
| A | 0 | 13 | 1097701 | 6826.58 | 803 | 785 | 160.7 |
| A | 13 | 254 | 11328 | 65.61 | 803 | 785 | 160.7 |
| A | 3 | 137 | 8012 | 44.98 | 803 | 785 | 160.7 |
| B | 6 | 159 | 1891109 | 11984.35 | 832 | 810 | 157.7 |
| B | 10 | 245 | 27203 | 167.33 | 832 | 810 | 157.7 |
| B | 4 | 80 | 22501 | 137.52 | 832 | 810 | 157.7 |
| C | 3 | 233 | 1806894 | 9741.43 | 790 | 795 | 185.4 |
| C | 0 | 10 | 320723 | 1725.57 | 790 | 795 | 185.4 |
| C | 14 | 238 | 127643 | 684.17 | 790 | 795 | 185.4 |
| D | 8 | 195 | 549623 | 2847.54 | 808 | 785 | 192.7 |
| D | 2 | 250 | 31861 | 161.23 | 808 | 785 | 192.7 |
| D | 2 | 234 | 27297 | 137.55 | 808 | 785 | 192.7 |
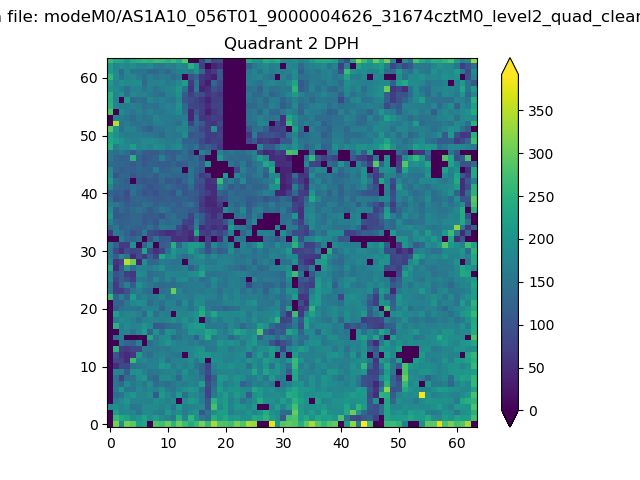
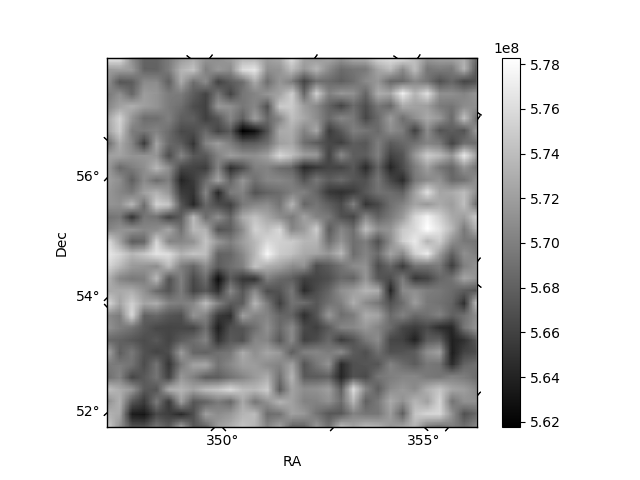
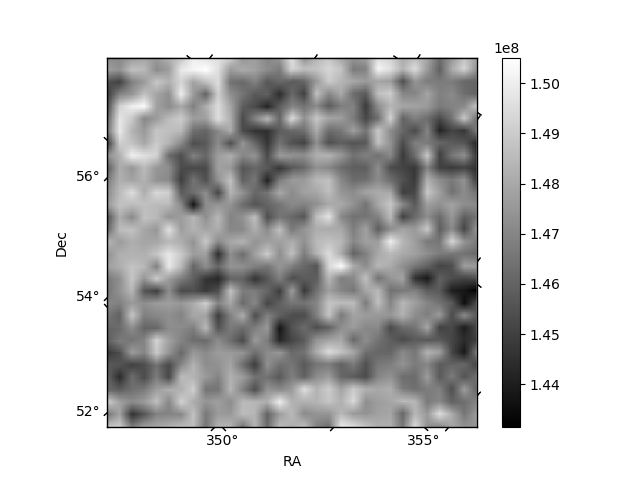
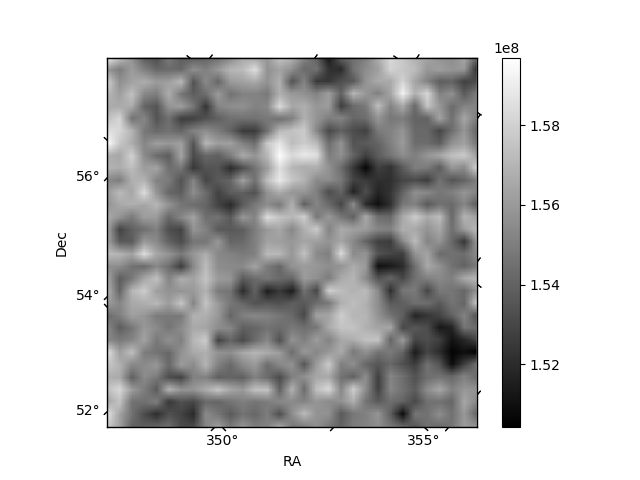
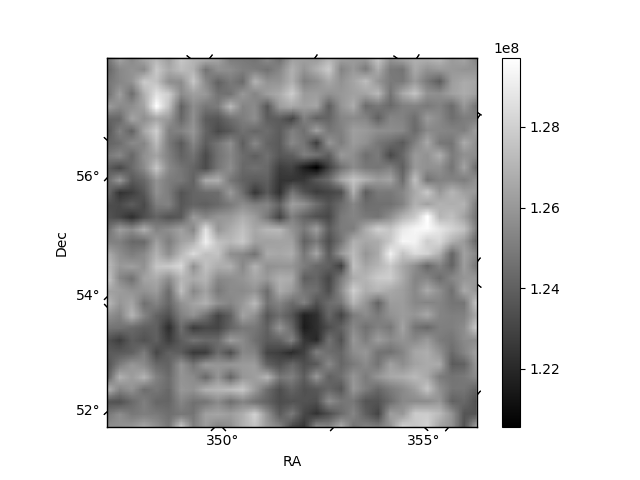
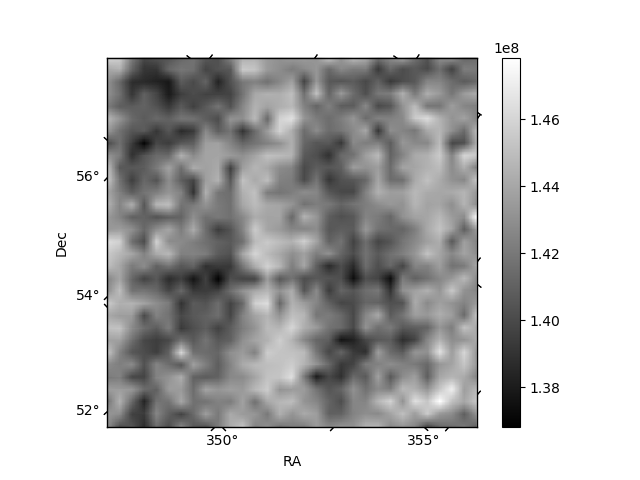
Histogram calculated using DETX and DETY for each event in the final _common_clean file
| Quadrant A | 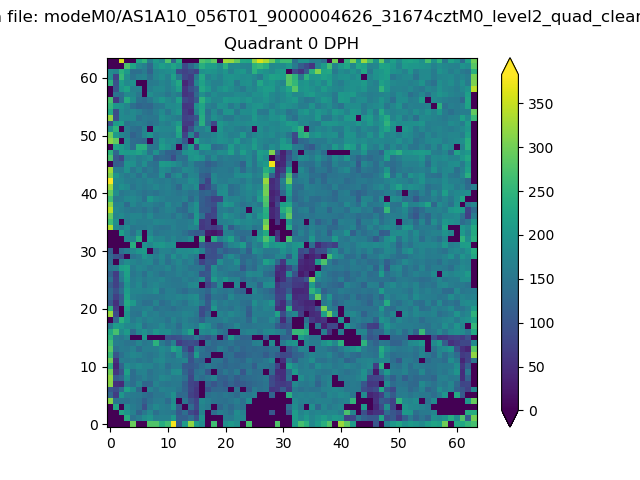 |
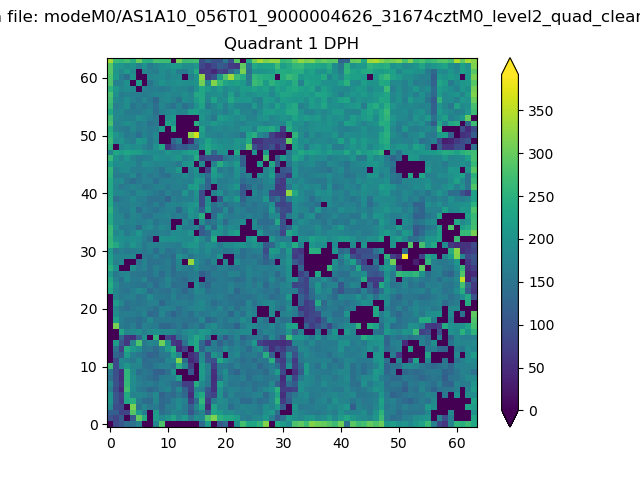 |
Quadrant B |
|---|---|---|---|
| Quadrant D | 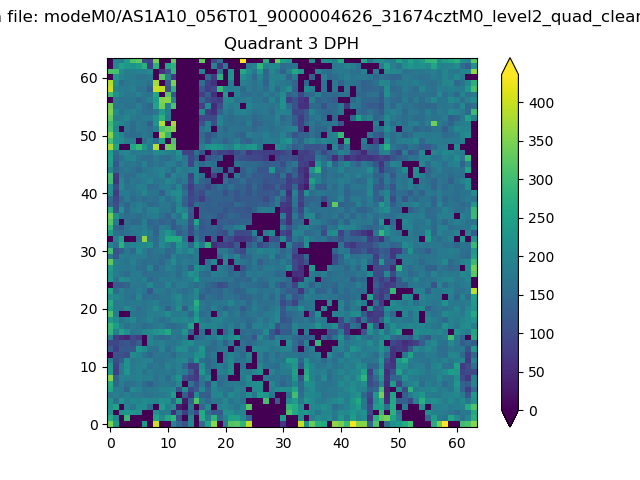 |
 |
Quadrant C |
| Plot type | Count rate plots | Images |
|---|---|---|
| Comparison with Poisson distribution Blue bars denote a histogram of data divided into 1 sec bins. Red curve is a Poisson curve with rate = median count rate of data. |
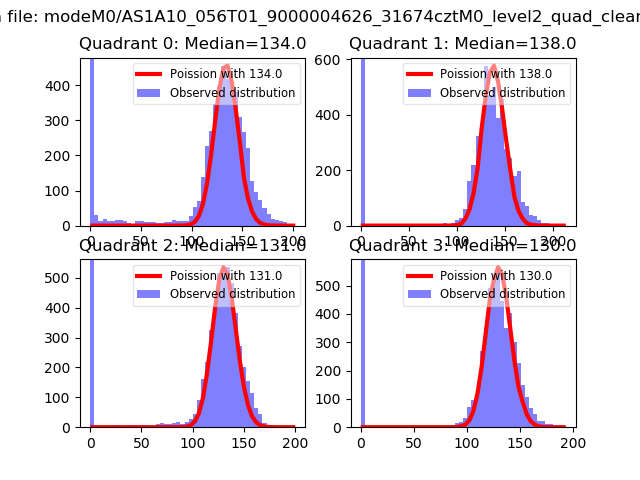 |
 |
| Quadrant-wise count rates Data is divided into 100 sec bins |
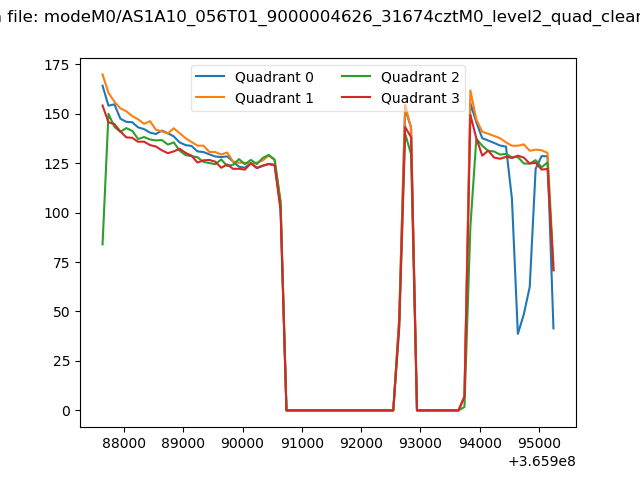 |
|
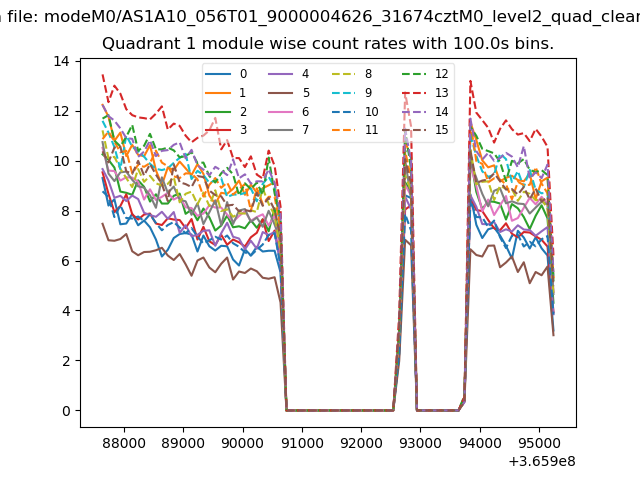
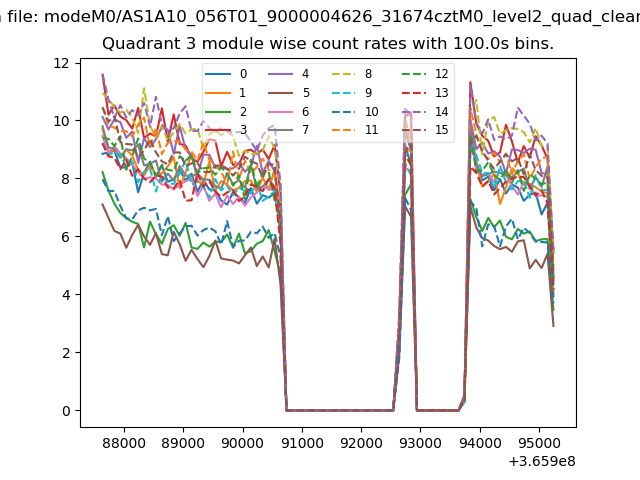
| Module-wise count rates for Quadrant A Data is divided into 100 sec bins |
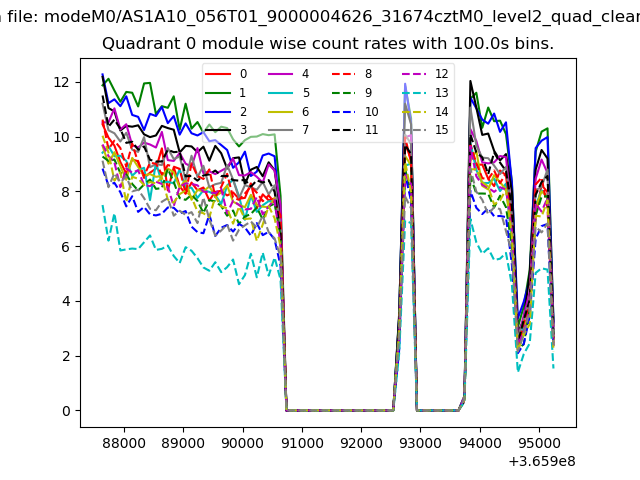 |
 |
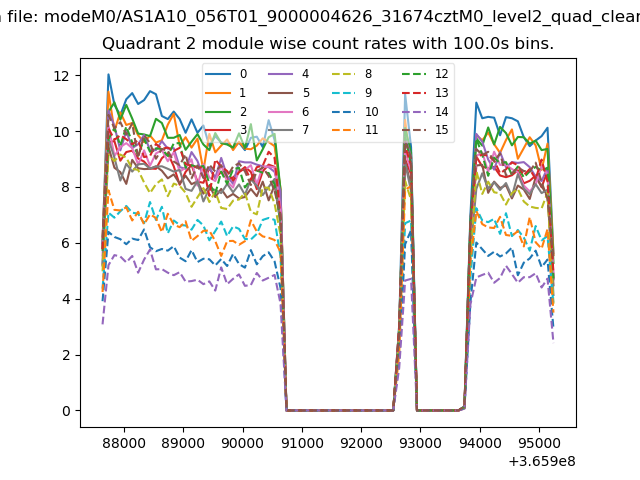
| Module-wise count rates for Quadrant B Data is divided into 100 sec bins |
 |
 |
| Module-wise count rates for Quadrant C Data is divided into 100 sec bins |
 |
 |
| Module-wise count rates for Quadrant D Data is divided into 100 sec bins |
 |
 |
| Parameter | Plot |
|---|---|
| CZT HV Monitor | 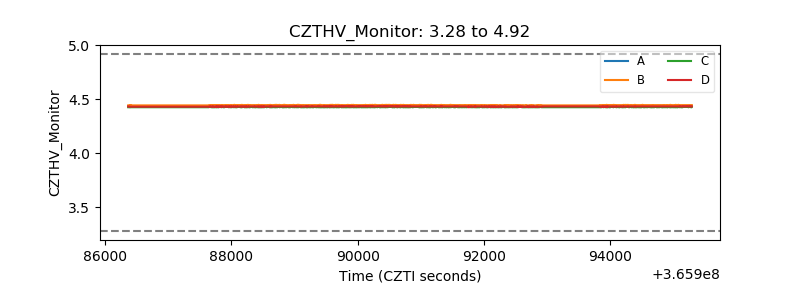 |
| D_VDD | 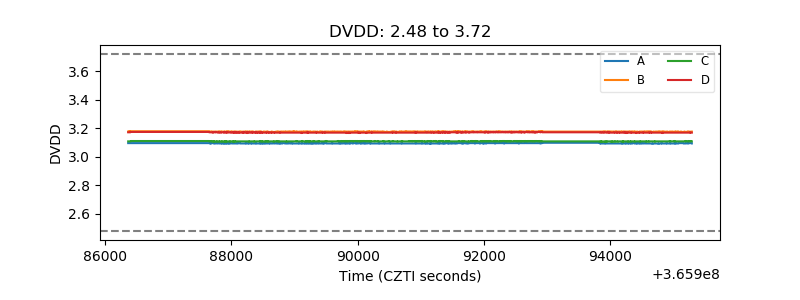 |
| Temperature 1 | 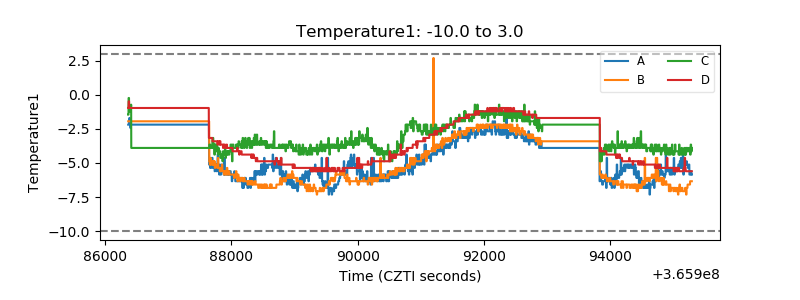 |
| Veto HV Monitor |  |
| Veto LLD | 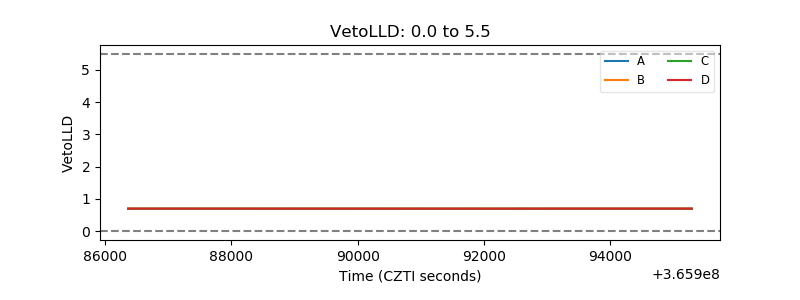 |
| Alpha Counter | 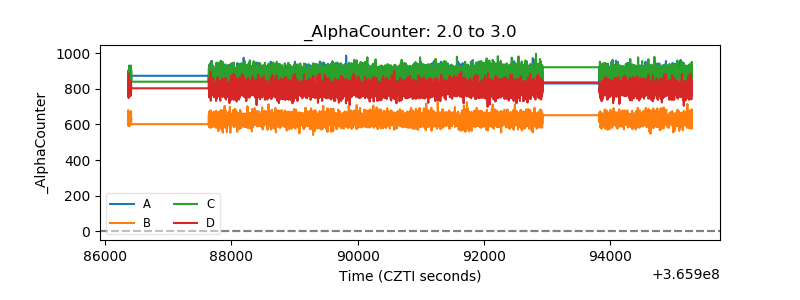 |
| _CPM_Rate |  |
| CZT Counter | 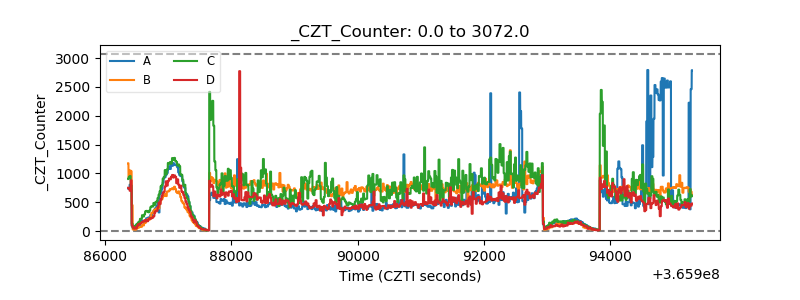 |
| +2.5 Volts monitor | 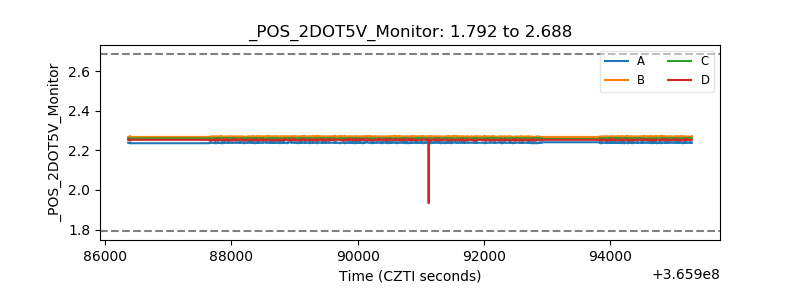 |
| +5 Volts monitor |  |
| _ROLL_ROT | 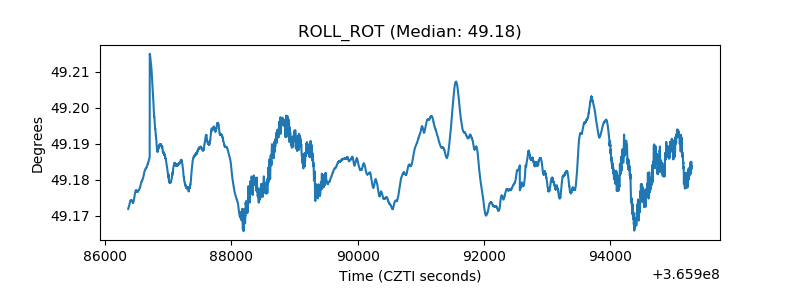 |
| _Roll_DEC | 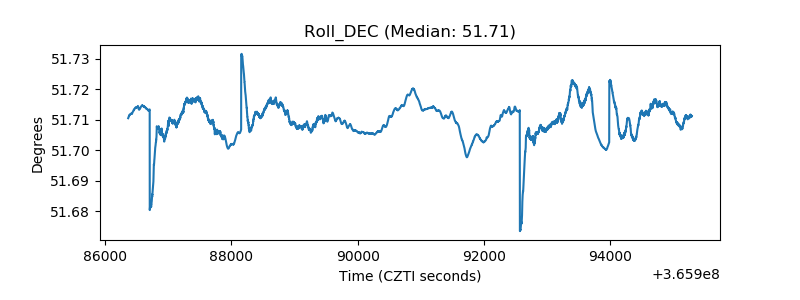 |
| _Roll_RA | 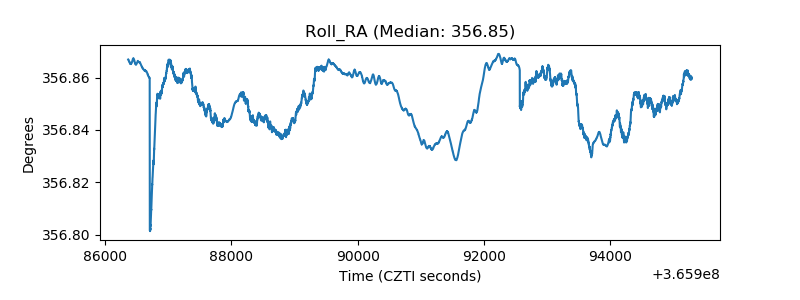 |
| Veto Counter | 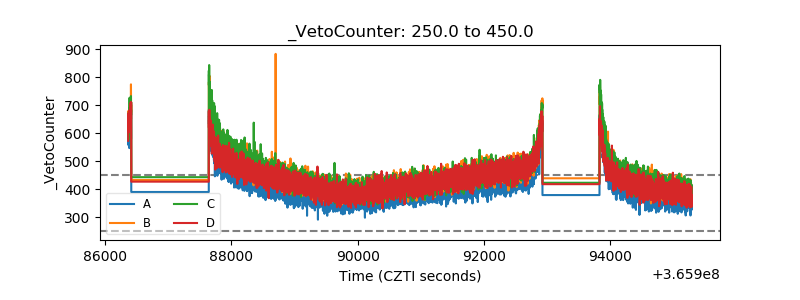 |