| Param | Original file | Final file |
|---|---|---|
| Filename | modeM0/AS1T04_026T01_9000004624cztM0_level2.fits | modeM0/AS1T04_026T01_9000004624cztM0_level2_quad_clean.evt |
| Size (bytes) | 283,167,360 | 270,028,800 |
| Size | 270.0 MB | 257.5 MB |
| Events in quadrant A | 1,325,172 | 926,583 |
| Events in quadrant B | 1,729,332 | 1,785,361 |
| Events in quadrant C | 1,785,104 | 1,735,011 |
| Events in quadrant D | 1,568,966 | 1,570,133 |
| Mode SS | |||
|---|---|---|---|
| Quadrant | BADHDUFLAG | Total packets | Discarded packets |
| A | 0 | 638 | 0 |
| B | 0 | 638 | 0 |
| C | 0 | 638 | 0 |
| D | 0 | 638 | 0 |
| Mode M0 | |||
|---|---|---|---|
| Quadrant | BADHDUFLAG | Total packets | Discarded packets |
| A | 0 | 149464 | 0 |
| B | 0 | 97395 | 0 |
| C | 0 | 67354 | 0 |
| D | 0 | 89587 | 0 |
| Mode M9 | |||
|---|---|---|---|
| Quadrant | BADHDUFLAG | Total packets | Discarded packets |
| A | 0 | 33 | 0 |
| B | 0 | 33 | 0 |
| C | 0 | 33 | 0 |
| D | 0 | 33 | 0 |
| Quadrant | Total seconds | Saturated seconds | Saturation percentage |
|---|---|---|---|
| A | 31427 | 14416 | 45.871384% |
| B | 31427 | 1066 | 3.391988% |
| C | 31427 | 950 | 3.022878% |
| D | 31427 | 746 | 2.373755% |
Noise dominated data is calculated using 1-second bins in cleaned event files. If a bin has >2000 counts, and if more than 50% of those come from <1% of pixels, then it is considered to be noise-dominated and hence unusable.
| Quadrant | # 1 sec bins | Bins with >0 counts | Bins with >2000 counts | High rate bins dominated by noise | Noise dominated (total time) | Noise dominated (detector-on time) | Marked lightcurve |
|---|---|---|---|---|---|---|---|
| A | 34752 | 31073 | 0 | 0 | 0.00% | 0.00% | 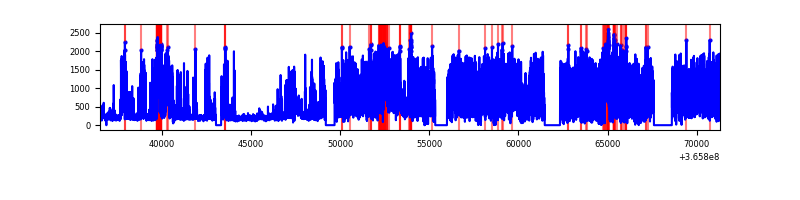 |
| B | 34752 | 31425 | 0 | 0 | 0.00% | 0.00% | 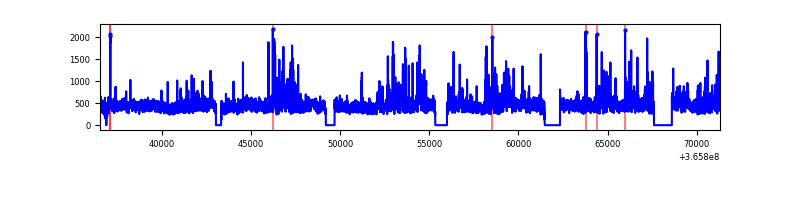 |
| C | 34752 | 31426 | 0 | 0 | 0.00% | 0.00% | 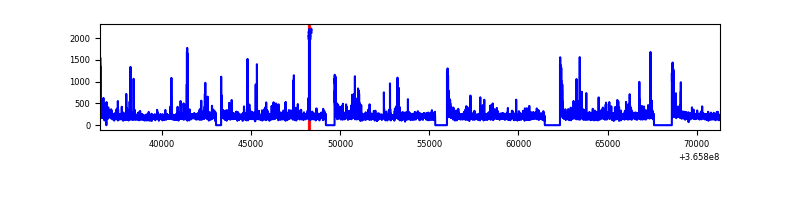 |
| D | 34752 | 31400 | 0 | 0 | 0.00% | 0.00% | 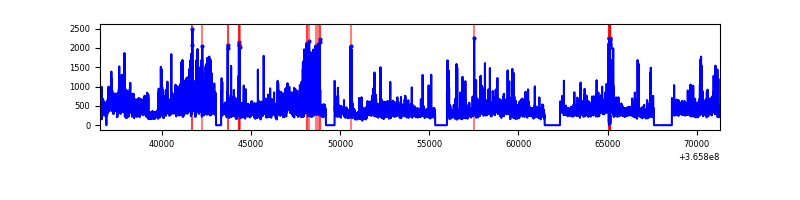 |
Top three noisy pixels from each quadrant. If the there are fewer than three noisy pixels in the level2.evt file, extra rows are filled as -1
| Pixel properties | Quadrant properties | ||||||
|---|---|---|---|---|---|---|---|
| Quadrant | DetID | PixID | Counts | Sigma | Mean | Median | Sigma |
| A | 0 | 29 | 1064 | 8.61 | 344 | 323 | 86.1 |
| A | 7 | 110 | 1043 | 8.36 | 344 | 323 | 86.1 |
| A | 9 | 19 | 1034 | 8.26 | 344 | 323 | 86.1 |
| B | 2 | 9 | 1428 | 10.65 | 456 | 433 | 93.4 |
| B | 5 | 232 | 1216 | 8.38 | 456 | 433 | 93.4 |
| B | 2 | 8 | 1190 | 8.1 | 456 | 433 | 93.4 |
| C | 12 | 241 | 1248 | 6.56 | 472 | 438 | 123.4 |
| C | 7 | 111 | 1225 | 6.38 | 472 | 438 | 123.4 |
| C | 9 | 209 | 1184 | 6.05 | 472 | 438 | 123.4 |
| D | 4 | 246 | 1210 | 6.74 | 447 | 405 | 119.5 |
| D | 3 | 159 | 1139 | 6.14 | 447 | 405 | 119.5 |
| D | 7 | 3 | 1109 | 5.89 | 447 | 405 | 119.5 |
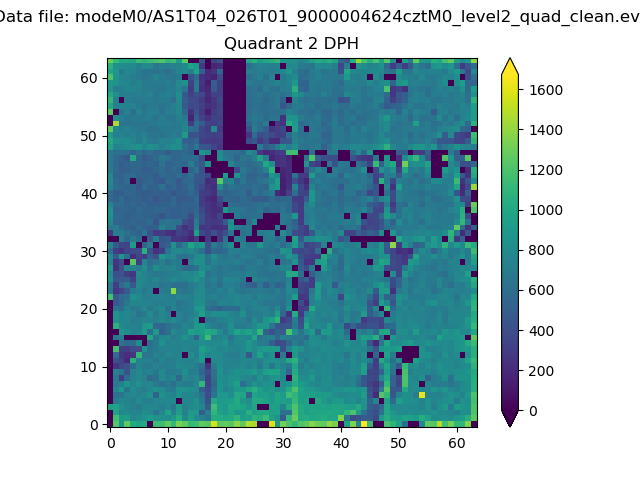
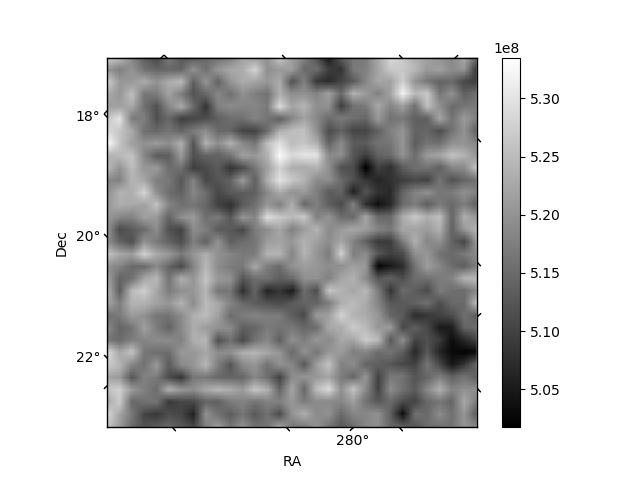
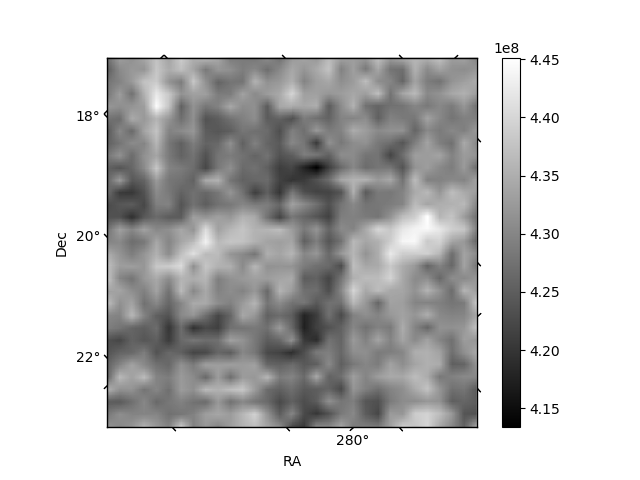
Histogram calculated using DETX and DETY for each event in the final _common_clean file
| Quadrant A | 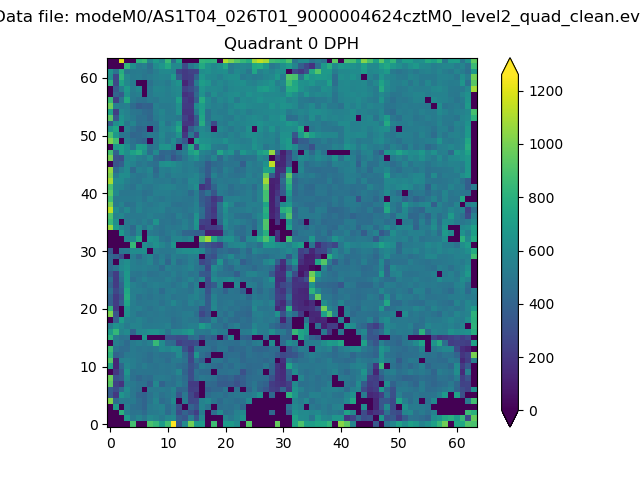 |
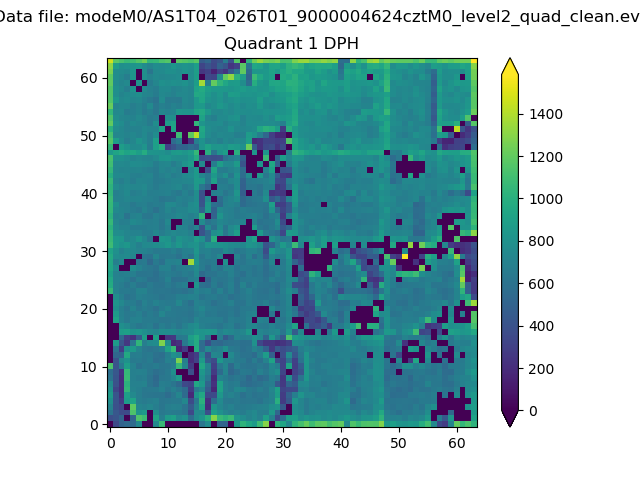 |
Quadrant B |
|---|---|---|---|
| Quadrant D | 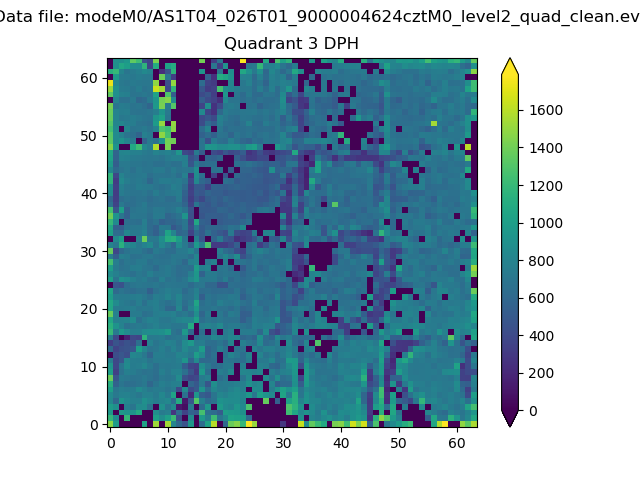 |
 |
Quadrant C |
| Plot type | Count rate plots | Images |
|---|---|---|
| Comparison with Poisson distribution Blue bars denote a histogram of data divided into 1 sec bins. Red curve is a Poisson curve with rate = median count rate of data. |
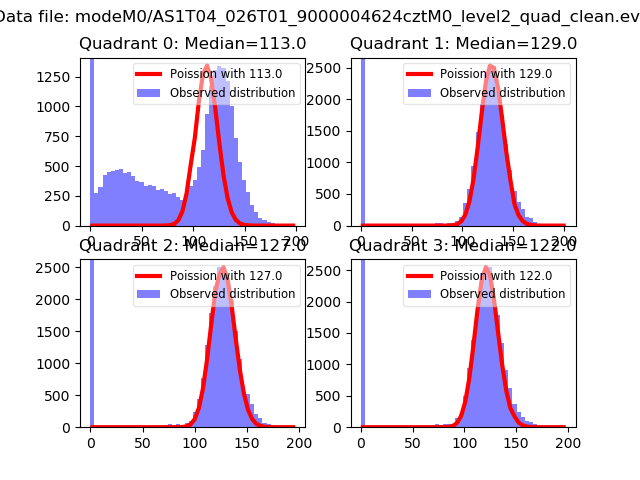 |
 |
| Quadrant-wise count rates Data is divided into 100 sec bins |
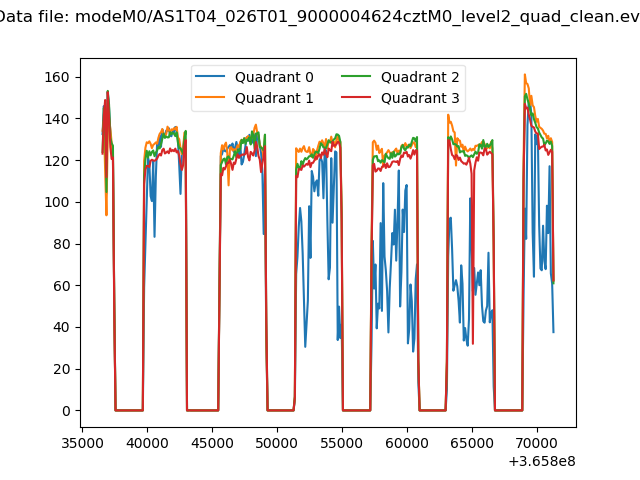 |
|
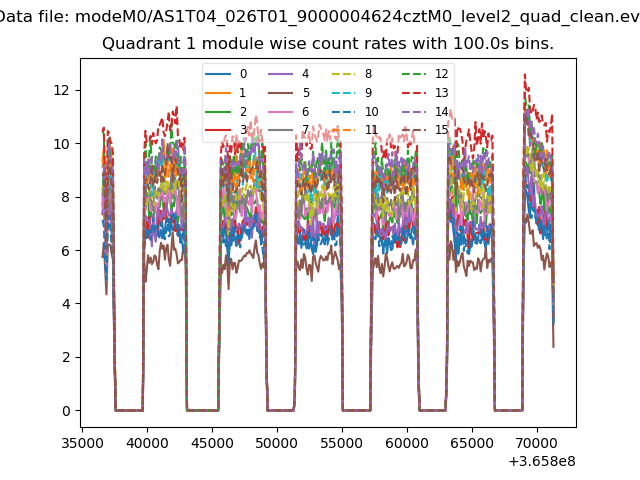
| Module-wise count rates for Quadrant A Data is divided into 100 sec bins |
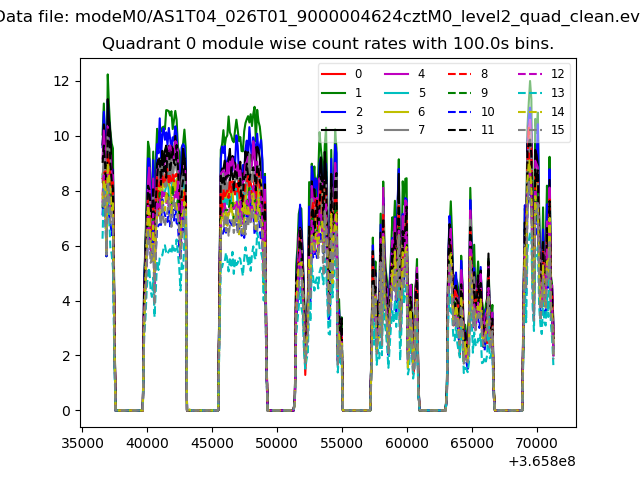 |
 |
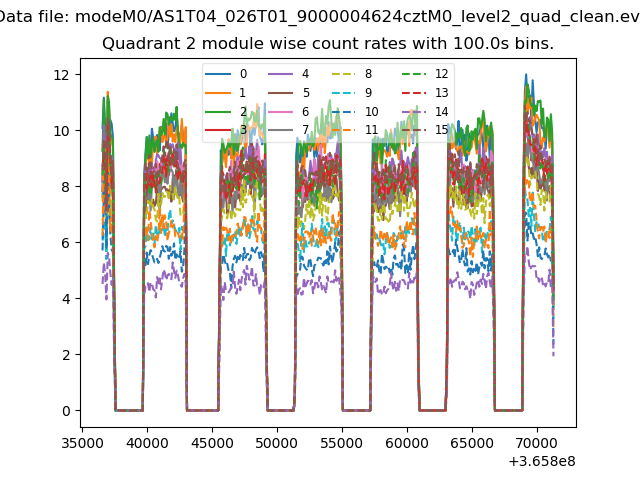
| Module-wise count rates for Quadrant B Data is divided into 100 sec bins |
 |
 |
| Module-wise count rates for Quadrant C Data is divided into 100 sec bins |
 |
 |
| Module-wise count rates for Quadrant D Data is divided into 100 sec bins |
 |
 |
| Parameter | Plot |
|---|---|
| CZT HV Monitor | 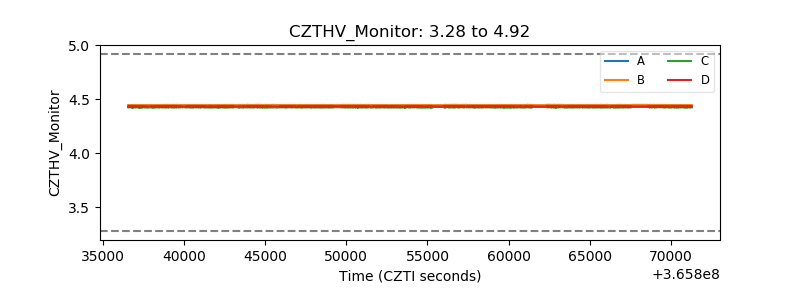 |
| D_VDD | 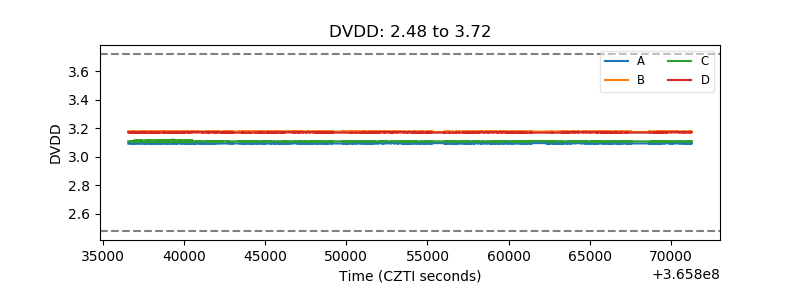 |
| Temperature 1 |  |
| Veto HV Monitor | 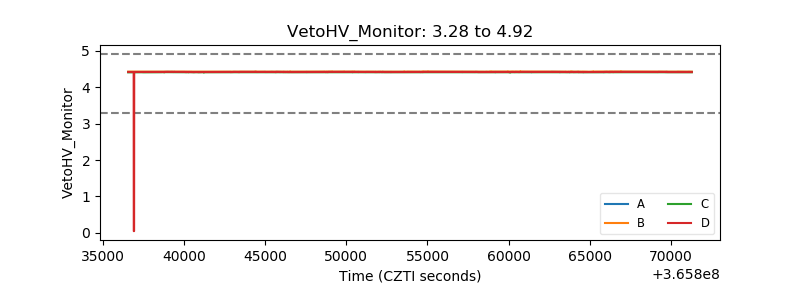 |
| Veto LLD | 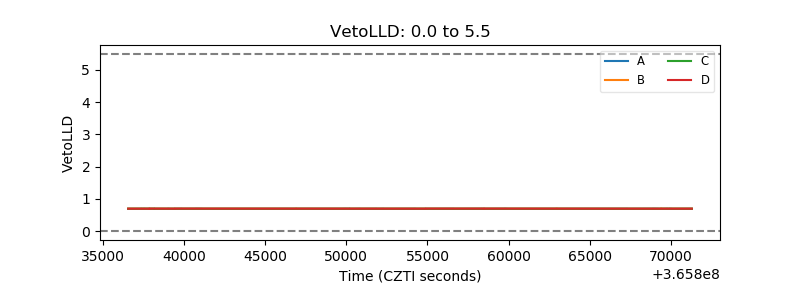 |
| Alpha Counter |  |
| _CPM_Rate | 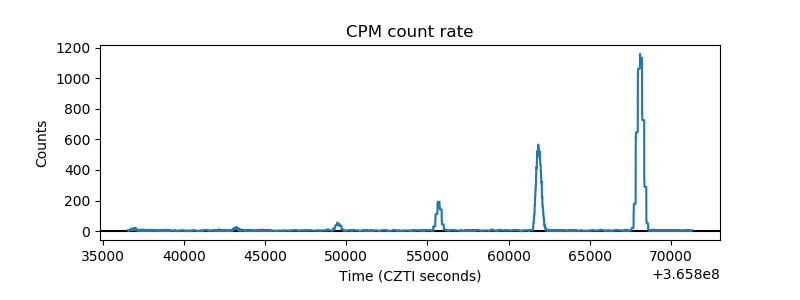 |
| CZT Counter | 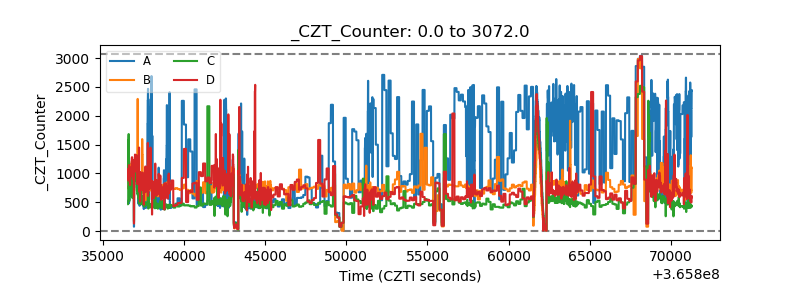 |
| +2.5 Volts monitor | 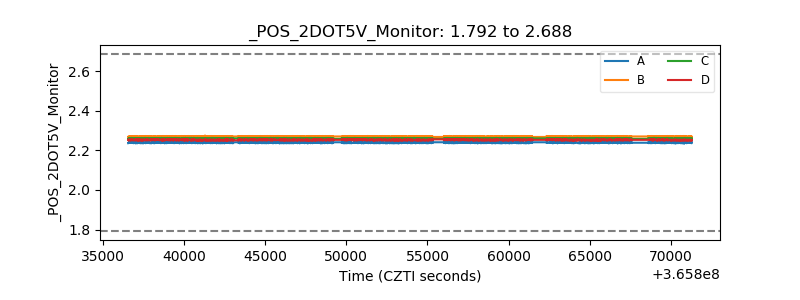 |
| +5 Volts monitor |  |
| _ROLL_ROT | 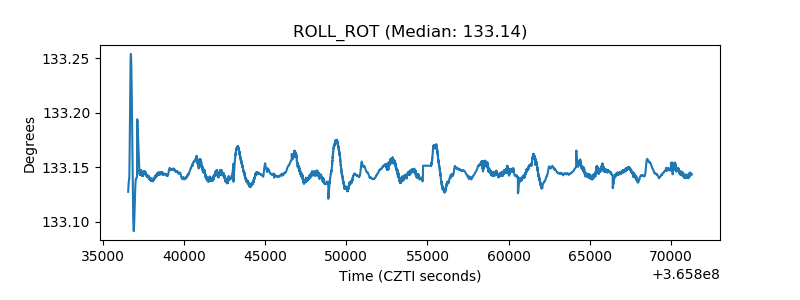 |
| _Roll_DEC | 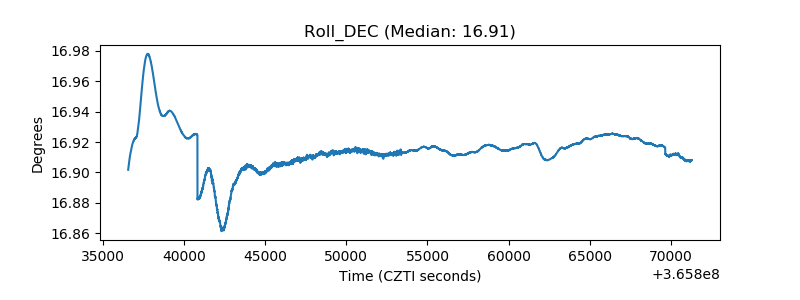 |
| _Roll_RA | 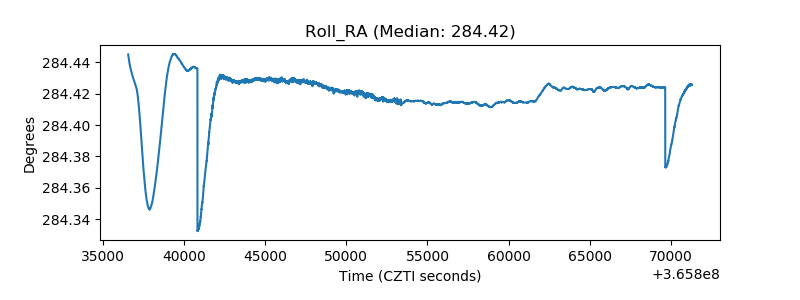 |
| Veto Counter |  |