| Param | Original file | Final file |
|---|---|---|
| Filename | modeM0/AS1T04_026T01_9000004624_31647cztM0_level2.evt | modeM0/AS1T04_026T01_9000004624_31647cztM0_level2_quad_clean.evt |
| Size (bytes) | 200,545,920 | 20,865,600 |
| Size | 191.3 MB | 19.9 MB |
| Events in quadrant A | 1,517,093 | 125,359 |
| Events in quadrant B | 1,590,347 | 119,499 |
| Events in quadrant C | 1,122,890 | 124,943 |
| Events in quadrant D | 1,712,836 | 123,485 |
| Mode SS | |||
|---|---|---|---|
| Quadrant | BADHDUFLAG | Total packets | Discarded packets |
| A | 0 | 38 | 0 |
| B | 0 | 38 | 0 |
| C | 0 | 38 | 0 |
| D | 0 | 38 | 0 |
| Mode M0 | |||
|---|---|---|---|
| Quadrant | BADHDUFLAG | Total packets | Discarded packets |
| A | 0 | 5778 | 1 |
| B | 0 | 6146 | 1 |
| C | 0 | 4582 | 1 |
| D | 0 | 6416 | 1 |
| Quadrant | Total seconds | Saturated seconds | Saturation percentage |
|---|---|---|---|
| A | 1883 | 388 | 20.605417% |
| B | 1883 | 373 | 19.808816% |
| C | 1882 | 275 | 14.612115% |
| D | 1882 | 217 | 11.530287% |
Noise dominated data is calculated using 1-second bins in cleaned event files. If a bin has >2000 counts, and if more than 50% of those come from <1% of pixels, then it is considered to be noise-dominated and hence unusable.
| Quadrant | # 1 sec bins | Bins with >0 counts | Bins with >2000 counts | High rate bins dominated by noise | Noise dominated (total time) | Noise dominated (detector-on time) | Marked lightcurve |
|---|---|---|---|---|---|---|---|
| A | 1903 | 1884 | 125 | 125 | 6.57% | 6.63% | 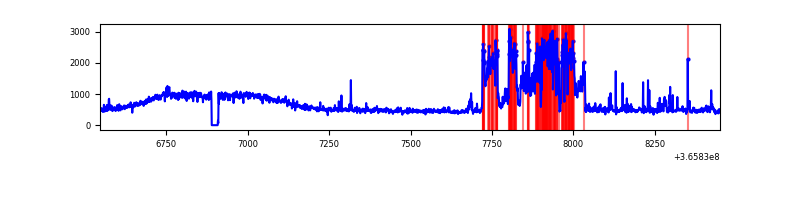 |
| B | 1903 | 1884 | 8 | 8 | 0.42% | 0.42% | 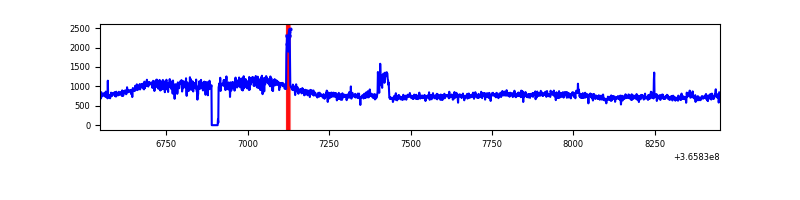 |
| C | 1902 | 1883 | 0 | 0 | 0.00% | 0.00% | 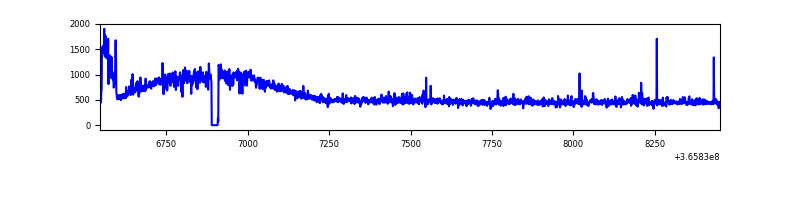 |
| D | 1902 | 1883 | 1 | 1 | 0.05% | 0.05% | 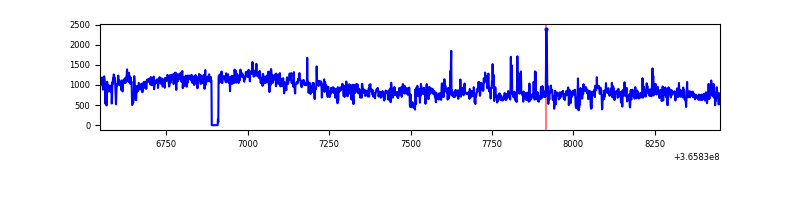 |
Top three noisy pixels from each quadrant. If the there are fewer than three noisy pixels in the level2.evt file, extra rows are filled as -1
| Pixel properties | Quadrant properties | ||||||
|---|---|---|---|---|---|---|---|
| Quadrant | DetID | PixID | Counts | Sigma | Mean | Median | Sigma |
| A | 0 | 13 | 486120 | 8414.83 | 266 | 259 | 57.7 |
| A | 13 | 254 | 3570 | 57.34 | 266 | 259 | 57.7 |
| A | 3 | 137 | 3178 | 50.56 | 266 | 259 | 57.7 |
| B | 6 | 159 | 514351 | 9104.45 | 260 | 252 | 56.5 |
| B | 10 | 245 | 22771 | 398.8 | 260 | 252 | 56.5 |
| B | 0 | 190 | 21513 | 376.52 | 260 | 252 | 56.5 |
| C | 0 | 10 | 55374 | 842.08 | 259 | 261 | 65.4 |
| C | 14 | 238 | 39533 | 600.04 | 259 | 261 | 65.4 |
| C | 2 | 114 | 4916 | 71.12 | 259 | 261 | 65.4 |
| D | 8 | 195 | 680313 | 10039.29 | 264 | 255 | 67.7 |
| D | 11 | 176 | 33479 | 490.47 | 264 | 255 | 67.7 |
| D | 2 | 234 | 8495 | 121.64 | 264 | 255 | 67.7 |
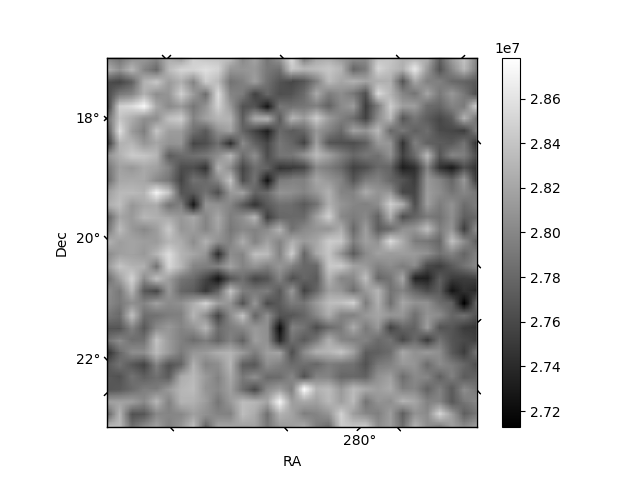
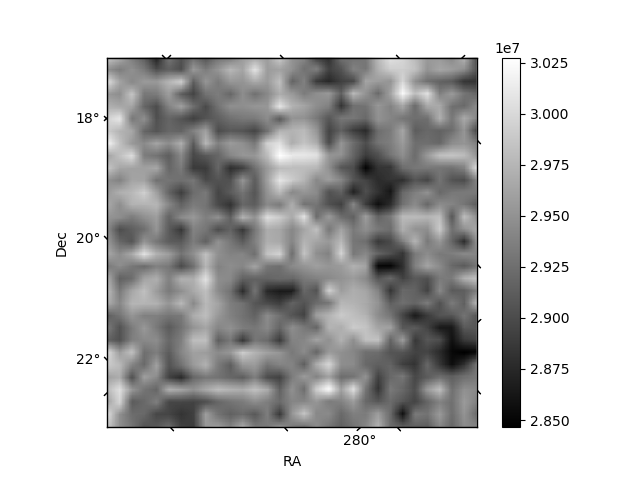
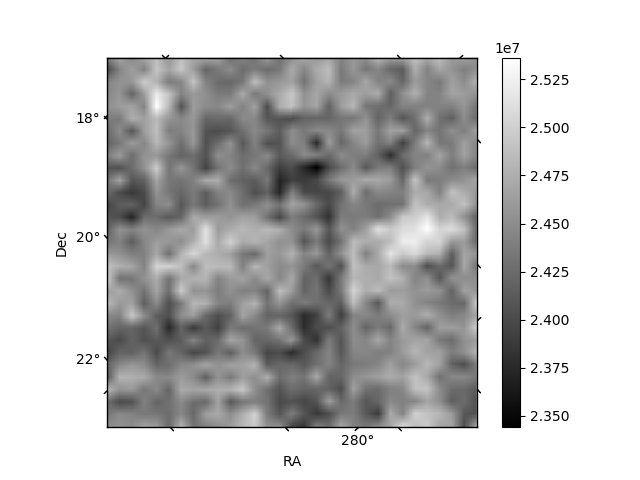
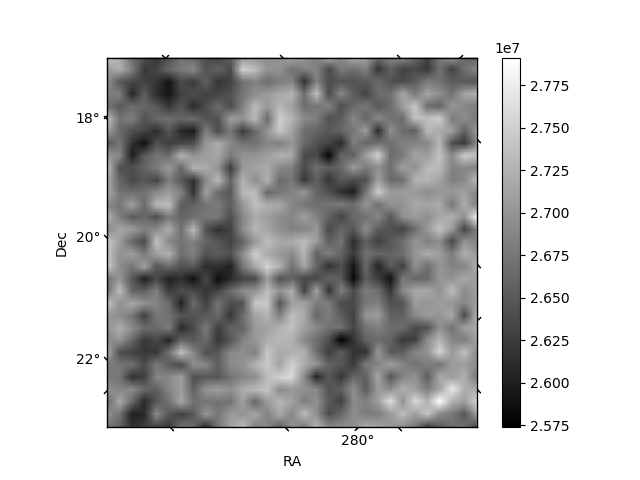
Histogram calculated using DETX and DETY for each event in the final _common_clean file
| Quadrant A | 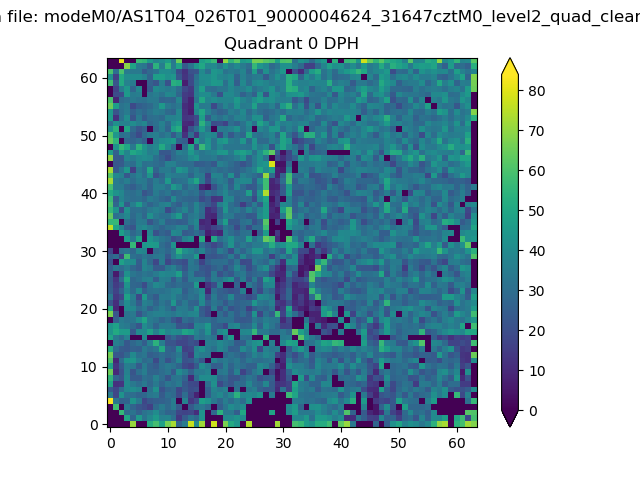 |
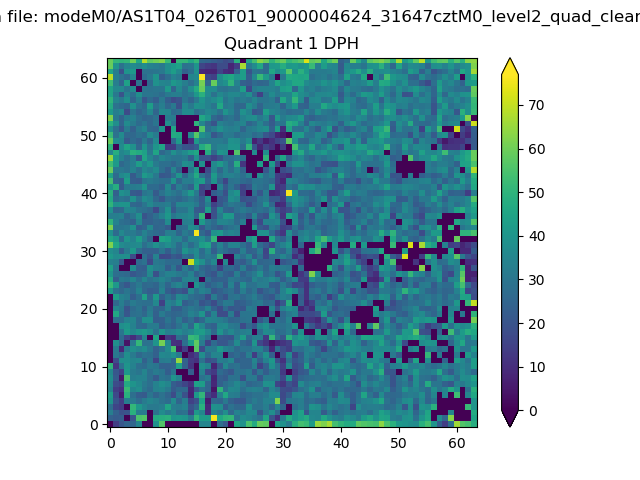 |
Quadrant B |
|---|---|---|---|
| Quadrant D |  |
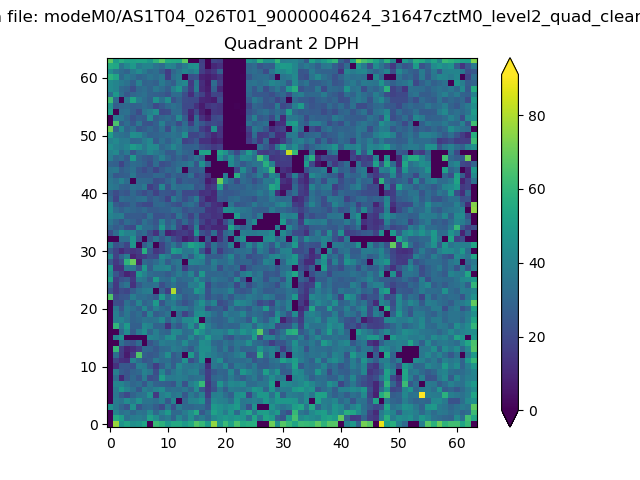 |
Quadrant C |
| Plot type | Count rate plots | Images |
|---|---|---|
| Comparison with Poisson distribution Blue bars denote a histogram of data divided into 1 sec bins. Red curve is a Poisson curve with rate = median count rate of data. |
 |
 |
| Quadrant-wise count rates Data is divided into 100 sec bins |
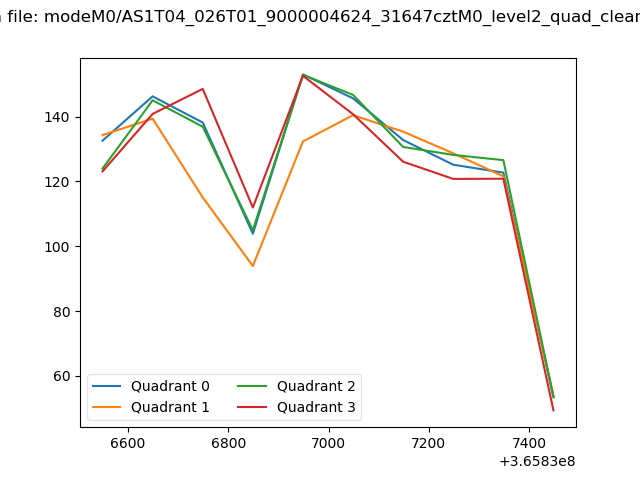 |
|
| Module-wise count rates for Quadrant A Data is divided into 100 sec bins |
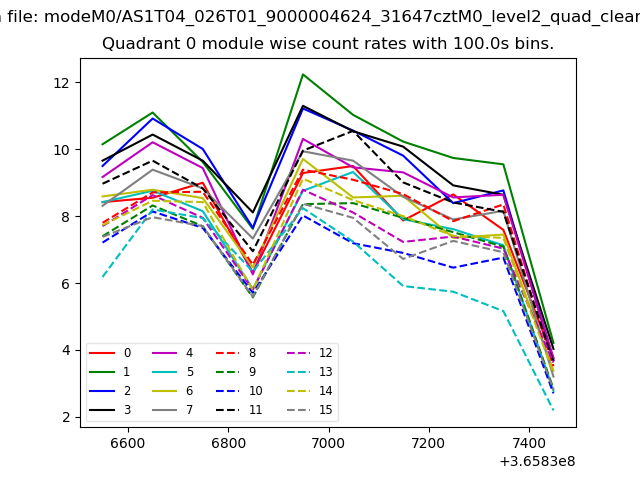 |
 |
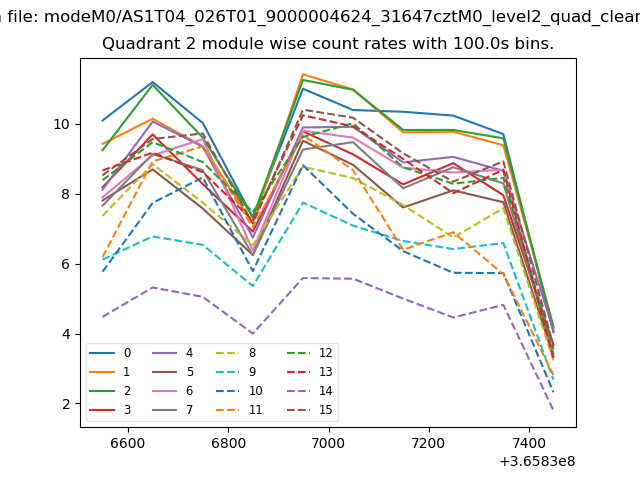
| Module-wise count rates for Quadrant B Data is divided into 100 sec bins |
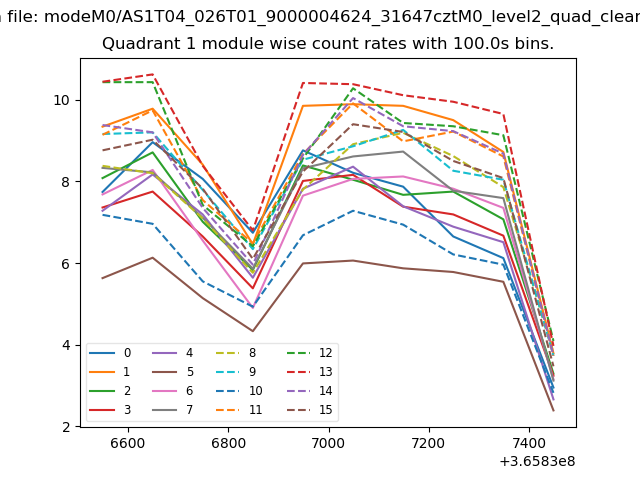 |
 |
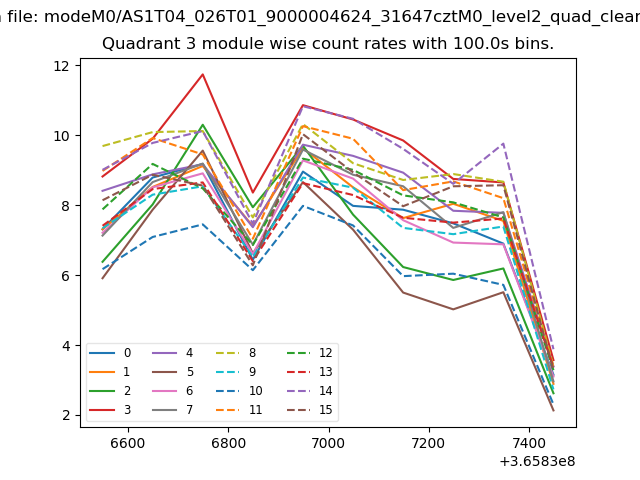
| Module-wise count rates for Quadrant C Data is divided into 100 sec bins |
 |
 |
| Module-wise count rates for Quadrant D Data is divided into 100 sec bins |
 |
 |
| Parameter | Plot |
|---|---|
| CZT HV Monitor | 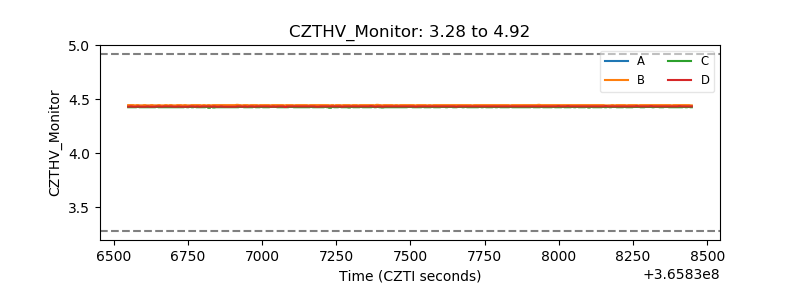 |
| D_VDD | 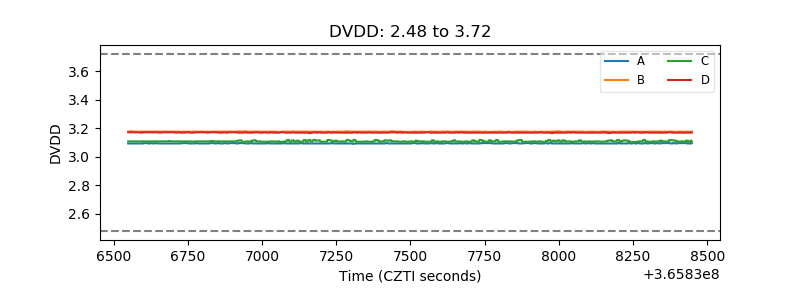 |
| Temperature 1 | 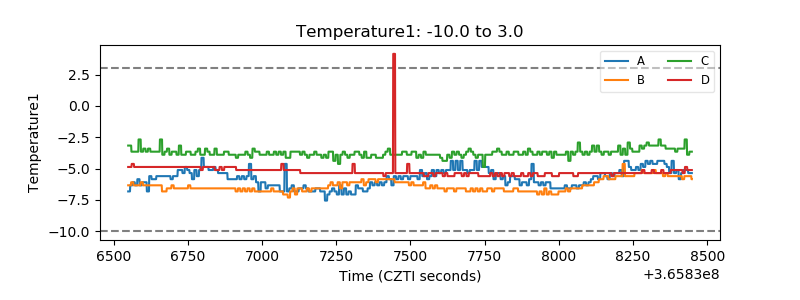 |
| Veto HV Monitor | 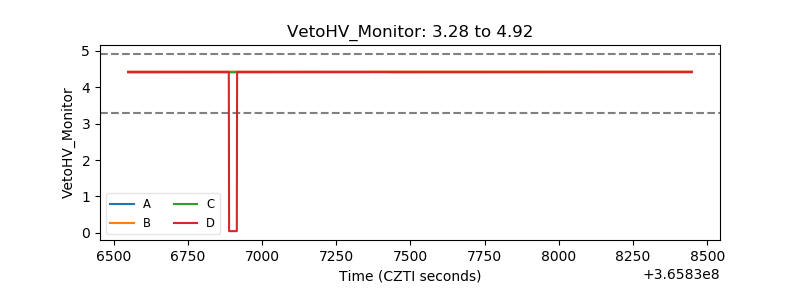 |
| Veto LLD | 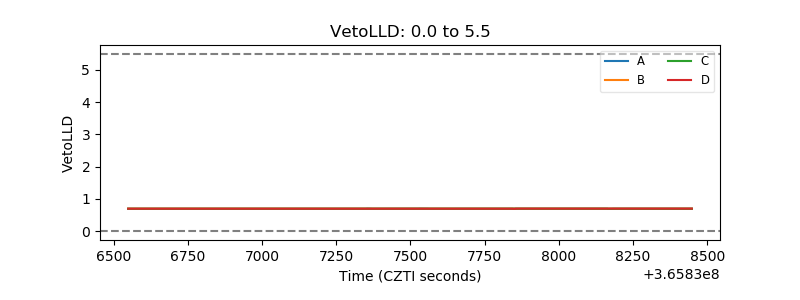 |
| Alpha Counter |  |
| _CPM_Rate | 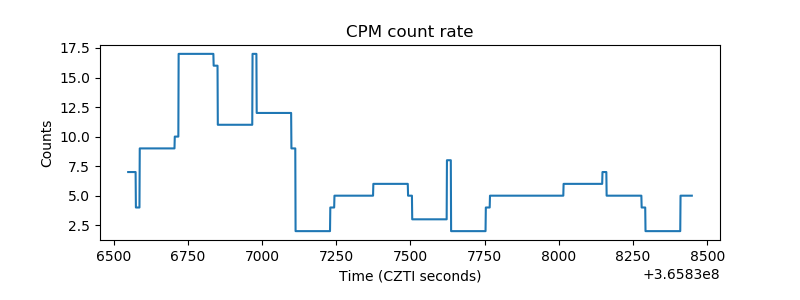 |
| CZT Counter | 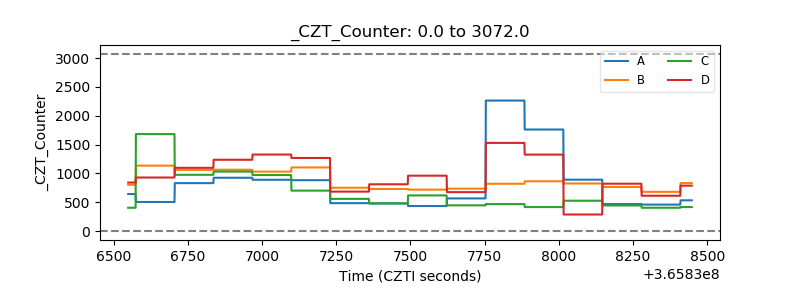 |
| +2.5 Volts monitor |  |
| +5 Volts monitor |  |
| _ROLL_ROT | 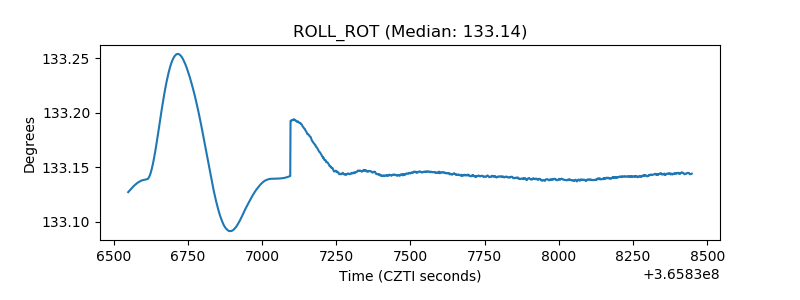 |
| _Roll_DEC | 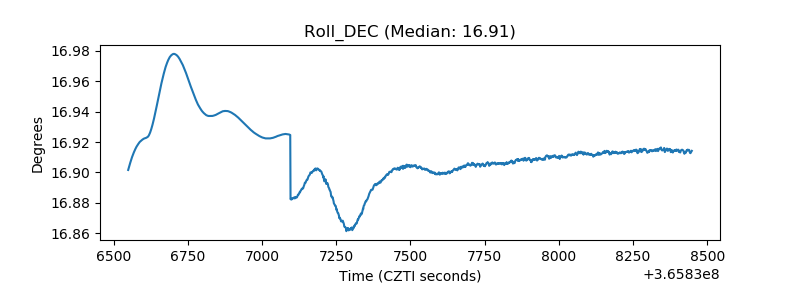 |
| _Roll_RA |  |
| Veto Counter | 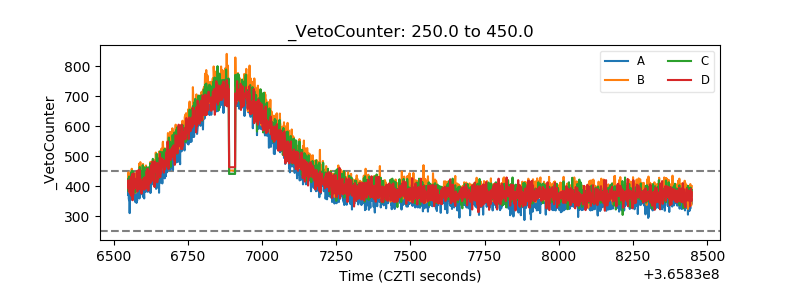 |