| Param | Original file | Final file |
|---|---|---|
| Filename | modeM0/AS1T04_026T01_9000004624_31651cztM0_level2.evt | modeM0/AS1T04_026T01_9000004624_31651cztM0_level2_quad_clean.evt |
| Size (bytes) | 2,159,046,720 | 229,919,040 |
| Size | 2.0 GB | 219.3 MB |
| Events in quadrant A | 26,128,896 | 1,133,743 |
| Events in quadrant B | 15,131,068 | 1,535,893 |
| Events in quadrant C | 9,792,167 | 1,512,624 |
| Events in quadrant D | 13,048,797 | 1,461,167 |
| Mode SS | |||
|---|---|---|---|
| Quadrant | BADHDUFLAG | Total packets | Discarded packets |
| A | 0 | 390 | 0 |
| B | 0 | 390 | 0 |
| C | 0 | 390 | 0 |
| D | 0 | 390 | 0 |
| Mode M0 | |||
|---|---|---|---|
| Quadrant | BADHDUFLAG | Total packets | Discarded packets |
| A | 0 | 90573 | 4 |
| B | 0 | 59456 | 4 |
| C | 0 | 40710 | 4 |
| D | 0 | 52492 | 4 |
| Mode M9 | |||
|---|---|---|---|
| Quadrant | BADHDUFLAG | Total packets | Discarded packets |
| A | 0 | 23 | 0 |
| B | 0 | 23 | 0 |
| C | 0 | 23 | 0 |
| D | 0 | 23 | 0 |
| Quadrant | Total seconds | Saturated seconds | Saturation percentage |
|---|---|---|---|
| A | 19124 | 8664 | 45.304330% |
| B | 19124 | 581 | 3.038067% |
| C | 19125 | 501 | 2.619608% |
| D | 19124 | 341 | 1.783100% |
Noise dominated data is calculated using 1-second bins in cleaned event files. If a bin has >2000 counts, and if more than 50% of those come from <1% of pixels, then it is considered to be noise-dominated and hence unusable.
| Quadrant | # 1 sec bins | Bins with >0 counts | Bins with >2000 counts | High rate bins dominated by noise | Noise dominated (total time) | Noise dominated (detector-on time) | Marked lightcurve |
|---|---|---|---|---|---|---|---|
| A | 21424 | 19128 | 5494 | 5494 | 25.64% | 28.72% | 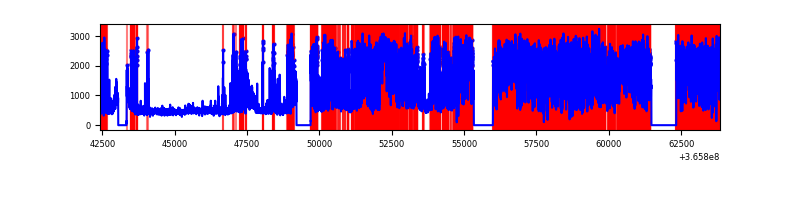 |
| B | 21424 | 19128 | 113 | 113 | 0.53% | 0.59% | 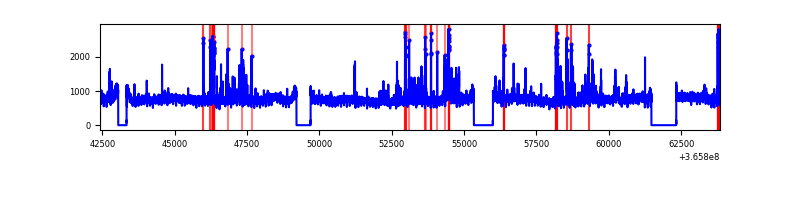 |
| C | 21425 | 19129 | 38 | 38 | 0.18% | 0.20% | 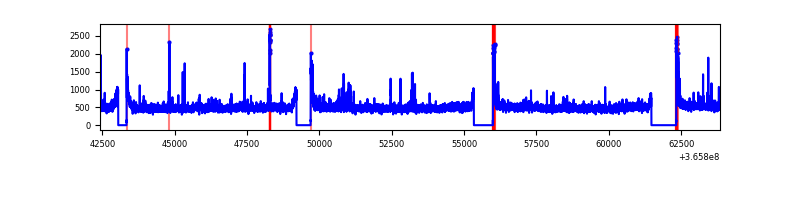 |
| D | 21424 | 19128 | 115 | 115 | 0.54% | 0.60% | 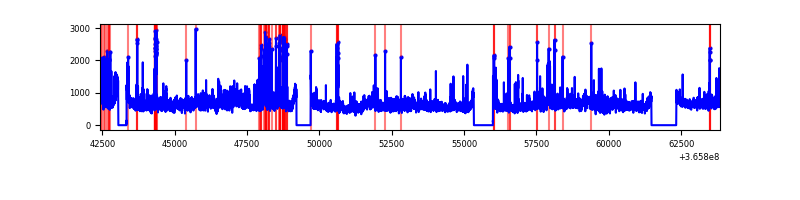 |
Top three noisy pixels from each quadrant. If the there are fewer than three noisy pixels in the level2.evt file, extra rows are filled as -1
| Pixel properties | Quadrant properties | ||||||
|---|---|---|---|---|---|---|---|
| Quadrant | DetID | PixID | Counts | Sigma | Mean | Median | Sigma |
| A | 0 | 13 | 19245332 | 54006.53 | 1777 | 1738 | 356.3 |
| A | 13 | 254 | 25085 | 65.52 | 1777 | 1738 | 356.3 |
| A | 12 | 96 | 19200 | 49.01 | 1777 | 1738 | 356.3 |
| B | 6 | 159 | 5011795 | 11199.15 | 2305 | 2243 | 447.3 |
| B | 10 | 245 | 912454 | 2034.83 | 2305 | 2243 | 447.3 |
| B | 0 | 190 | 122057 | 267.85 | 2305 | 2243 | 447.3 |
| C | 0 | 10 | 467594 | 876.52 | 2246 | 2265 | 530.9 |
| C | 14 | 238 | 365053 | 683.37 | 2246 | 2265 | 530.9 |
| C | 10 | 22 | 96456 | 177.42 | 2246 | 2265 | 530.9 |
| D | 8 | 195 | 3764712 | 6923.48 | 2264 | 2202 | 543.4 |
| D | 11 | 176 | 467723 | 856.62 | 2264 | 2202 | 543.4 |
| D | 2 | 250 | 213381 | 388.6 | 2264 | 2202 | 543.4 |
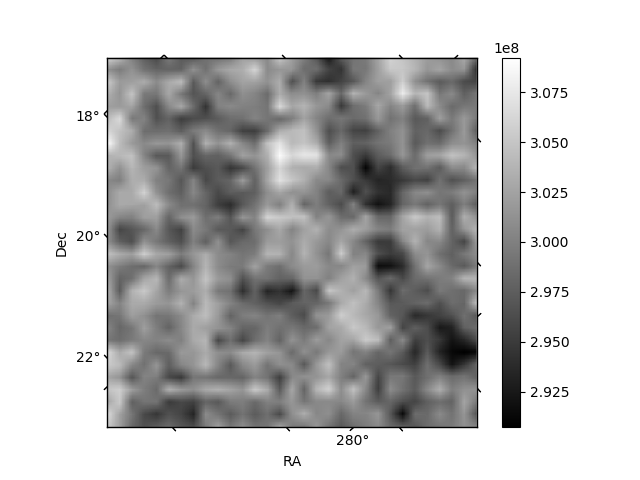
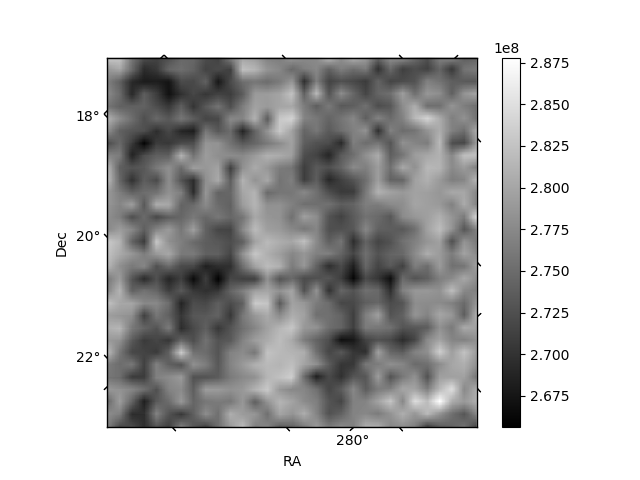
Histogram calculated using DETX and DETY for each event in the final _common_clean file
| Quadrant A | 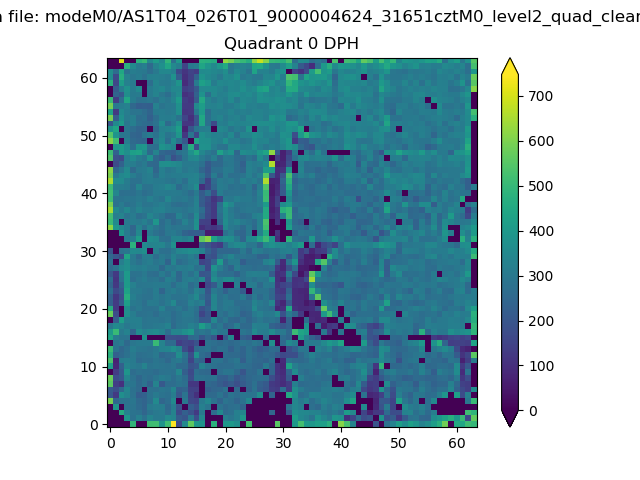 |
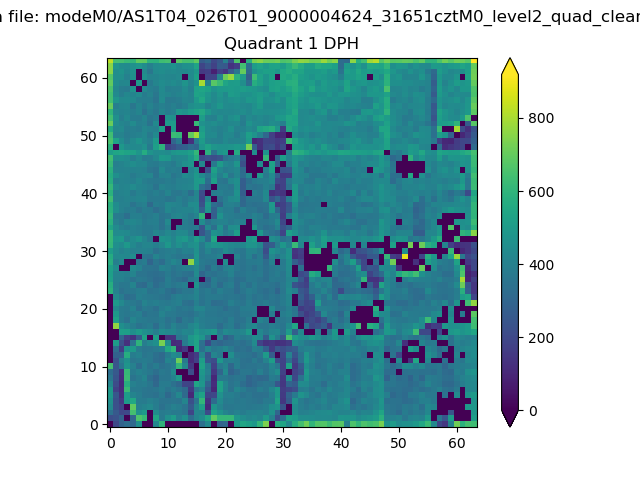 |
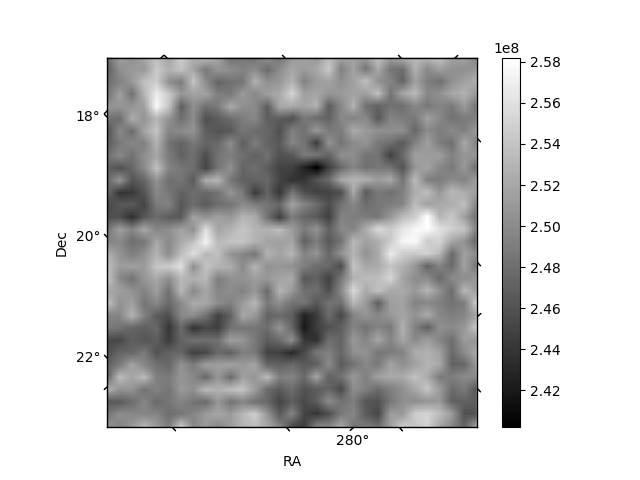
Quadrant B |
|---|---|---|---|
| Quadrant D | 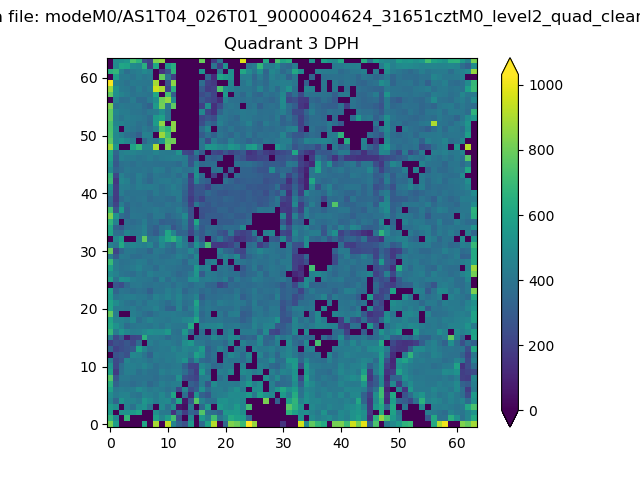 |
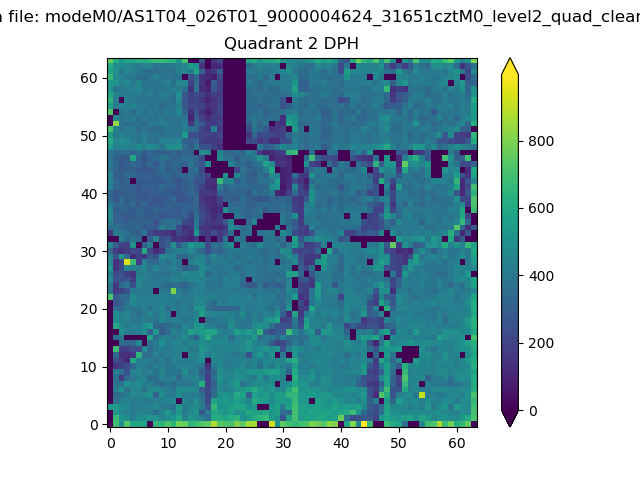 |
Quadrant C |
| Plot type | Count rate plots | Images |
|---|---|---|
| Comparison with Poisson distribution Blue bars denote a histogram of data divided into 1 sec bins. Red curve is a Poisson curve with rate = median count rate of data. |
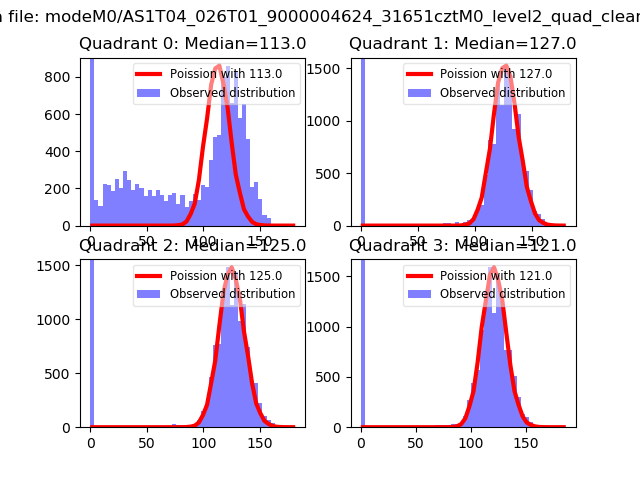 |
 |
| Quadrant-wise count rates Data is divided into 100 sec bins |
 |
|
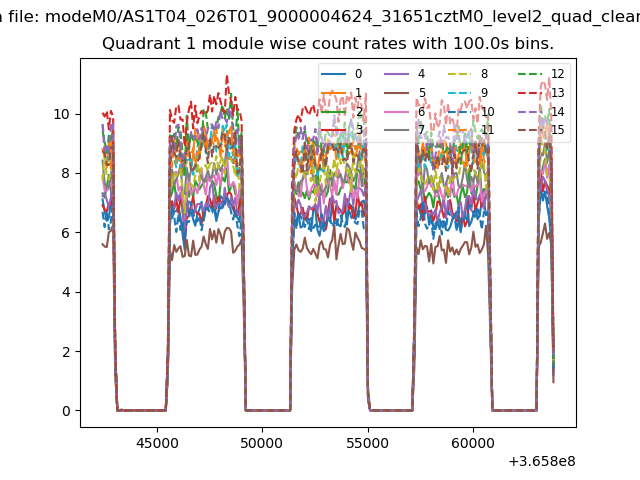
| Module-wise count rates for Quadrant A Data is divided into 100 sec bins |
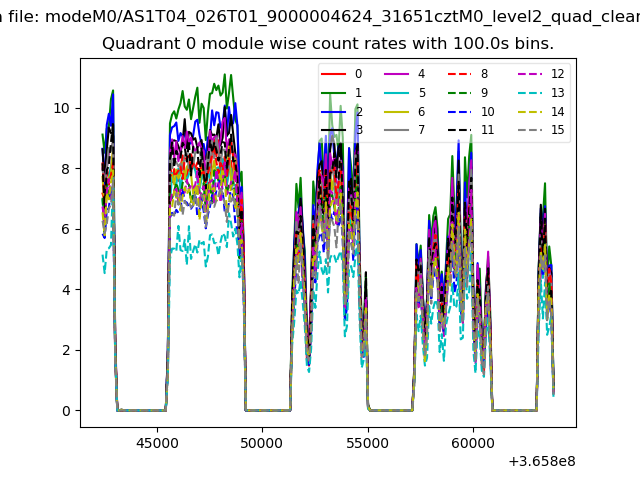 |
 |
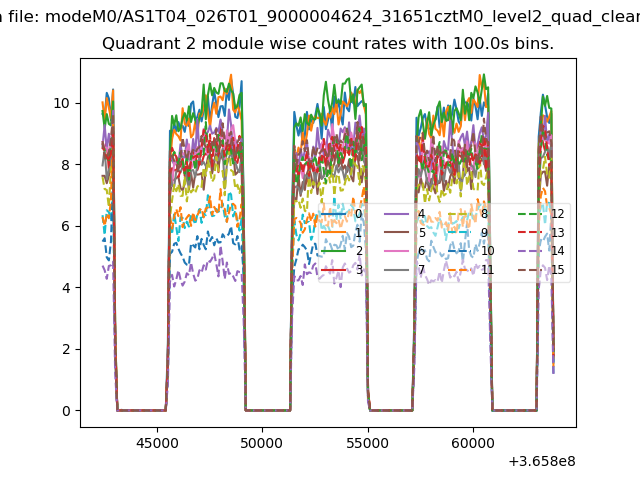
| Module-wise count rates for Quadrant B Data is divided into 100 sec bins |
 |
 |
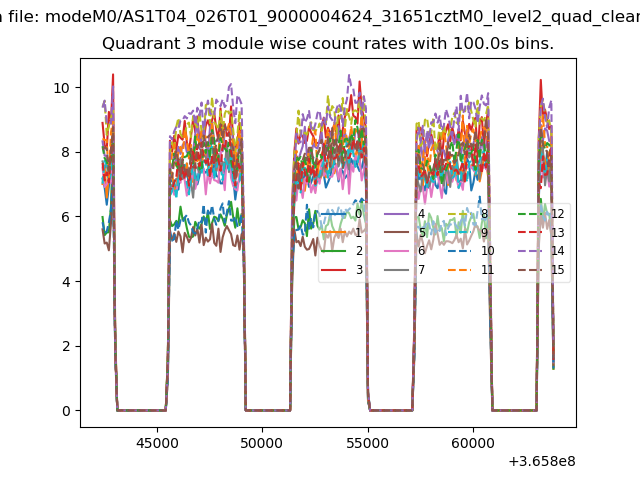
| Module-wise count rates for Quadrant C Data is divided into 100 sec bins |
 |
 |
| Module-wise count rates for Quadrant D Data is divided into 100 sec bins |
 |
 |
| Parameter | Plot |
|---|---|
| CZT HV Monitor | 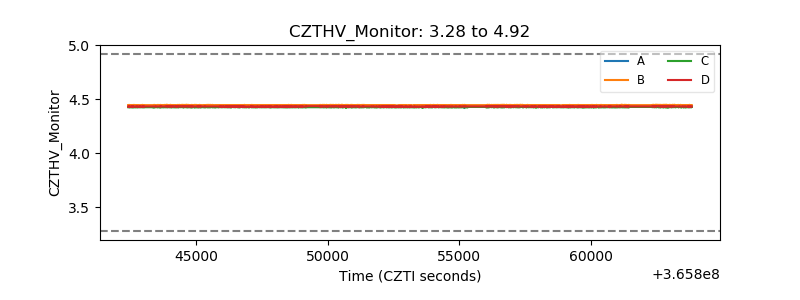 |
| D_VDD |  |
| Temperature 1 | 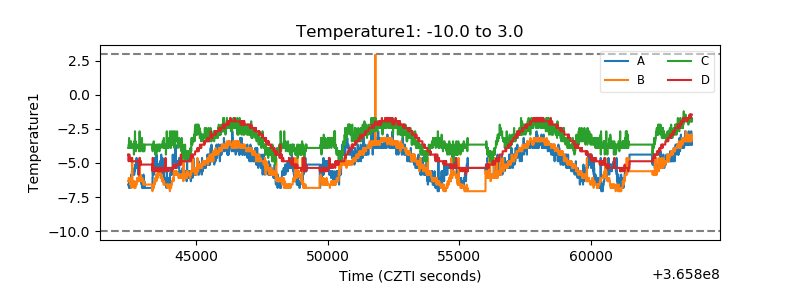 |
| Veto HV Monitor | 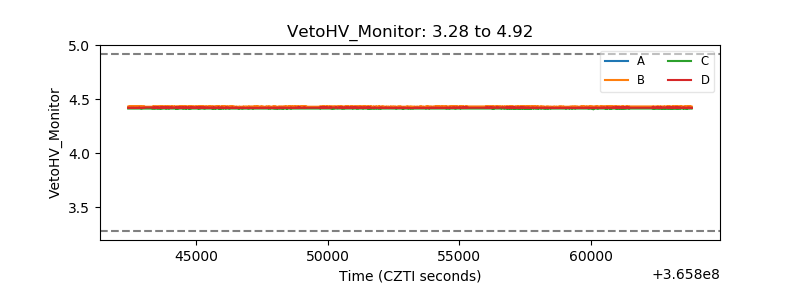 |
| Veto LLD | 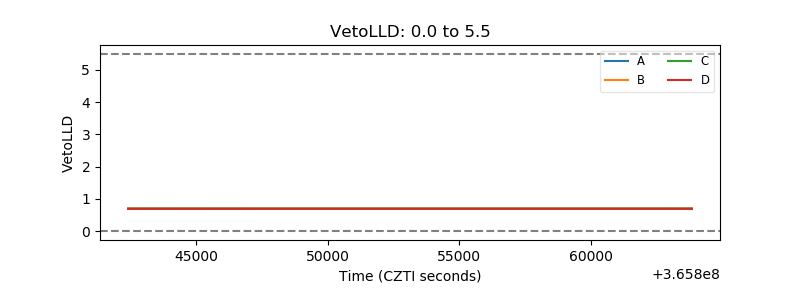 |
| Alpha Counter | 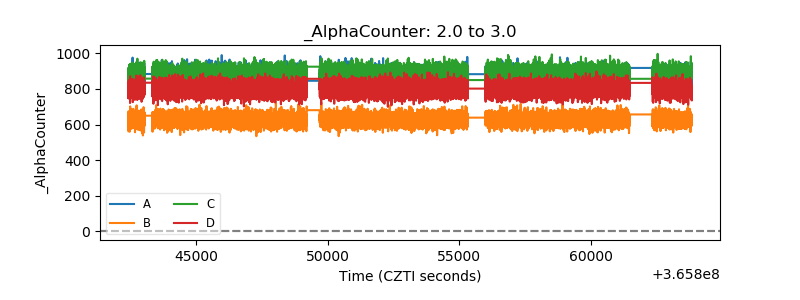 |
| _CPM_Rate | 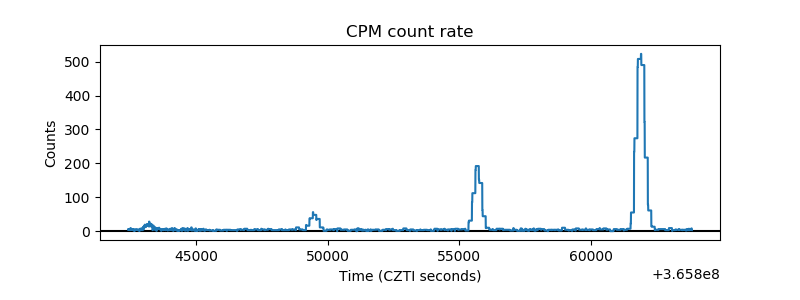 |
| CZT Counter | 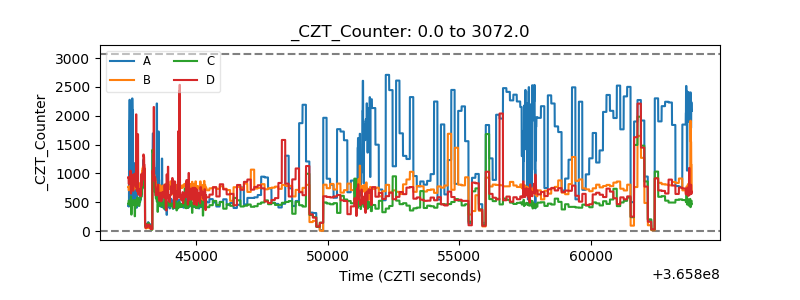 |
| +2.5 Volts monitor |  |
| +5 Volts monitor | 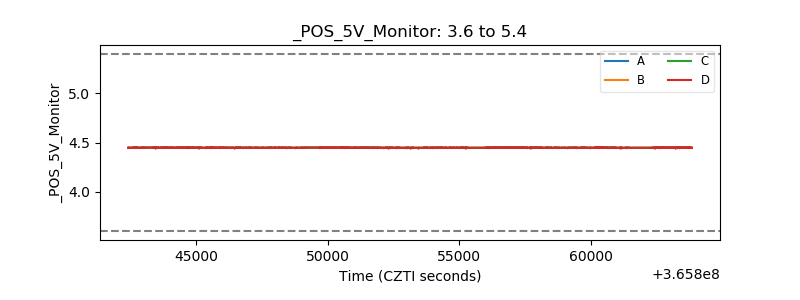 |
| _ROLL_ROT | 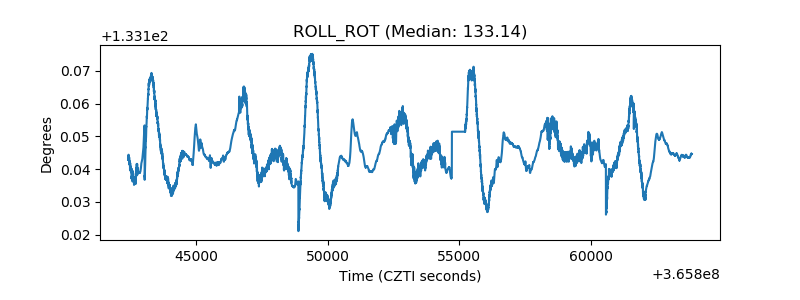 |
| _Roll_DEC | 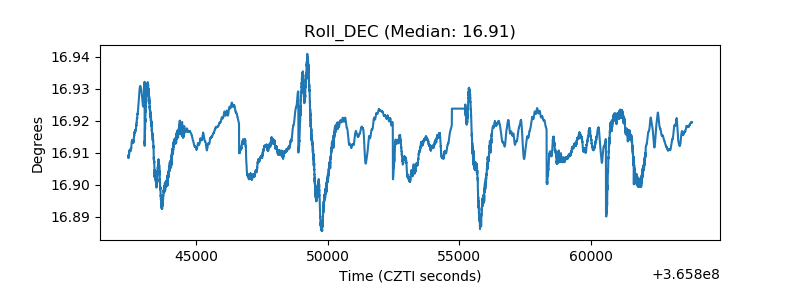 |
| _Roll_RA | 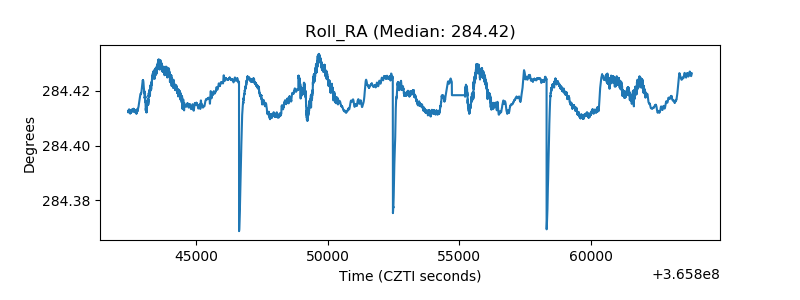 |
| Veto Counter | 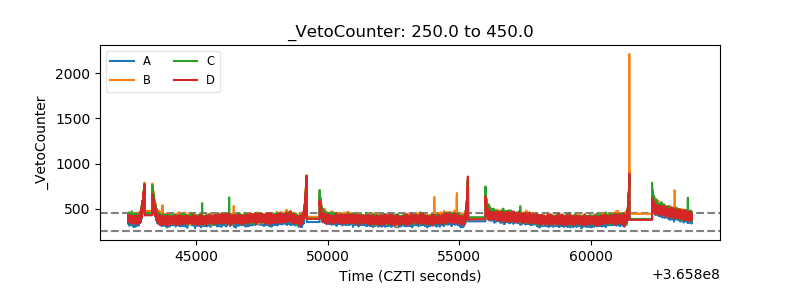 |