| Param | Original file | Final file |
|---|---|---|
| Filename | modeM0/AS1T04_026T01_9000004624_31652cztM0_level2.evt | modeM0/AS1T04_026T01_9000004624_31652cztM0_level2_quad_clean.evt |
| Size (bytes) | 884,689,920 | 84,968,640 |
| Size | 843.7 MB | 81.0 MB |
| Events in quadrant A | 12,623,647 | 322,389 |
| Events in quadrant B | 5,314,706 | 614,077 |
| Events in quadrant C | 3,648,490 | 599,740 |
| Events in quadrant D | 4,755,481 | 570,189 |
| Mode SS | |||
|---|---|---|---|
| Quadrant | BADHDUFLAG | Total packets | Discarded packets |
| A | 0 | 136 | 0 |
| B | 0 | 136 | 0 |
| C | 0 | 136 | 0 |
| D | 0 | 136 | 0 |
| Mode M0 | |||
|---|---|---|---|
| Quadrant | BADHDUFLAG | Total packets | Discarded packets |
| A | 0 | 42098 | 2 |
| B | 0 | 20672 | 2 |
| C | 0 | 14927 | 2 |
| D | 0 | 19066 | 2 |
| Mode M9 | |||
|---|---|---|---|
| Quadrant | BADHDUFLAG | Total packets | Discarded packets |
| A | 0 | 11 | 0 |
| B | 0 | 12 | 0 |
| C | 0 | 12 | 0 |
| D | 0 | 12 | 0 |
| Quadrant | Total seconds | Saturated seconds | Saturation percentage |
|---|---|---|---|
| A | 6666 | 5252 | 78.787879% |
| B | 6666 | 147 | 2.205221% |
| C | 6666 | 229 | 3.435344% |
| D | 6666 | 152 | 2.280228% |
Noise dominated data is calculated using 1-second bins in cleaned event files. If a bin has >2000 counts, and if more than 50% of those come from <1% of pixels, then it is considered to be noise-dominated and hence unusable.
| Quadrant | # 1 sec bins | Bins with >0 counts | Bins with >2000 counts | High rate bins dominated by noise | Noise dominated (total time) | Noise dominated (detector-on time) | Marked lightcurve |
|---|---|---|---|---|---|---|---|
| A | 7671 | 6667 | 3477 | 3477 | 45.33% | 52.15% | 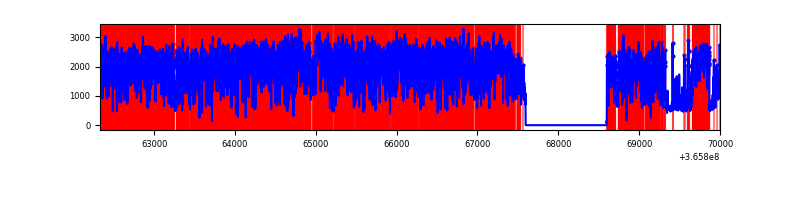 |
| B | 7671 | 6667 | 30 | 30 | 0.39% | 0.45% | 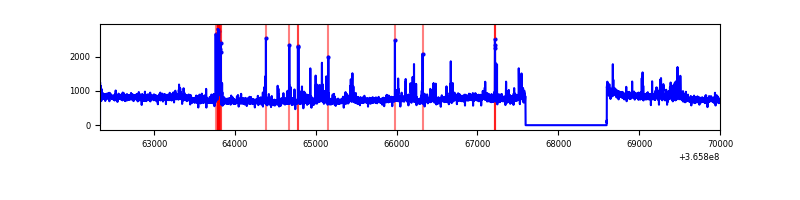 |
| C | 7671 | 6667 | 45 | 45 | 0.59% | 0.67% | 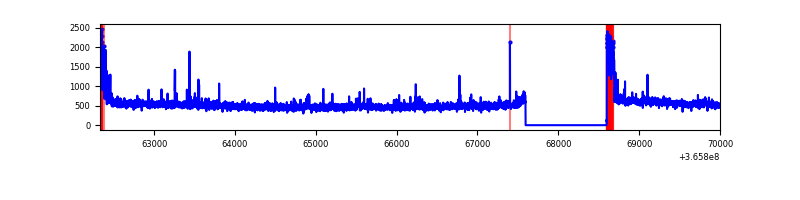 |
| D | 7671 | 6667 | 103 | 103 | 1.34% | 1.54% | 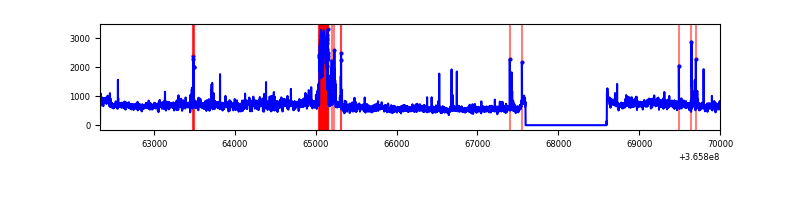 |
Top three noisy pixels from each quadrant. If the there are fewer than three noisy pixels in the level2.evt file, extra rows are filled as -1
| Pixel properties | Quadrant properties | ||||||
|---|---|---|---|---|---|---|---|
| Quadrant | DetID | PixID | Counts | Sigma | Mean | Median | Sigma |
| A | 0 | 13 | 10793903 | 115058.92 | 466 | 458 | 93.8 |
| A | 12 | 96 | 15498 | 160.33 | 466 | 458 | 93.8 |
| A | 15 | 174 | 11350 | 116.11 | 466 | 458 | 93.8 |
| B | 6 | 159 | 1733055 | 10815.6 | 831 | 809 | 160.2 |
| B | 10 | 245 | 203227 | 1263.83 | 831 | 809 | 160.2 |
| B | 0 | 190 | 99924 | 618.84 | 831 | 809 | 160.2 |
| C | 0 | 10 | 317660 | 1642.88 | 807 | 815 | 192.9 |
| C | 14 | 238 | 130055 | 670.13 | 807 | 815 | 192.9 |
| C | 4 | 175 | 23150 | 115.81 | 807 | 815 | 192.9 |
| D | 8 | 195 | 1295927 | 6676.7 | 814 | 794 | 194.0 |
| D | 12 | 2 | 298082 | 1532.59 | 814 | 794 | 194.0 |
| D | 2 | 250 | 48292 | 244.86 | 814 | 794 | 194.0 |
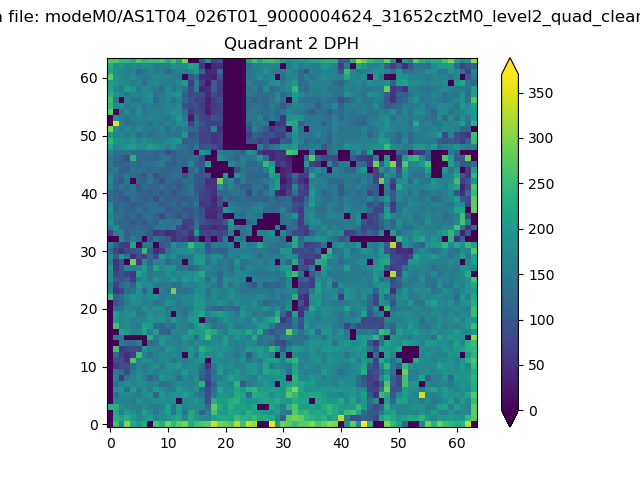
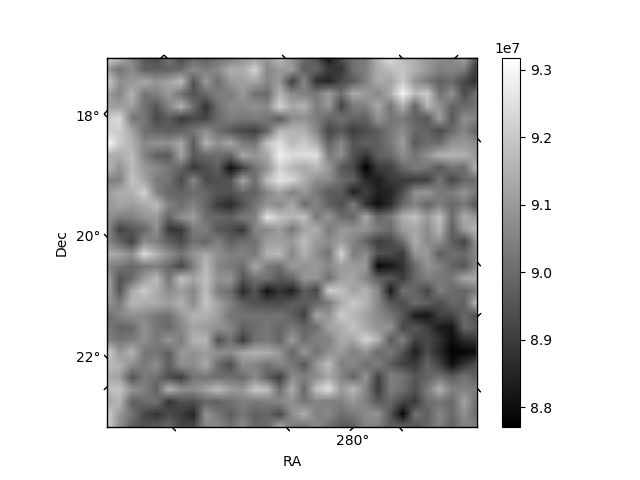
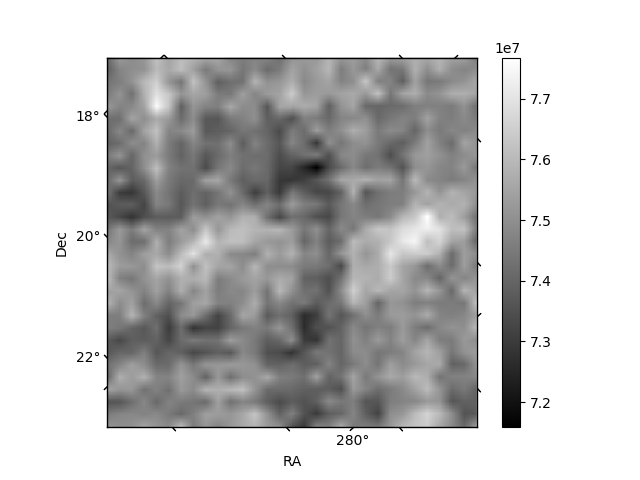
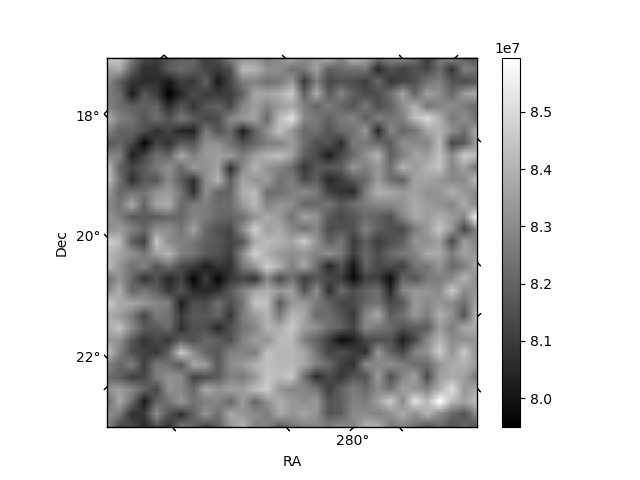
Histogram calculated using DETX and DETY for each event in the final _common_clean file
| Quadrant A | 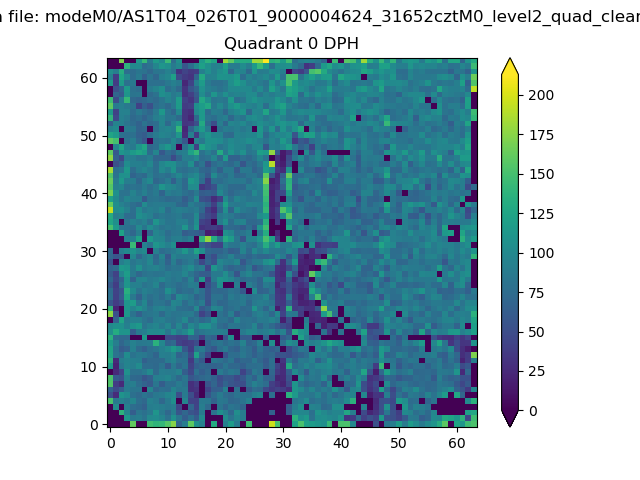 |
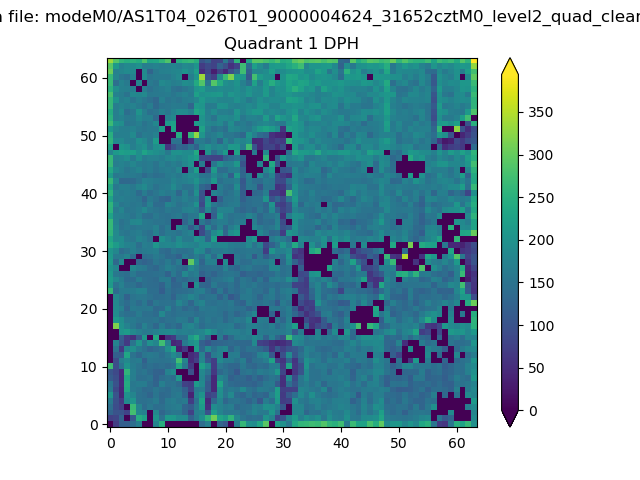 |
Quadrant B |
|---|---|---|---|
| Quadrant D | 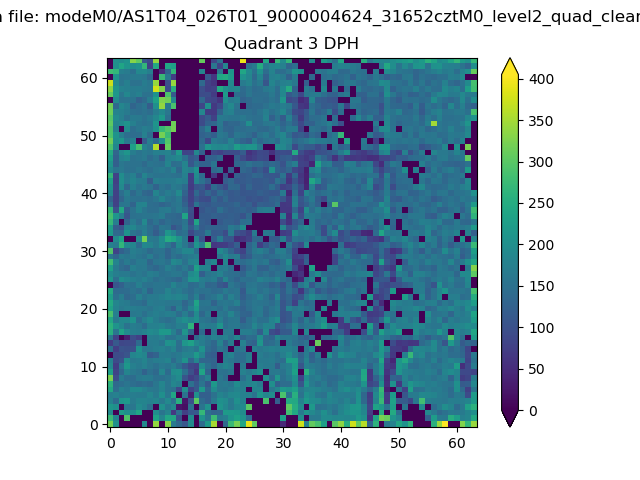 |
 |
Quadrant C |
| Plot type | Count rate plots | Images |
|---|---|---|
| Comparison with Poisson distribution Blue bars denote a histogram of data divided into 1 sec bins. Red curve is a Poisson curve with rate = median count rate of data. |
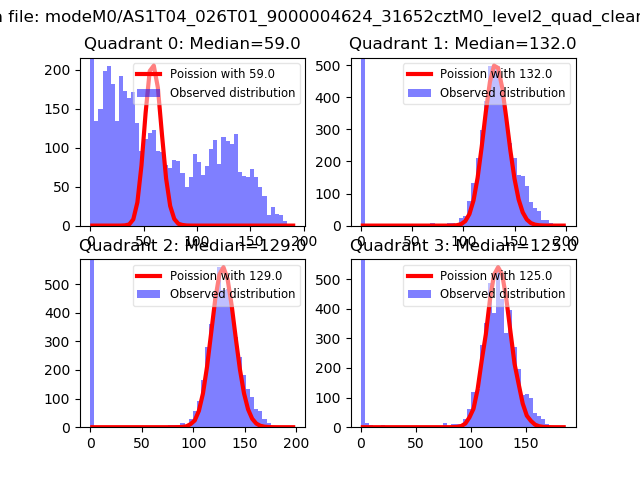 |
 |
| Quadrant-wise count rates Data is divided into 100 sec bins |
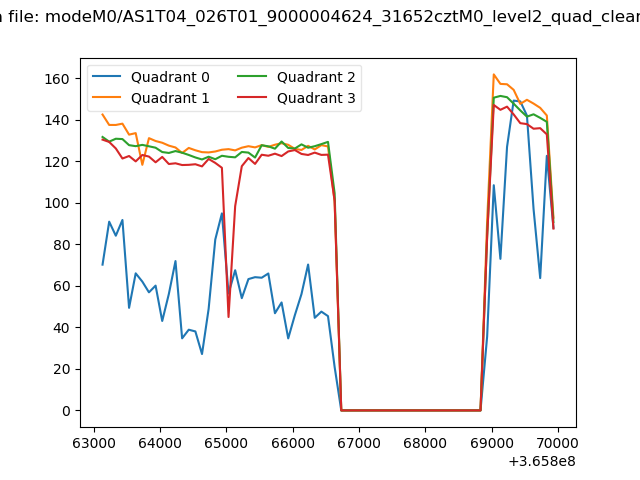 |
|
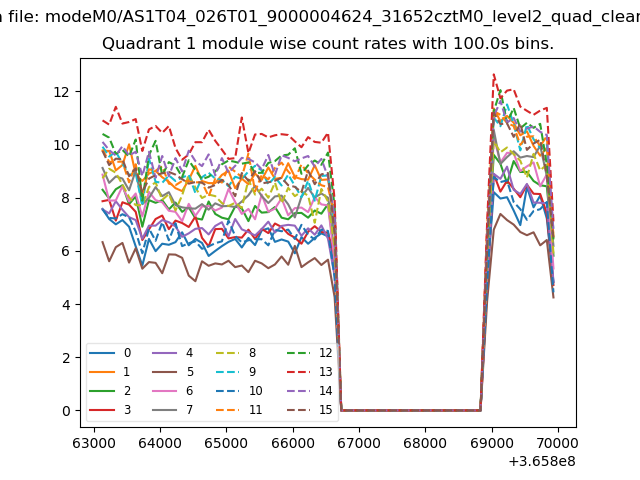
| Module-wise count rates for Quadrant A Data is divided into 100 sec bins |
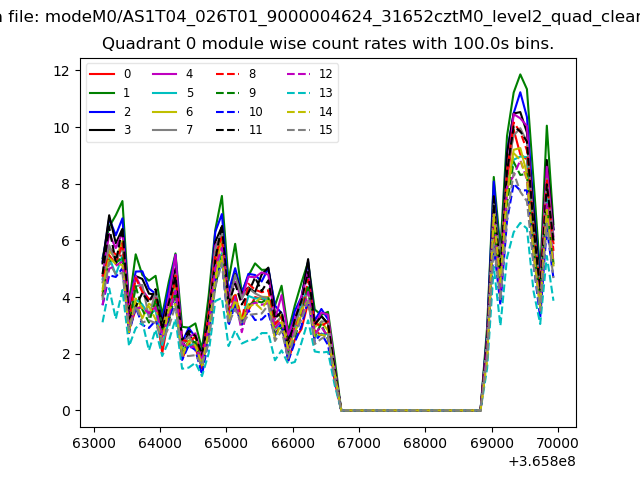 |
 |
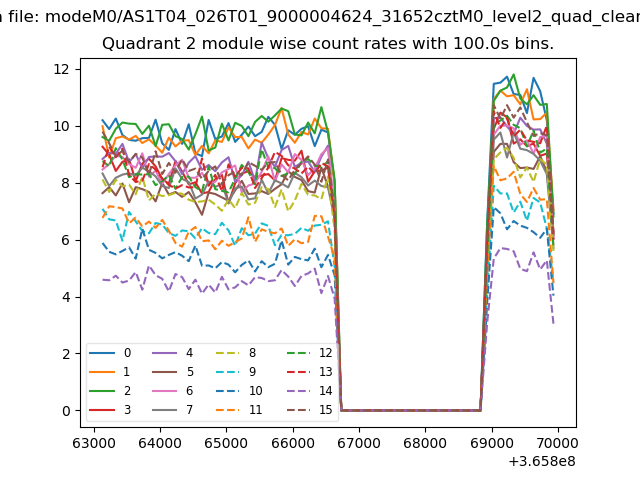
| Module-wise count rates for Quadrant B Data is divided into 100 sec bins |
 |
 |
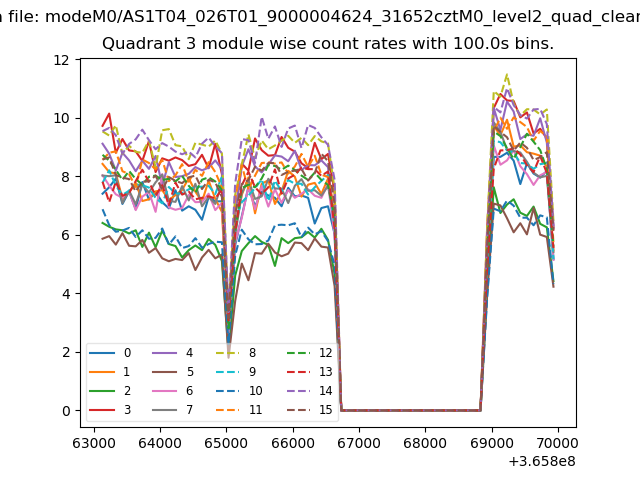
| Module-wise count rates for Quadrant C Data is divided into 100 sec bins |
 |
 |
| Module-wise count rates for Quadrant D Data is divided into 100 sec bins |
 |
 |
| Parameter | Plot |
|---|---|
| CZT HV Monitor | 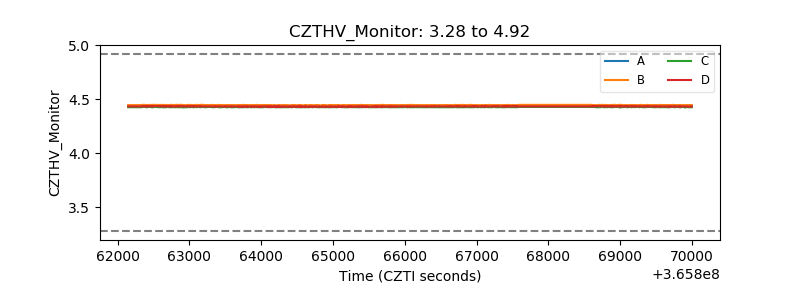 |
| D_VDD | 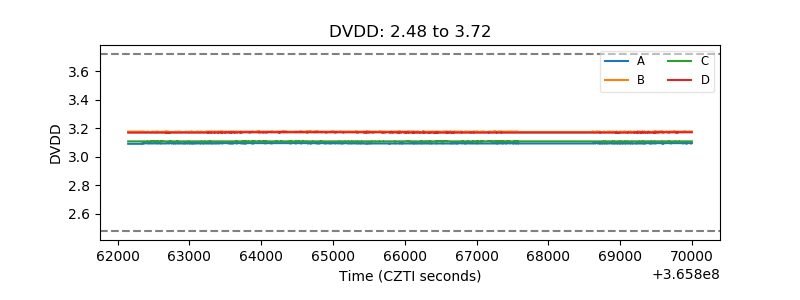 |
| Temperature 1 | 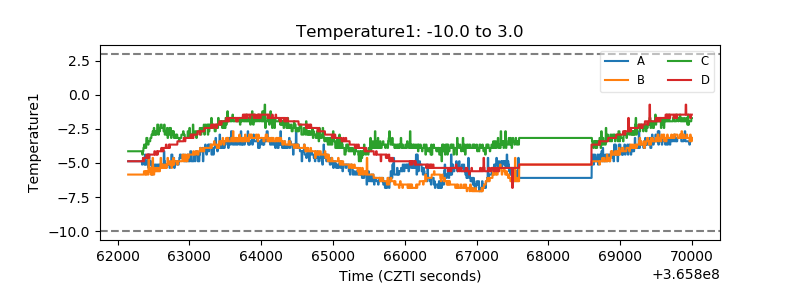 |
| Veto HV Monitor | 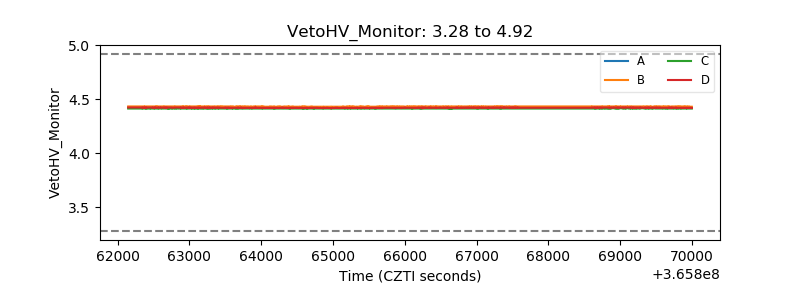 |
| Veto LLD | 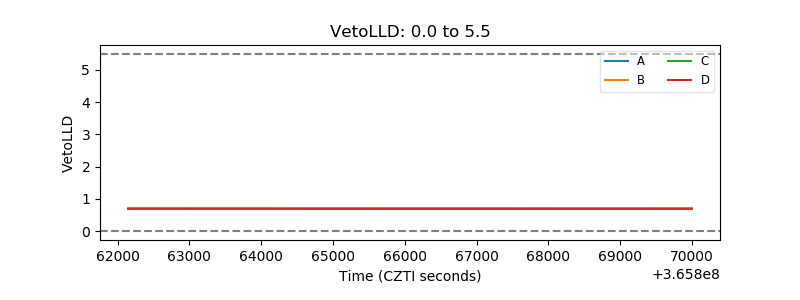 |
| Alpha Counter | 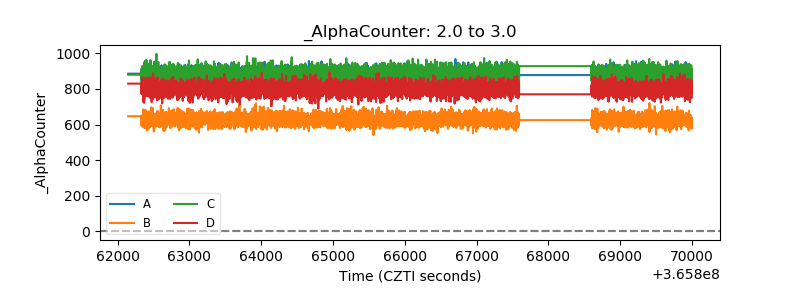 |
| _CPM_Rate | 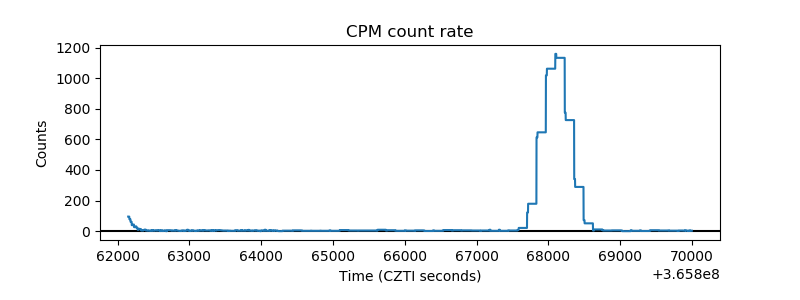 |
| CZT Counter | 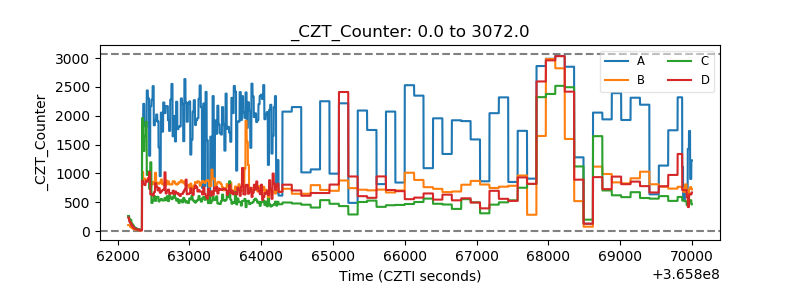 |
| +2.5 Volts monitor |  |
| +5 Volts monitor | 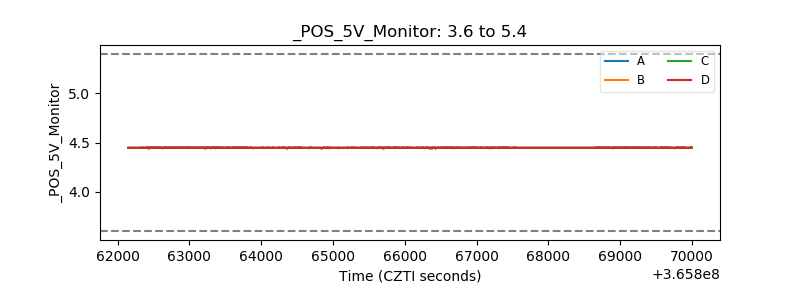 |
| _ROLL_ROT | 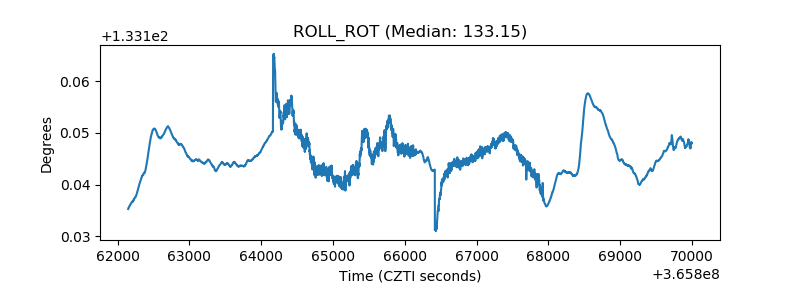 |
| _Roll_DEC | 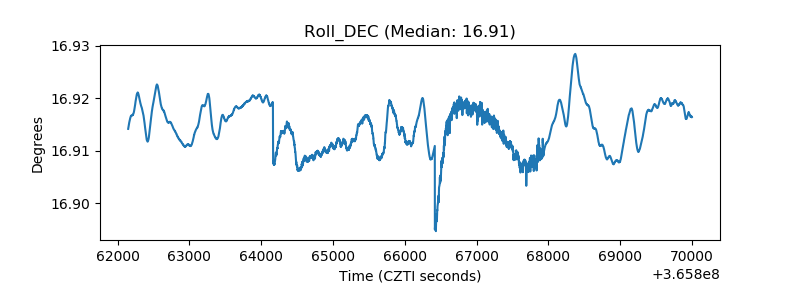 |
| _Roll_RA |  |
| Veto Counter | 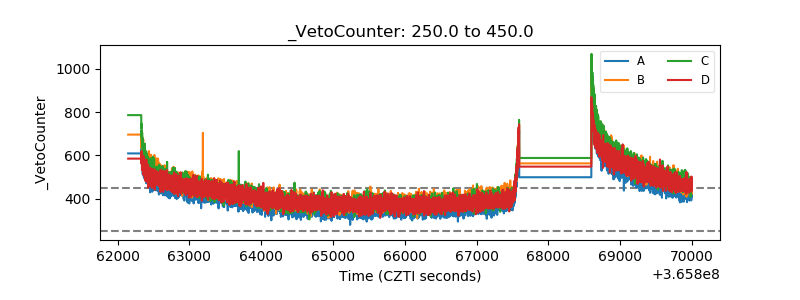 |