| Param | Original file | Final file |
|---|---|---|
| Filename | modeM0/AS1T04_026T01_9000004624_31654cztM0_level2.evt | modeM0/AS1T04_026T01_9000004624_31654cztM0_level2_quad_clean.evt |
| Size (bytes) | 253,108,800 | 39,925,440 |
| Size | 241.4 MB | 38.1 MB |
| Events in quadrant A | 3,359,531 | 207,678 |
| Events in quadrant B | 1,587,759 | 290,914 |
| Events in quadrant C | 1,036,241 | 283,382 |
| Events in quadrant D | 1,537,487 | 274,053 |
| Mode SS | |||
|---|---|---|---|
| Quadrant | BADHDUFLAG | Total packets | Discarded packets |
| A | 0 | 42 | 0 |
| B | 0 | 42 | 0 |
| C | 0 | 42 | 0 |
| D | 0 | 42 | 0 |
| Mode M0 | |||
|---|---|---|---|
| Quadrant | BADHDUFLAG | Total packets | Discarded packets |
| A | 0 | 11446 | 0 |
| B | 0 | 6460 | 0 |
| C | 0 | 4363 | 0 |
| D | 0 | 6239 | 0 |
| Quadrant | Total seconds | Saturated seconds | Saturation percentage |
|---|---|---|---|
| A | 2098 | 1091 | 52.001907% |
| B | 2099 | 9 | 0.428776% |
| C | 2099 | 11 | 0.524059% |
| D | 2099 | 18 | 0.857551% |
Noise dominated data is calculated using 1-second bins in cleaned event files. If a bin has >2000 counts, and if more than 50% of those come from <1% of pixels, then it is considered to be noise-dominated and hence unusable.
| Quadrant | # 1 sec bins | Bins with >0 counts | Bins with >2000 counts | High rate bins dominated by noise | Noise dominated (total time) | Noise dominated (detector-on time) | Marked lightcurve |
|---|---|---|---|---|---|---|---|
| A | 2098 | 2098 | 819 | 819 | 39.04% | 39.04% | 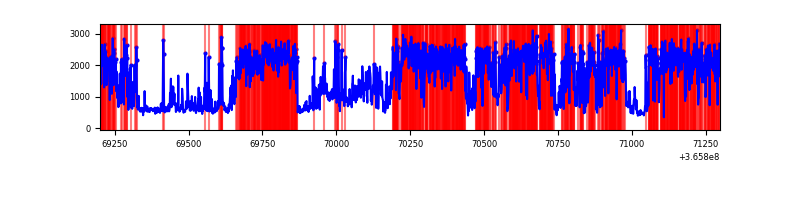 |
| B | 2099 | 2099 | 1 | 1 | 0.05% | 0.05% | 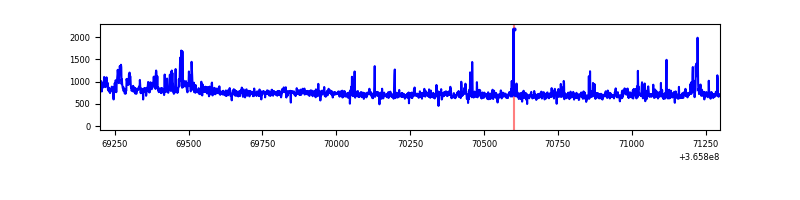 |
| C | 2099 | 2099 | 0 | 0 | 0.00% | 0.00% | 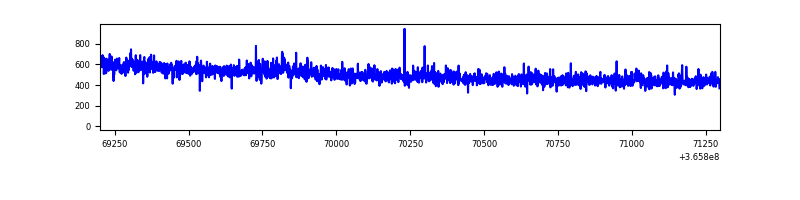 |
| D | 2099 | 2099 | 13 | 13 | 0.62% | 0.62% | 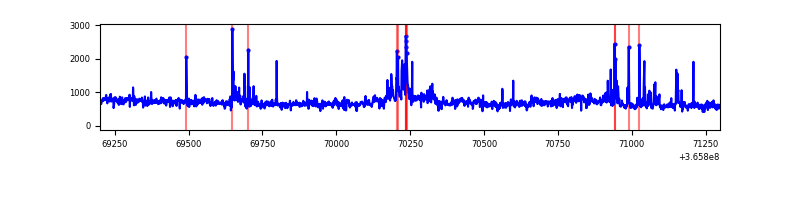 |
Top three noisy pixels from each quadrant. If the there are fewer than three noisy pixels in the level2.evt file, extra rows are filled as -1
| Pixel properties | Quadrant properties | ||||||
|---|---|---|---|---|---|---|---|
| Quadrant | DetID | PixID | Counts | Sigma | Mean | Median | Sigma |
| A | 0 | 13 | 2599510 | 63137.78 | 196 | 192 | 41.2 |
| A | 13 | 254 | 3166 | 72.24 | 196 | 192 | 41.2 |
| A | 3 | 137 | 1853 | 40.35 | 196 | 192 | 41.2 |
| B | 6 | 159 | 493277 | 9929.45 | 252 | 246 | 49.7 |
| B | 10 | 245 | 50470 | 1011.49 | 252 | 246 | 49.7 |
| B | 0 | 190 | 48159 | 964.95 | 252 | 246 | 49.7 |
| C | 14 | 238 | 41672 | 675.82 | 251 | 253 | 61.3 |
| C | 3 | 233 | 5914 | 92.37 | 251 | 253 | 61.3 |
| C | 2 | 114 | 4652 | 71.78 | 251 | 253 | 61.3 |
| D | 8 | 195 | 462238 | 7497.14 | 255 | 250 | 61.6 |
| D | 12 | 2 | 62150 | 1004.51 | 255 | 250 | 61.6 |
| D | 2 | 250 | 21742 | 348.77 | 255 | 250 | 61.6 |
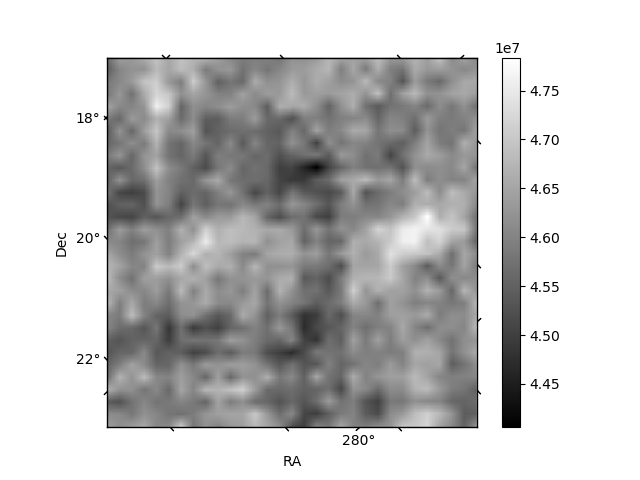
Histogram calculated using DETX and DETY for each event in the final _common_clean file
| Quadrant A |  |
 |
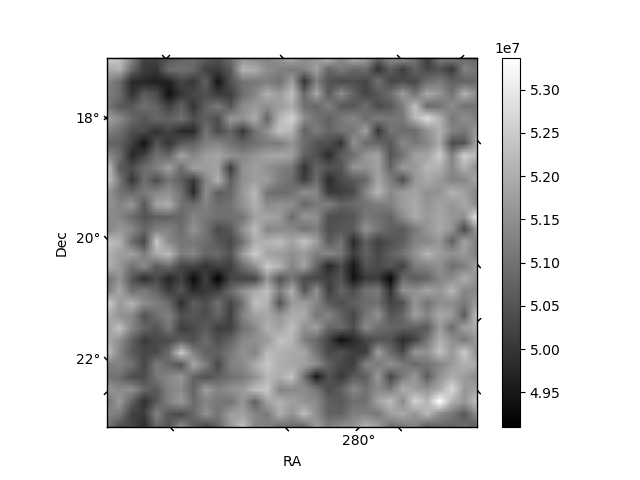
Quadrant B |
|---|---|---|---|
| Quadrant D |  |
 |
Quadrant C |
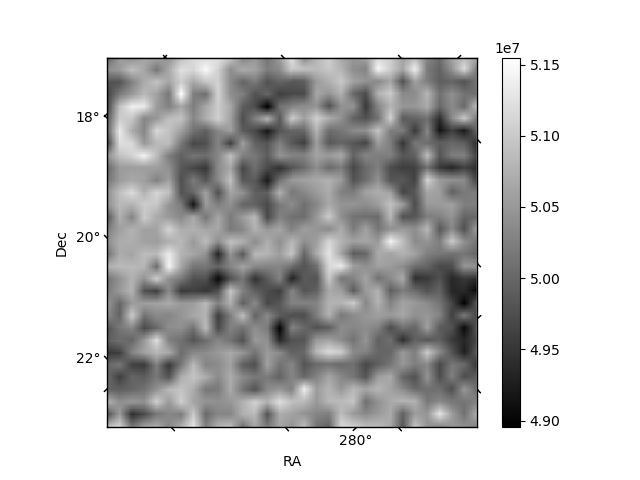
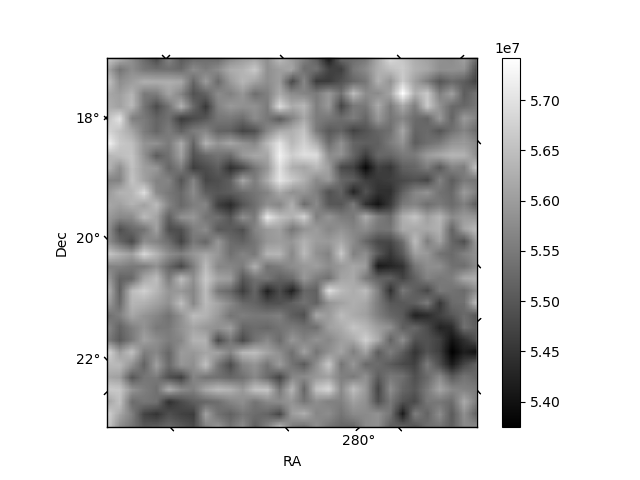
| Plot type | Count rate plots | Images |
|---|---|---|
| Comparison with Poisson distribution Blue bars denote a histogram of data divided into 1 sec bins. Red curve is a Poisson curve with rate = median count rate of data. |
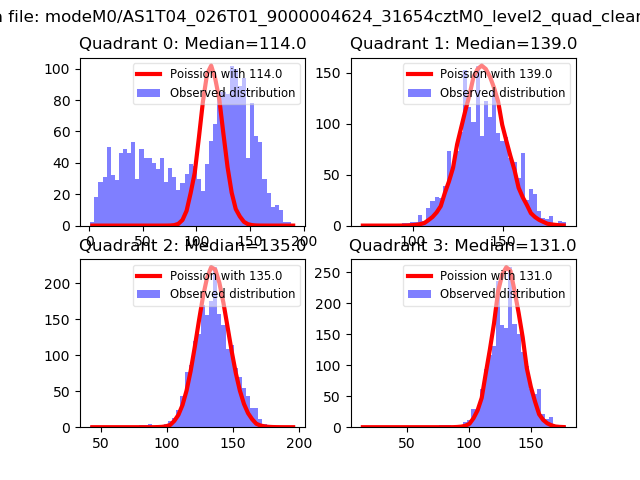 |
 |
| Quadrant-wise count rates Data is divided into 100 sec bins |
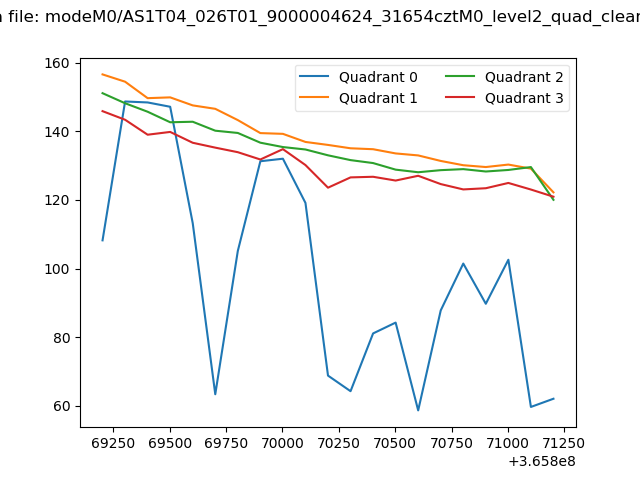 |
|
| Module-wise count rates for Quadrant A Data is divided into 100 sec bins |
 |
 |
| Module-wise count rates for Quadrant B Data is divided into 100 sec bins |
 |
 |
| Module-wise count rates for Quadrant C Data is divided into 100 sec bins |
 |
 |
| Module-wise count rates for Quadrant D Data is divided into 100 sec bins |
 |
 |
| Parameter | Plot |
|---|---|
| CZT HV Monitor |  |
| D_VDD | 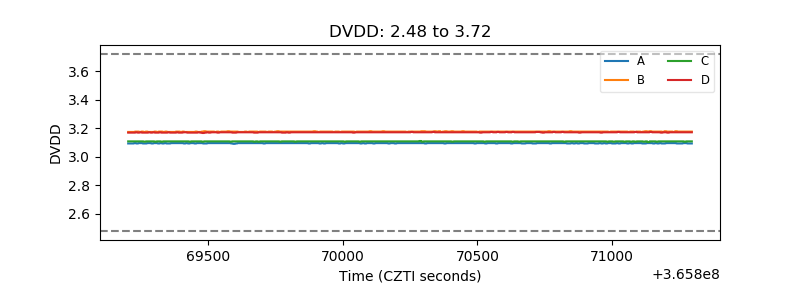 |
| Temperature 1 |  |
| Veto HV Monitor |  |
| Veto LLD |  |
| Alpha Counter | 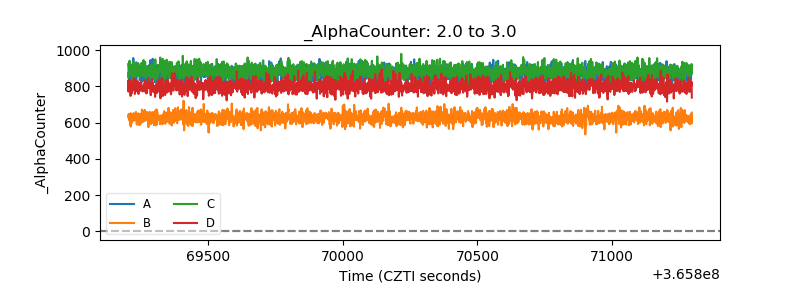 |
| _CPM_Rate | 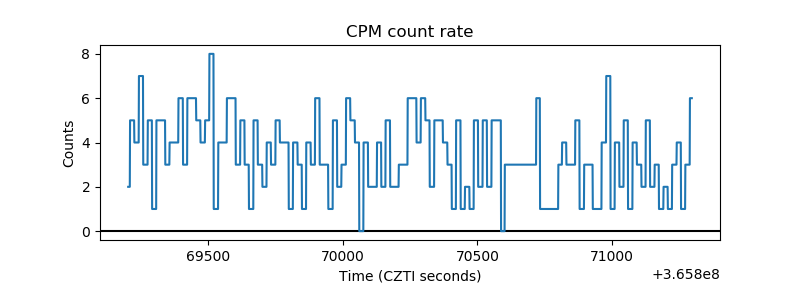 |
| CZT Counter |  |
| +2.5 Volts monitor |  |
| +5 Volts monitor |  |
| _ROLL_ROT |  |
| _Roll_DEC |  |
| _Roll_RA |  |
| Veto Counter |  |