| Param | Original file | Final file |
|---|---|---|
| Filename | modeM0/AS1A10_094T13_9000004628cztM0_level2.fits | modeM0/AS1A10_094T13_9000004628cztM0_level2_quad_clean.evt |
| Size (bytes) | 142,816,320 | 208,051,200 |
| Size | 136.2 MB | 198.4 MB |
| Events in quadrant A | 852,076 | 1,340,759 |
| Events in quadrant B | 812,312 | 1,335,377 |
| Events in quadrant C | 846,464 | 1,331,875 |
| Events in quadrant D | 746,968 | 1,226,103 |
| Mode SS | |||
|---|---|---|---|
| Quadrant | BADHDUFLAG | Total packets | Discarded packets |
| A | 0 | 314 | 0 |
| B | 0 | 314 | 0 |
| C | 0 | 314 | 0 |
| D | 0 | 314 | 0 |
| Mode M0 | |||
|---|---|---|---|
| Quadrant | BADHDUFLAG | Total packets | Discarded packets |
| A | 0 | 34731 | 0 |
| B | 0 | 48263 | 0 |
| C | 0 | 35330 | 0 |
| D | 0 | 37202 | 0 |
| Mode M9 | |||
|---|---|---|---|
| Quadrant | BADHDUFLAG | Total packets | Discarded packets |
| A | 0 | 7 | 0 |
| B | 0 | 7 | 0 |
| C | 0 | 7 | 0 |
| D | 0 | 7 | 0 |
| Quadrant | Total seconds | Saturated seconds | Saturation percentage |
|---|---|---|---|
| A | 15461 | 443 | 2.865274% |
| B | 15461 | 456 | 2.949356% |
| C | 15461 | 419 | 2.710045% |
| D | 15461 | 371 | 2.399586% |
Noise dominated data is calculated using 1-second bins in cleaned event files. If a bin has >2000 counts, and if more than 50% of those come from <1% of pixels, then it is considered to be noise-dominated and hence unusable.
| Quadrant | # 1 sec bins | Bins with >0 counts | Bins with >2000 counts | High rate bins dominated by noise | Noise dominated (total time) | Noise dominated (detector-on time) | Marked lightcurve |
|---|---|---|---|---|---|---|---|
| A | 16176 | 15444 | 0 | 0 | 0.00% | 0.00% | 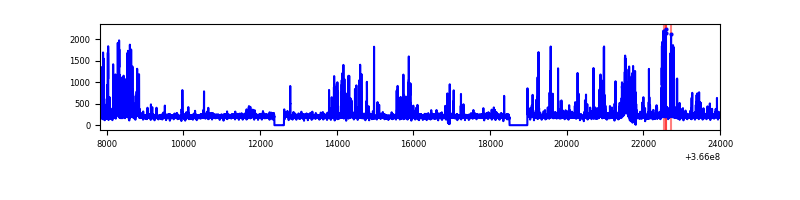 |
| B | 16176 | 15460 | 0 | 0 | 0.00% | 0.00% |  |
| C | 16176 | 15461 | 0 | 0 | 0.00% | 0.00% |  |
| D | 16176 | 15437 | 0 | 0 | 0.00% | 0.00% |  |
Top three noisy pixels from each quadrant. If the there are fewer than three noisy pixels in the level2.evt file, extra rows are filled as -1
| Pixel properties | Quadrant properties | ||||||
|---|---|---|---|---|---|---|---|
| Quadrant | DetID | PixID | Counts | Sigma | Mean | Median | Sigma |
| A | 0 | 29 | 716 | 9.01 | 222 | 208 | 56.4 |
| A | 0 | 30 | 672 | 8.23 | 222 | 208 | 56.4 |
| A | 7 | 110 | 649 | 7.82 | 222 | 208 | 56.4 |
| B | 2 | 9 | 688 | 10.75 | 214 | 204 | 45.0 |
| B | 14 | 254 | 556 | 7.82 | 214 | 204 | 45.0 |
| B | 2 | 8 | 548 | 7.64 | 214 | 204 | 45.0 |
| C | 12 | 241 | 623 | 7.04 | 223 | 209 | 58.8 |
| C | 9 | 233 | 582 | 6.34 | 223 | 209 | 58.8 |
| C | 7 | 111 | 582 | 6.34 | 223 | 209 | 58.8 |
| D | 4 | 246 | 597 | 6.8 | 212 | 193 | 59.4 |
| D | 15 | 47 | 578 | 6.48 | 212 | 193 | 59.4 |
| D | 10 | 189 | 562 | 6.21 | 212 | 193 | 59.4 |
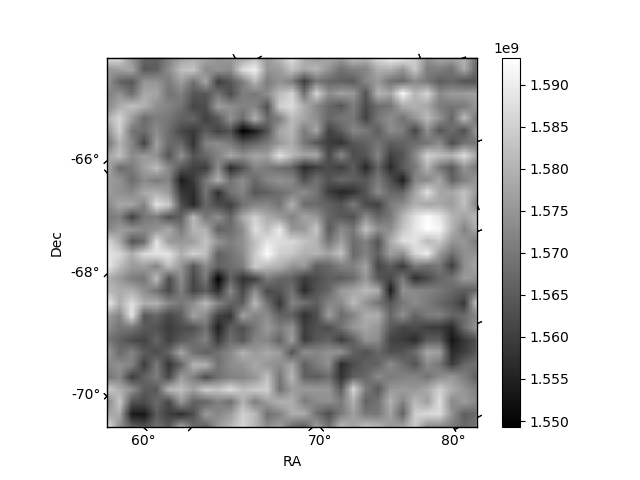
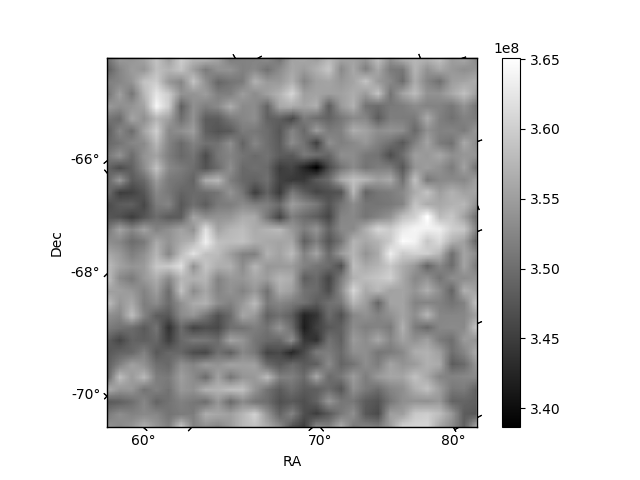
Histogram calculated using DETX and DETY for each event in the final _common_clean file
| Quadrant A | 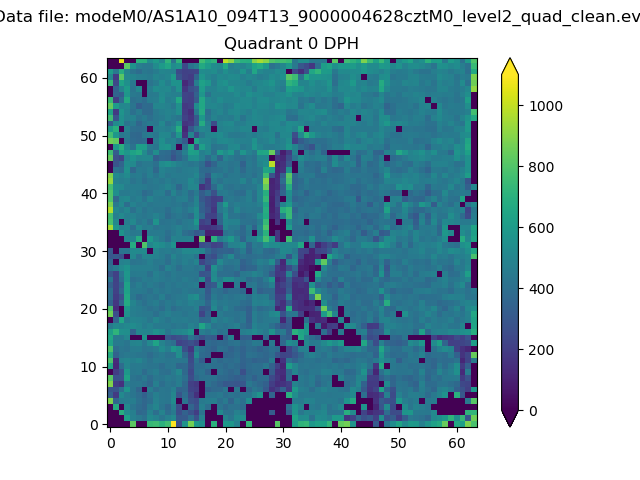 |
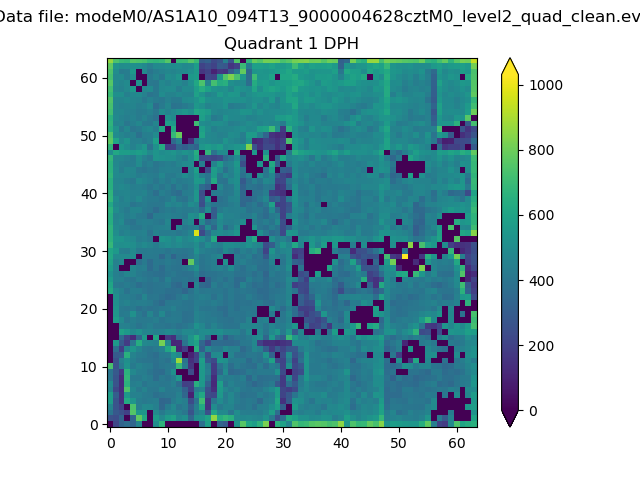 |
Quadrant B |
|---|---|---|---|
| Quadrant D | 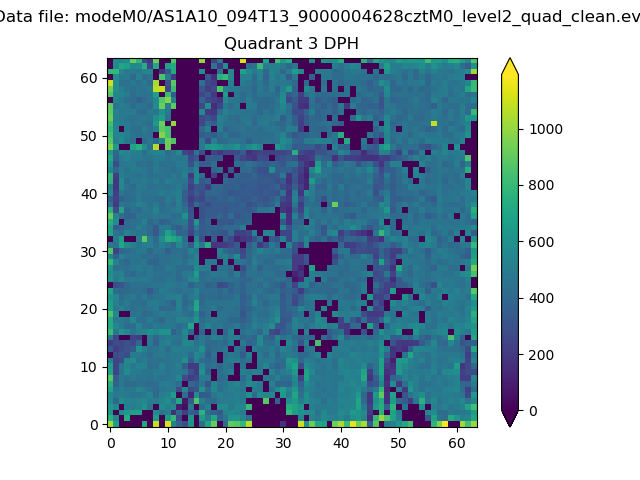 |
 |
Quadrant C |
| Plot type | Count rate plots | Images |
|---|---|---|
| Comparison with Poisson distribution Blue bars denote a histogram of data divided into 1 sec bins. Red curve is a Poisson curve with rate = median count rate of data. |
 |
 |
| Quadrant-wise count rates Data is divided into 100 sec bins |
 |
|
| Module-wise count rates for Quadrant A Data is divided into 100 sec bins |
 |
 |
| Module-wise count rates for Quadrant B Data is divided into 100 sec bins |
 |
 |
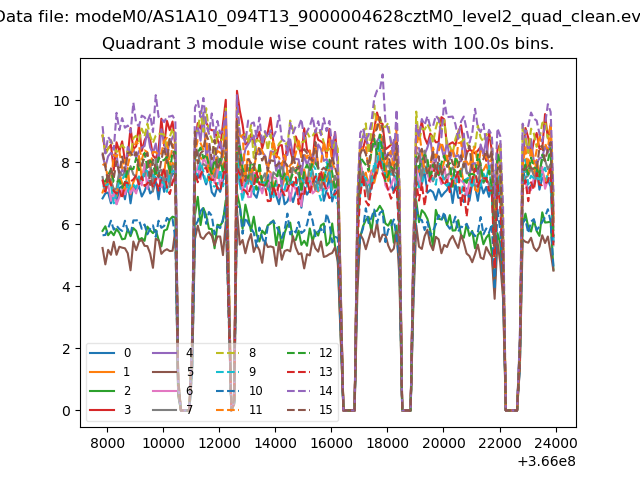
| Module-wise count rates for Quadrant C Data is divided into 100 sec bins |
 |
 |
| Module-wise count rates for Quadrant D Data is divided into 100 sec bins |
 |
 |
| Parameter | Plot |
|---|---|
| CZT HV Monitor |  |
| D_VDD |  |
| Temperature 1 |  |
| Veto HV Monitor |  |
| Veto LLD |  |
| Alpha Counter |  |
| _CPM_Rate |  |
| CZT Counter |  |
| +2.5 Volts monitor |  |
| +5 Volts monitor |  |
| _ROLL_ROT |  |
| _Roll_DEC |  |
| _Roll_RA |  |
| Veto Counter |  |