| Param | Original file | Final file |
|---|---|---|
| Filename | modeM0/AS1A10_094T13_9000004628_31681cztM0_level2.evt | modeM0/AS1A10_094T13_9000004628_31681cztM0_level2_quad_clean.evt |
| Size (bytes) | 1,009,483,200 | 97,562,880 |
| Size | 962.7 MB | 93.0 MB |
| Events in quadrant A | 6,214,417 | 536,524 |
| Events in quadrant B | 9,395,655 | 533,251 |
| Events in quadrant C | 6,852,976 | 538,065 |
| Events in quadrant D | 7,307,637 | 524,755 |
| Mode SS | |||
|---|---|---|---|
| Quadrant | BADHDUFLAG | Total packets | Discarded packets |
| A | 0 | 256 | 16 |
| B | 0 | 256 | 14 |
| C | 0 | 259 | 15 |
| D | 0 | 261 | 19 |
| Mode M0 | |||
|---|---|---|---|
| Quadrant | BADHDUFLAG | Total packets | Discarded packets |
| A | 0 | 28133 | 1957 |
| B | 0 | 39608 | 2241 |
| C | 0 | 29060 | 1461 |
| D | 0 | 31084 | 1682 |
| Mode M9 | |||
|---|---|---|---|
| Quadrant | BADHDUFLAG | Total packets | Discarded packets |
| A | 0 | 7 | 1 |
| B | 0 | 8 | 3 |
| C | 0 | 8 | 2 |
| D | 0 | 6 | 1 |
| Quadrant | Total seconds | Saturated seconds | Saturation percentage |
|---|---|---|---|
| A | 11877 | 311 | 2.618506% |
| B | 11848 | 417 | 3.519581% |
| C | 11893 | 333 | 2.799966% |
| D | 11864 | 332 | 2.798382% |
Noise dominated data is calculated using 1-second bins in cleaned event files. If a bin has >2000 counts, and if more than 50% of those come from <1% of pixels, then it is considered to be noise-dominated and hence unusable.
| Quadrant | # 1 sec bins | Bins with >0 counts | Bins with >2000 counts | High rate bins dominated by noise | Noise dominated (total time) | Noise dominated (detector-on time) | Marked lightcurve |
|---|---|---|---|---|---|---|---|
| A | 16116 | 11937 | 105 | 105 | 0.65% | 0.88% | 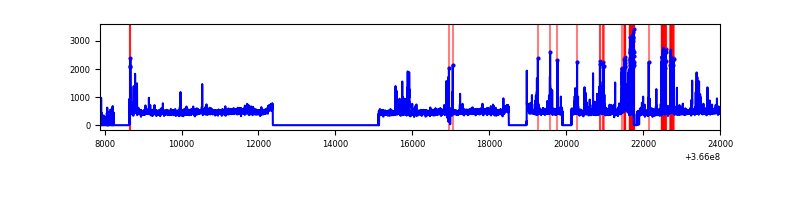 |
| B | 16116 | 11912 | 94 | 94 | 0.58% | 0.79% | 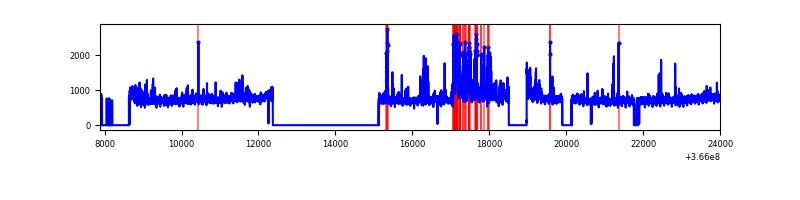 |
| C | 16119 | 11959 | 58 | 58 | 0.36% | 0.48% | 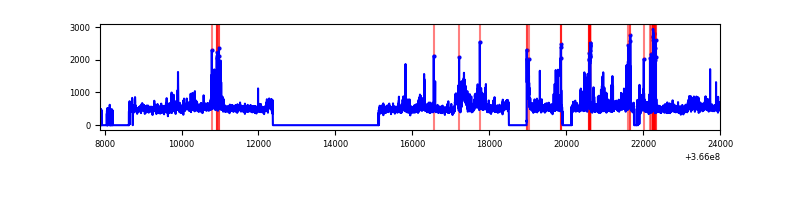 |
| D | 16116 | 11930 | 226 | 226 | 1.40% | 1.89% | 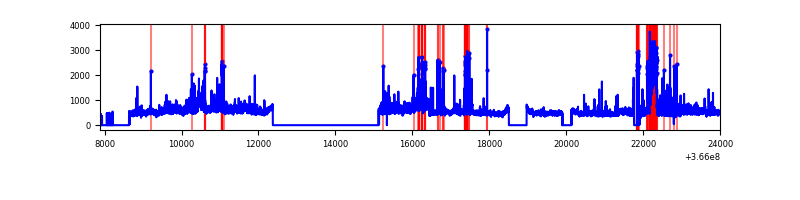 |
Top three noisy pixels from each quadrant. If the there are fewer than three noisy pixels in the level2.evt file, extra rows are filled as -1
| Pixel properties | Quadrant properties | ||||||
|---|---|---|---|---|---|---|---|
| Quadrant | DetID | PixID | Counts | Sigma | Mean | Median | Sigma |
| A | 0 | 13 | 830366 | 2961.06 | 1382 | 1352 | 280.0 |
| A | 4 | 48 | 36129 | 124.22 | 1382 | 1352 | 280.0 |
| A | 13 | 254 | 22291 | 74.79 | 1382 | 1352 | 280.0 |
| B | 6 | 159 | 3139464 | 12031.56 | 1365 | 1328 | 260.8 |
| B | 4 | 80 | 675910 | 2586.34 | 1365 | 1328 | 260.8 |
| B | 0 | 190 | 44092 | 163.96 | 1365 | 1328 | 260.8 |
| C | 3 | 233 | 856266 | 2740.41 | 1334 | 1341 | 312.0 |
| C | 0 | 10 | 376185 | 1201.54 | 1334 | 1341 | 312.0 |
| C | 14 | 238 | 217214 | 691.97 | 1334 | 1341 | 312.0 |
| D | 8 | 195 | 1284995 | 4071.8 | 1333 | 1296 | 315.3 |
| D | 13 | 249 | 688937 | 2181.15 | 1333 | 1296 | 315.3 |
| D | 2 | 250 | 160862 | 506.13 | 1333 | 1296 | 315.3 |
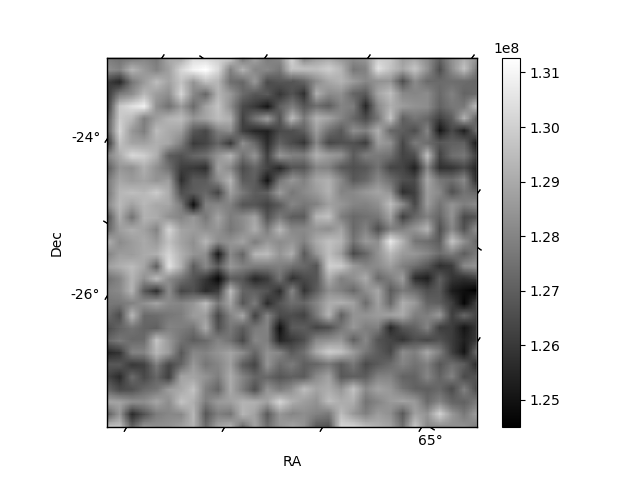
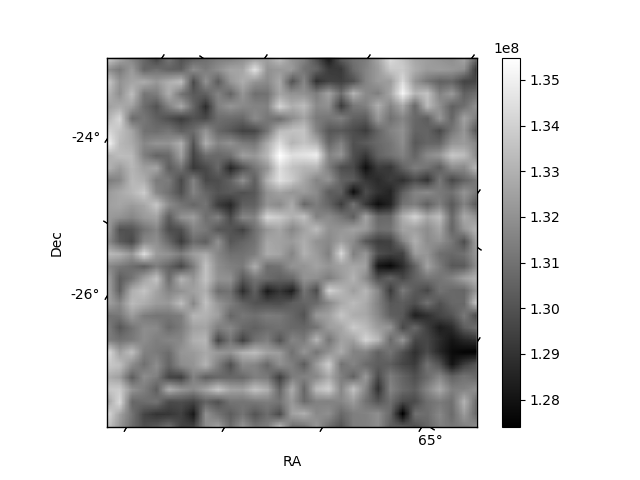
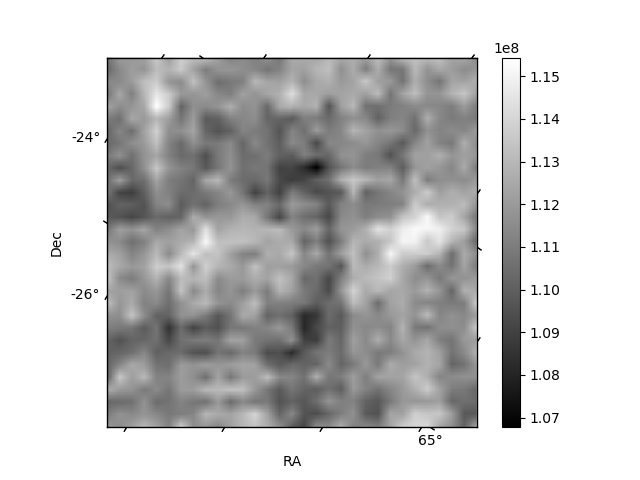
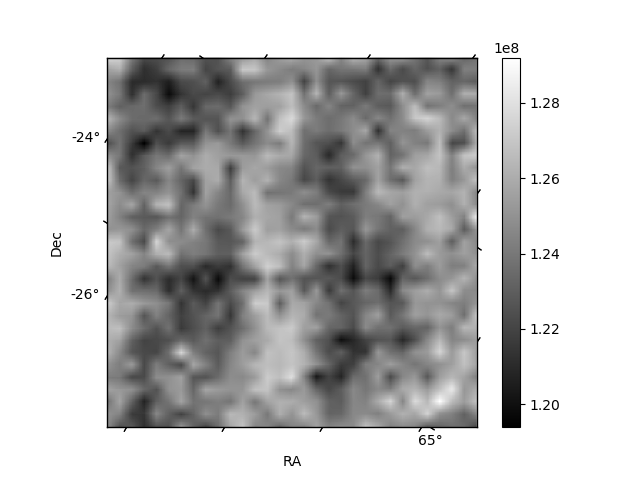
Histogram calculated using DETX and DETY for each event in the final _common_clean file
| Quadrant A | 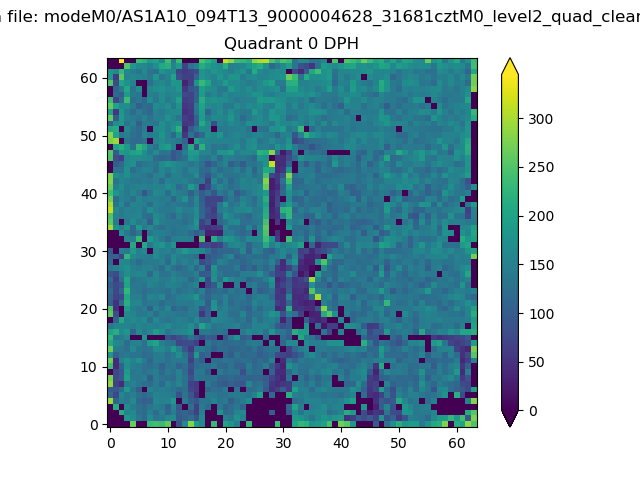 |
 |
Quadrant B |
|---|---|---|---|
| Quadrant D |  |
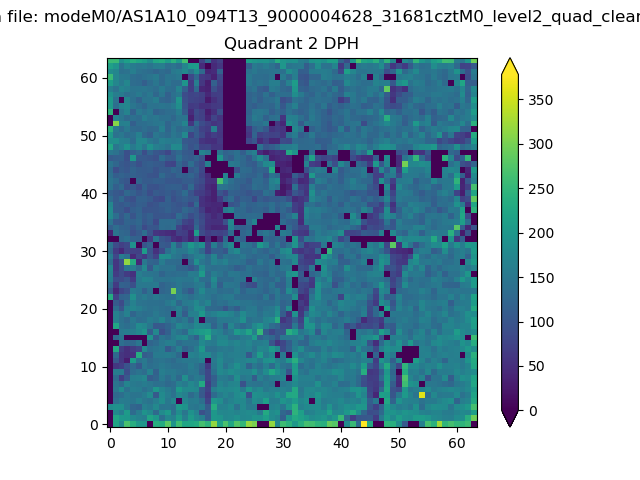 |
Quadrant C |
| Plot type | Count rate plots | Images |
|---|---|---|
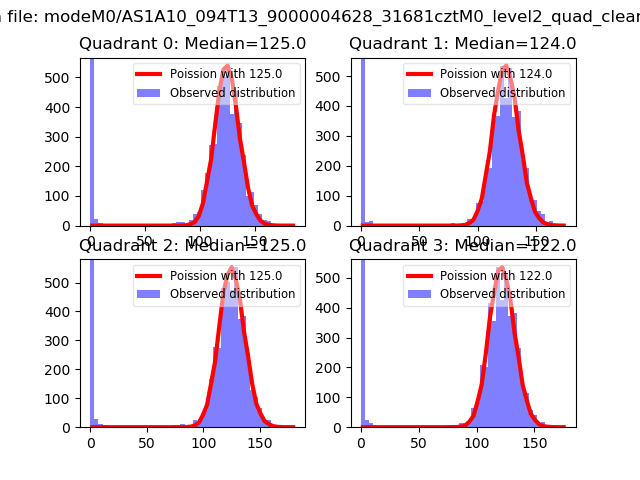
| Comparison with Poisson distribution Blue bars denote a histogram of data divided into 1 sec bins. Red curve is a Poisson curve with rate = median count rate of data. |
 |
 |
| Quadrant-wise count rates Data is divided into 100 sec bins |
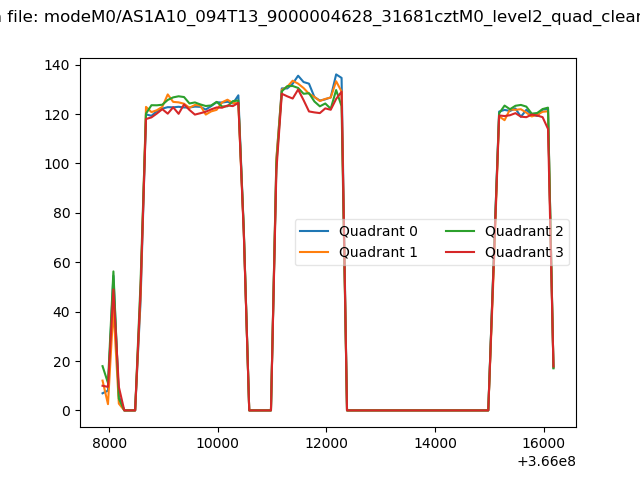 |
|
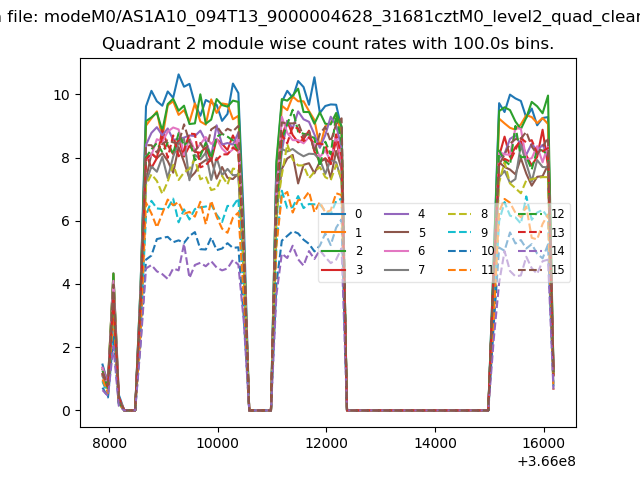
| Module-wise count rates for Quadrant A Data is divided into 100 sec bins |
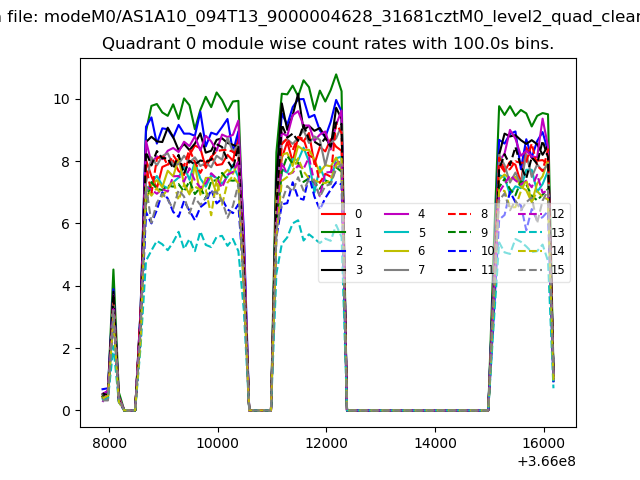 |
 |
| Module-wise count rates for Quadrant B Data is divided into 100 sec bins |
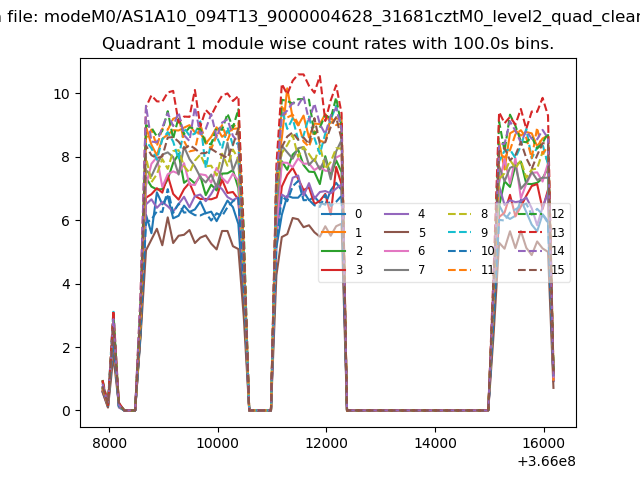 |
 |
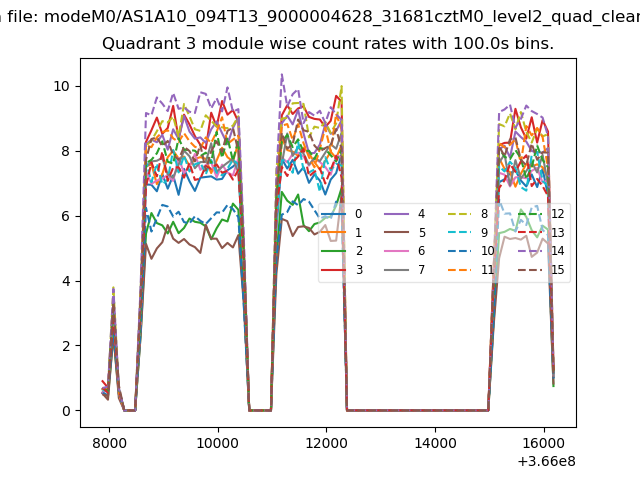
| Module-wise count rates for Quadrant C Data is divided into 100 sec bins |
 |
 |
| Module-wise count rates for Quadrant D Data is divided into 100 sec bins |
 |
 |
| Parameter | Plot |
|---|---|
| CZT HV Monitor |  |
| D_VDD | 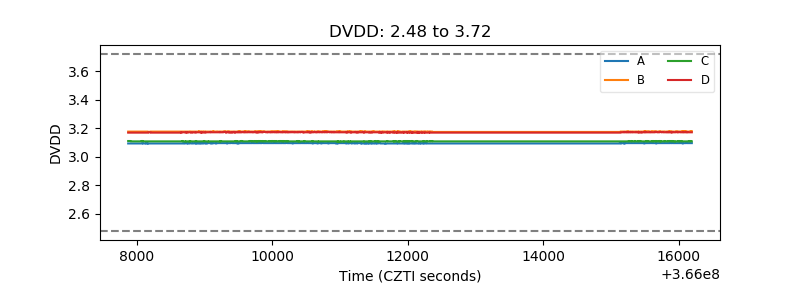 |
| Temperature 1 | 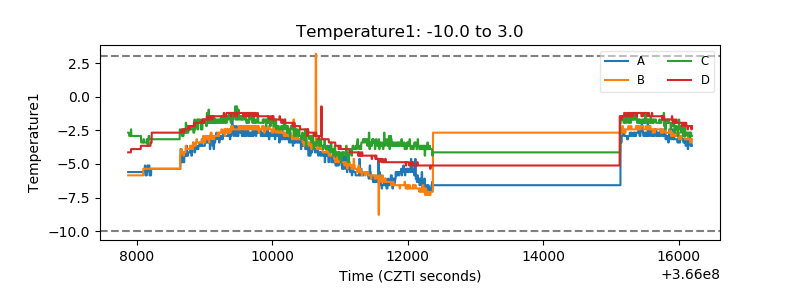 |
| Veto HV Monitor | 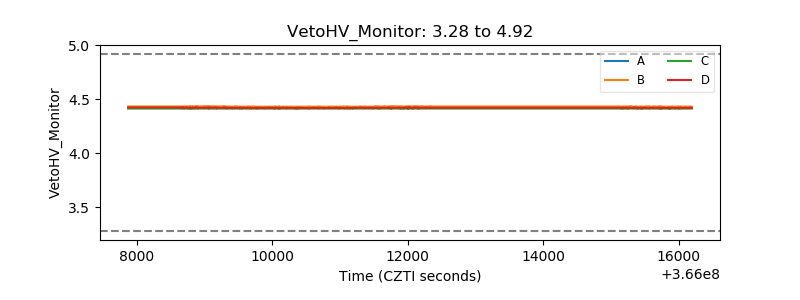 |
| Veto LLD | 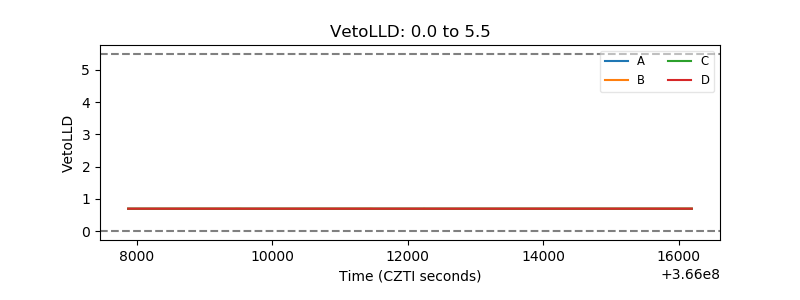 |
| Alpha Counter | 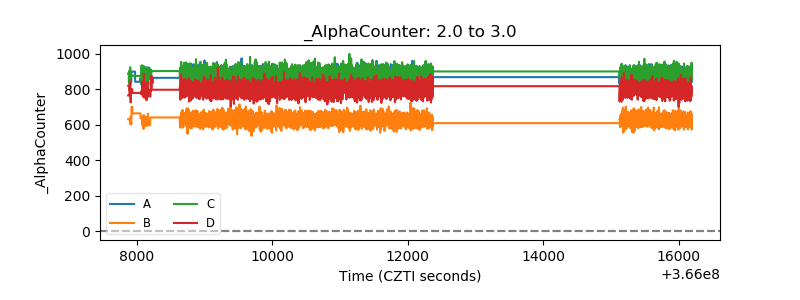 |
| _CPM_Rate | 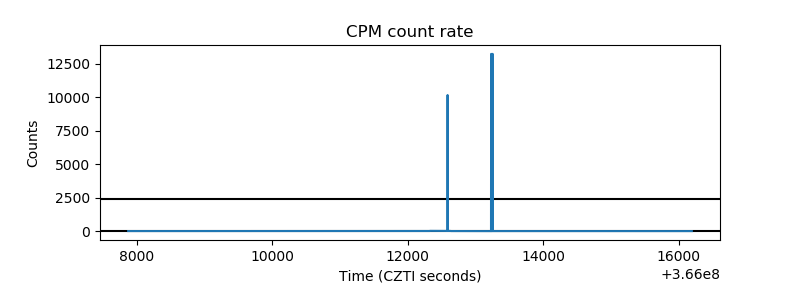 |
| CZT Counter | 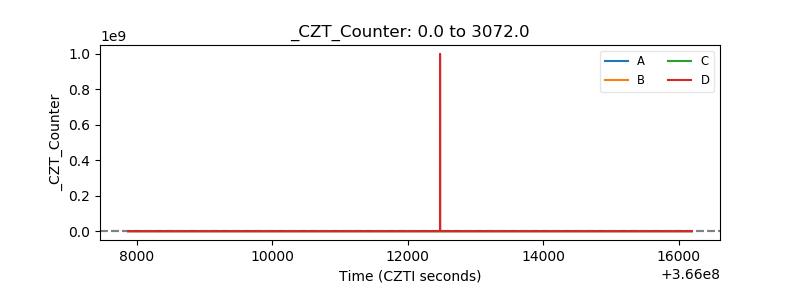 |
| +2.5 Volts monitor |  |
| +5 Volts monitor |  |
| _ROLL_ROT | 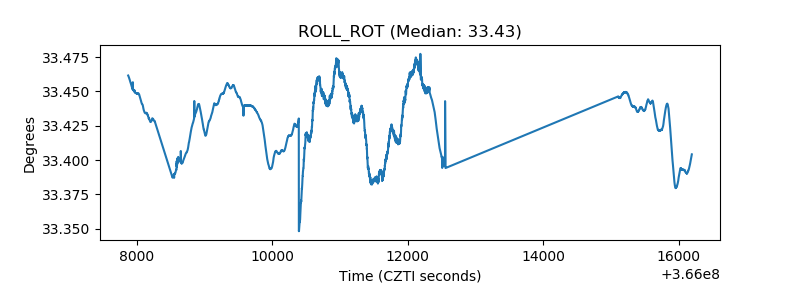 |
| _Roll_DEC | 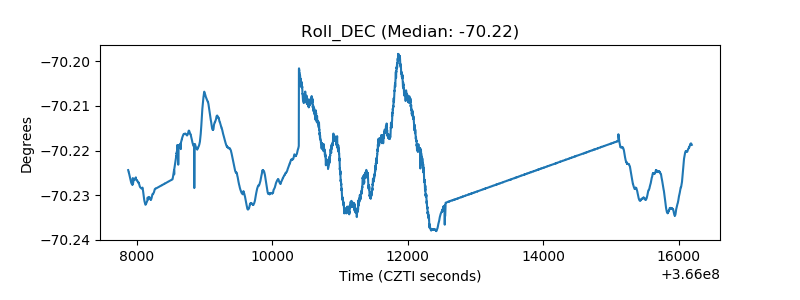 |
| _Roll_RA | 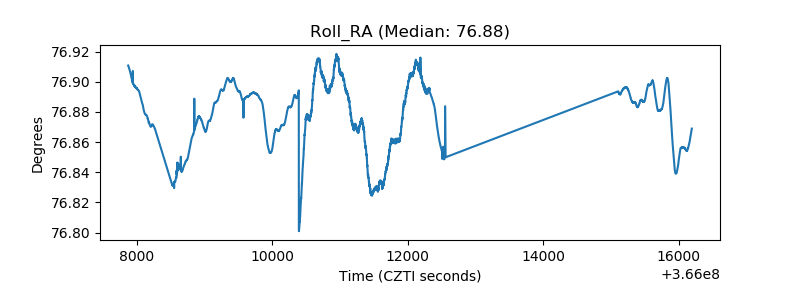 |
| Veto Counter | 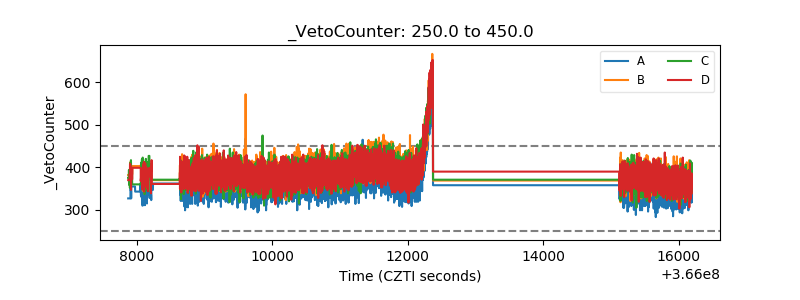 |