| Param | Original file | Final file |
|---|---|---|
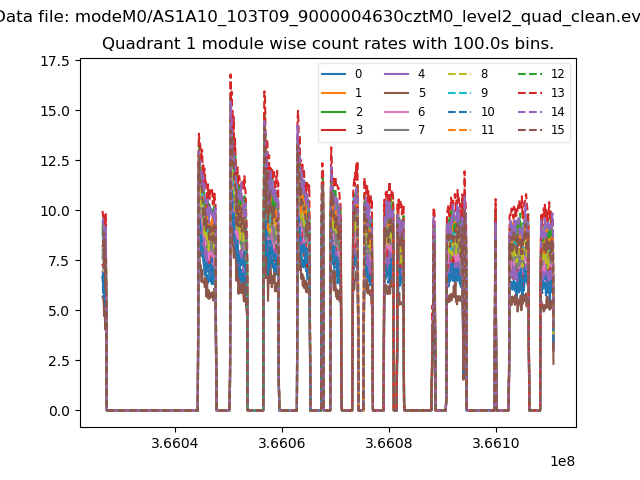
| Filename | modeM0/AS1A10_103T09_9000004630cztM0_level2.fits | modeM0/AS1A10_103T09_9000004630cztM0_level2_quad_clean.evt |
| Size (bytes) | 508,086,720 | 372,409,920 |
| Size | 484.5 MB | 355.2 MB |
| Events in quadrant A | 3,204,446 | 2,047,920 |
| Events in quadrant B | 2,968,678 | 2,010,426 |
| Events in quadrant C | 3,014,518 | 1,927,285 |
| Events in quadrant D | 2,699,727 | 1,791,806 |
| Mode M9 | |||
|---|---|---|---|
| Quadrant | BADHDUFLAG | Total packets | Discarded packets |
| A | 0 | 84 | 0 |
| B | 0 | 84 | 0 |
| C | 0 | 84 | 0 |
| D | 0 | 84 | 0 |
| Mode M0 | |||
|---|---|---|---|
| Quadrant | BADHDUFLAG | Total packets | Discarded packets |
| A | 0 | 112065 | 0 |
| B | 0 | 165919 | 0 |
| C | 0 | 139509 | 0 |
| D | 0 | 124289 | 0 |
| Mode SS | |||
|---|---|---|---|
| Quadrant | BADHDUFLAG | Total packets | Discarded packets |
| A | 0 | 1040 | 0 |
| B | 0 | 1040 | 0 |
| C | 0 | 1040 | 0 |
| D | 0 | 1040 | 0 |
| Quadrant | Total seconds | Saturated seconds | Saturation percentage |
|---|---|---|---|
| A | 50991 | 730 | 1.431625% |
| B | 50966 | 1805 | 3.541577% |
| C | 50965 | 2646 | 5.191798% |
| D | 50983 | 1307 | 2.563600% |
Noise dominated data is calculated using 1-second bins in cleaned event files. If a bin has >2000 counts, and if more than 50% of those come from <1% of pixels, then it is considered to be noise-dominated and hence unusable.
| Quadrant | # 1 sec bins | Bins with >0 counts | Bins with >2000 counts | High rate bins dominated by noise | Noise dominated (total time) | Noise dominated (detector-on time) | Marked lightcurve |
|---|---|---|---|---|---|---|---|
| A | 85510 | 51037 | 0 | 0 | 0.00% | 0.00% | 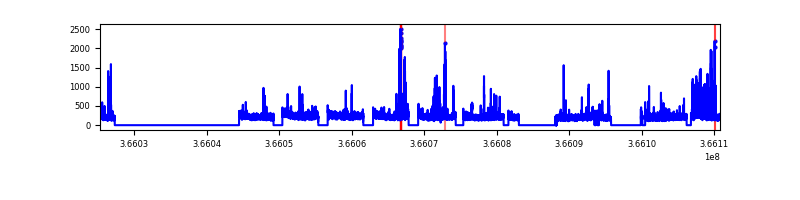 |
| B | 85510 | 51002 | 0 | 0 | 0.00% | 0.00% | 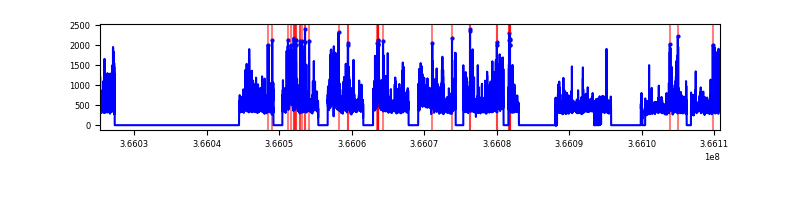 |
| C | 85510 | 51018 | 0 | 0 | 0.00% | 0.00% | 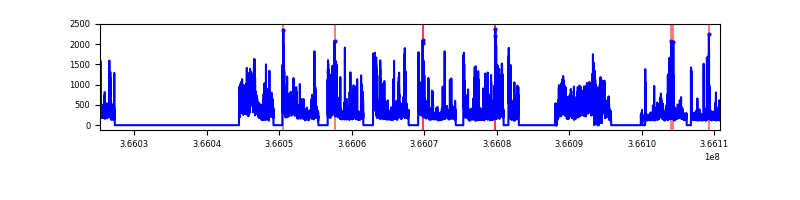 |
| D | 85510 | 51010 | 0 | 0 | 0.00% | 0.00% | 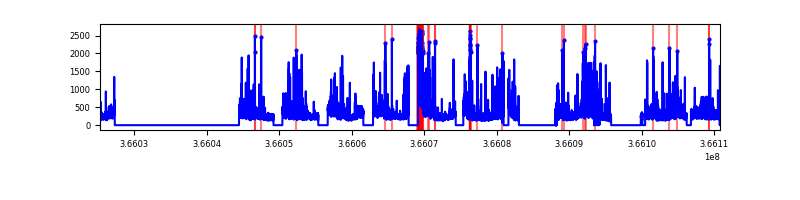 |
Top three noisy pixels from each quadrant. If the there are fewer than three noisy pixels in the level2.evt file, extra rows are filled as -1
| Pixel properties | Quadrant properties | ||||||
|---|---|---|---|---|---|---|---|
| Quadrant | DetID | PixID | Counts | Sigma | Mean | Median | Sigma |
| A | 0 | 29 | 2656 | 9.06 | 836 | 787 | 206.3 |
| A | 7 | 110 | 2576 | 8.67 | 836 | 787 | 206.3 |
| A | 9 | 19 | 2396 | 7.8 | 836 | 787 | 206.3 |
| B | 2 | 9 | 2404 | 10.71 | 787 | 753 | 154.2 |
| B | 2 | 8 | 2027 | 8.26 | 787 | 753 | 154.2 |
| B | 5 | 128 | 2018 | 8.2 | 787 | 753 | 154.2 |
| C | 1 | 81 | 2346 | 7.95 | 797 | 747 | 201.2 |
| C | 1 | 80 | 2339 | 7.91 | 797 | 747 | 201.2 |
| C | 3 | 202 | 2247 | 7.45 | 797 | 747 | 201.2 |
| D | 10 | 189 | 1974 | 6.2 | 773 | 707 | 204.5 |
| D | 6 | 231 | 1891 | 5.79 | 773 | 707 | 204.5 |
| D | 7 | 3 | 1886 | 5.77 | 773 | 707 | 204.5 |
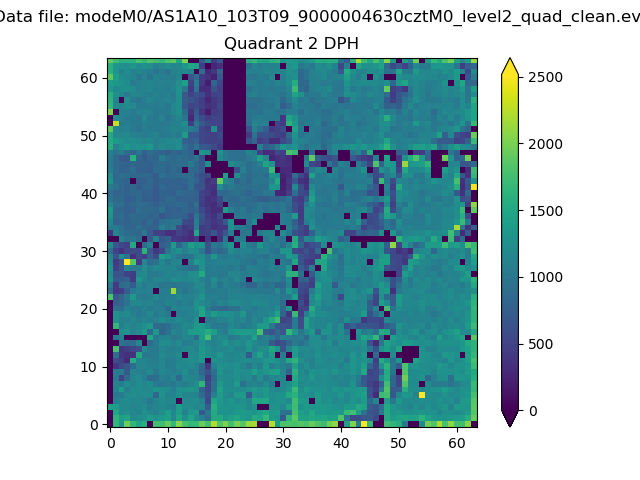
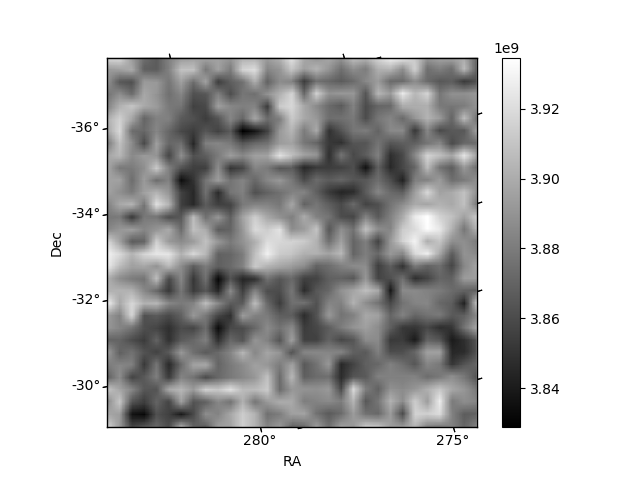
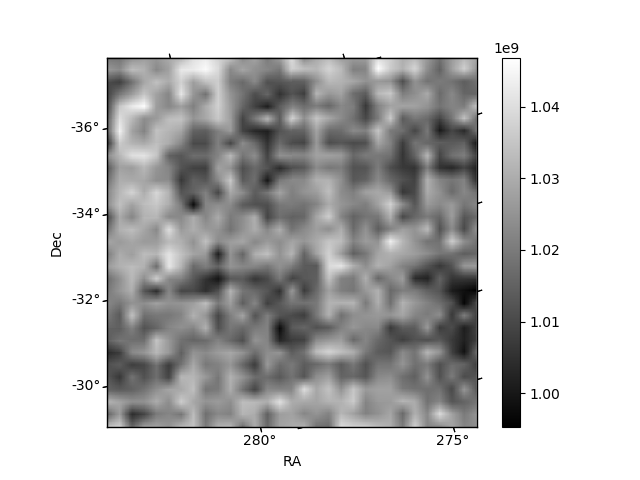
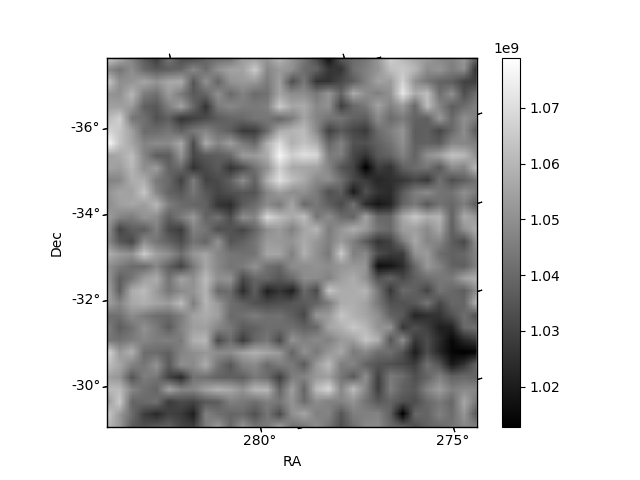
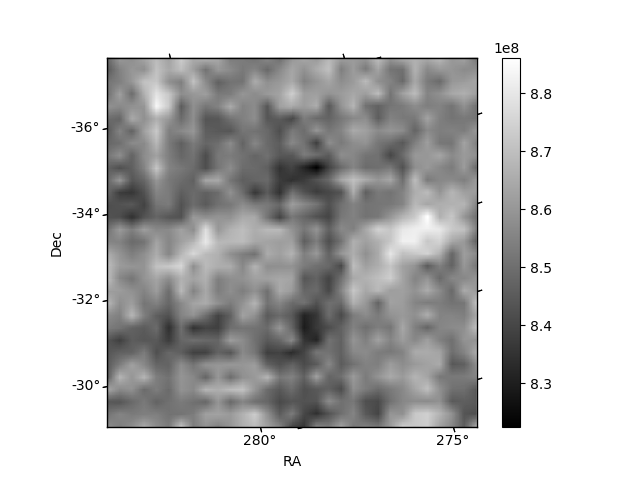
Histogram calculated using DETX and DETY for each event in the final _common_clean file
| Quadrant A | 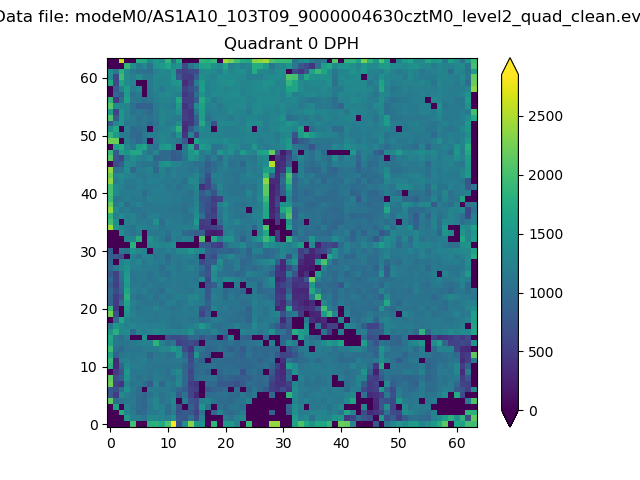 |
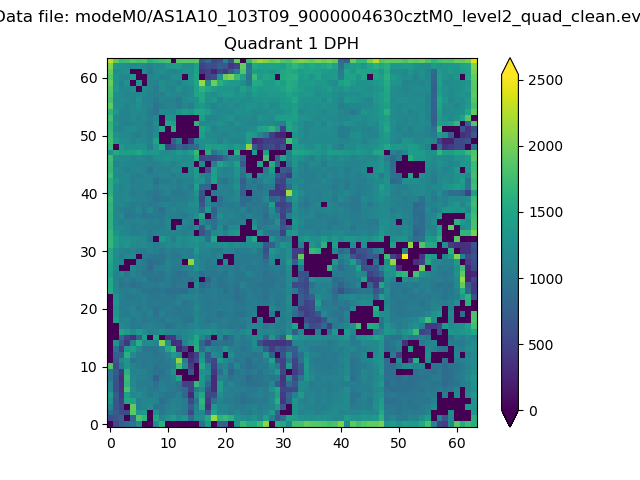 |
Quadrant B |
|---|---|---|---|
| Quadrant D | 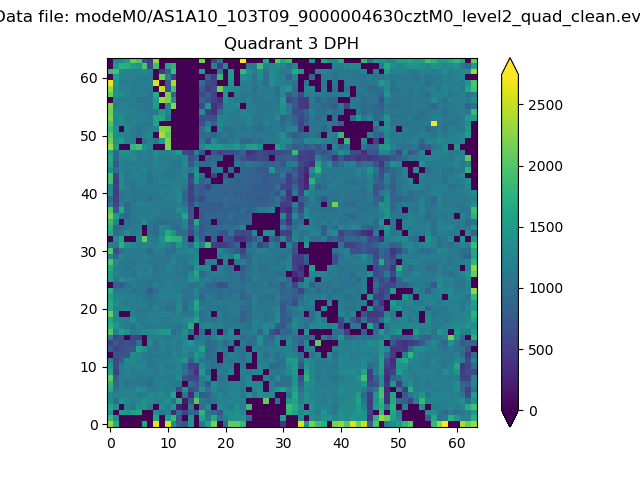 |
 |
Quadrant C |
| Plot type | Count rate plots | Images |
|---|---|---|
| Comparison with Poisson distribution Blue bars denote a histogram of data divided into 1 sec bins. Red curve is a Poisson curve with rate = median count rate of data. |
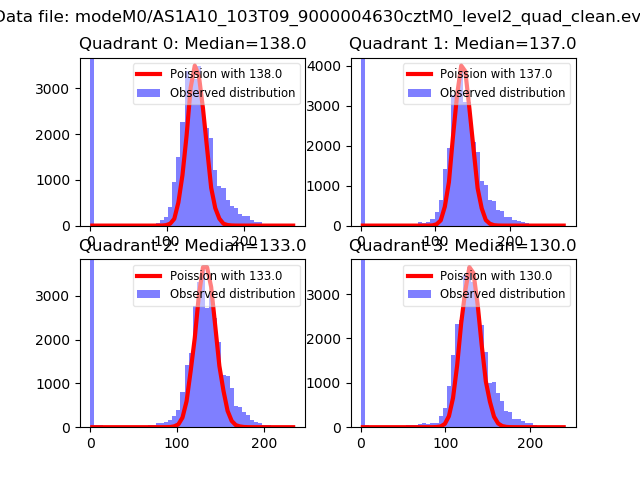 |
 |
| Quadrant-wise count rates Data is divided into 100 sec bins |
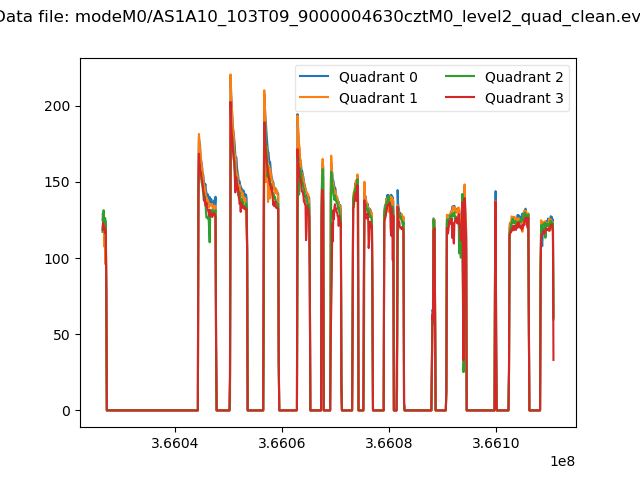 |
|
| Module-wise count rates for Quadrant A Data is divided into 100 sec bins |
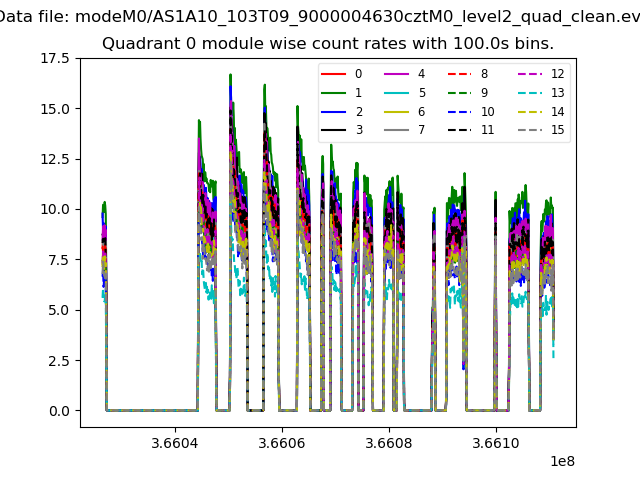 |
 |
| Module-wise count rates for Quadrant B Data is divided into 100 sec bins |
 |
 |
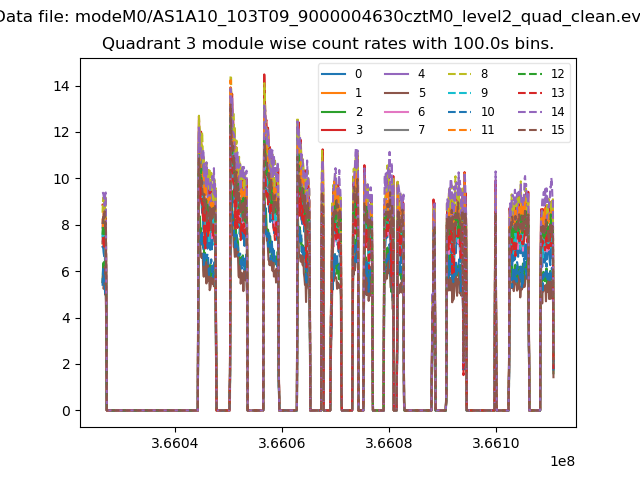
| Module-wise count rates for Quadrant C Data is divided into 100 sec bins |
 |
 |
| Module-wise count rates for Quadrant D Data is divided into 100 sec bins |
 |
 |
| Parameter | Plot |
|---|---|
| CZT HV Monitor | 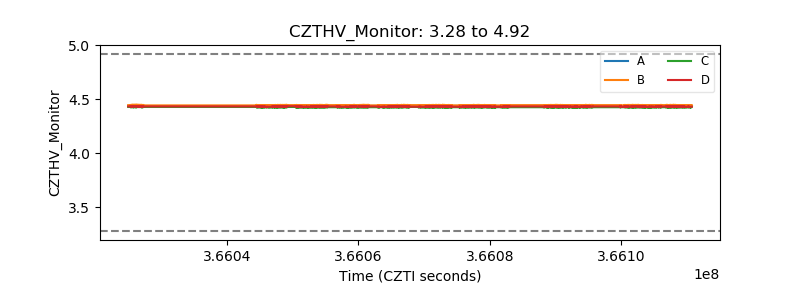 |
| D_VDD | 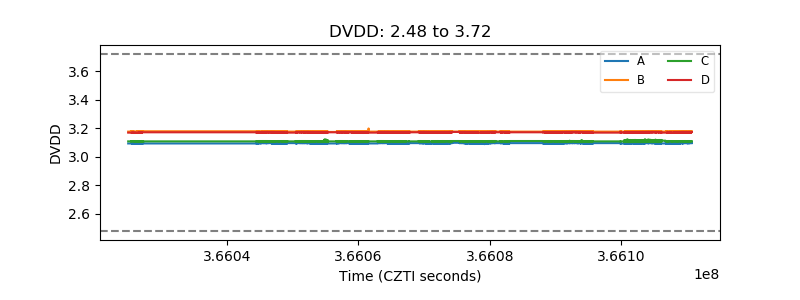 |
| Temperature 1 | 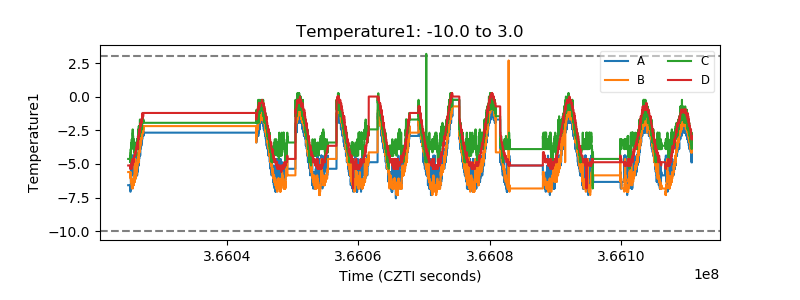 |
| Veto HV Monitor | 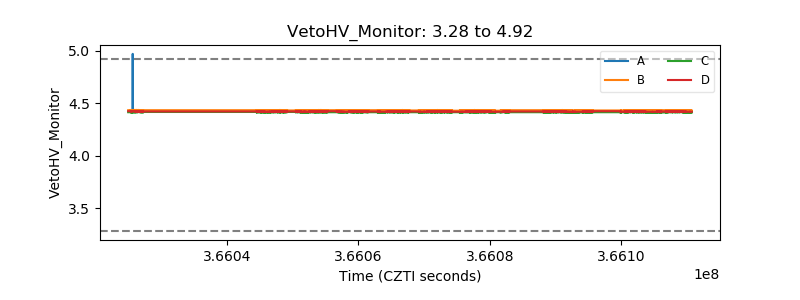 |
| Veto LLD | 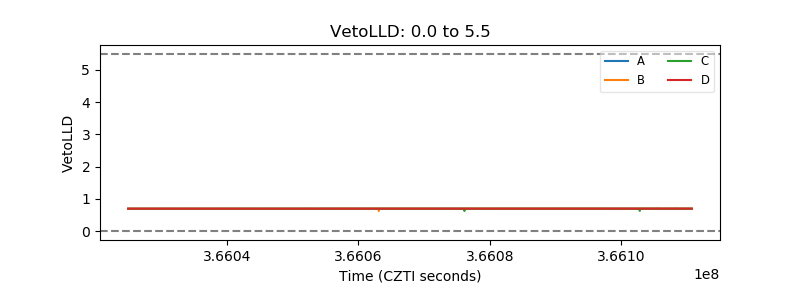 |
| Alpha Counter | 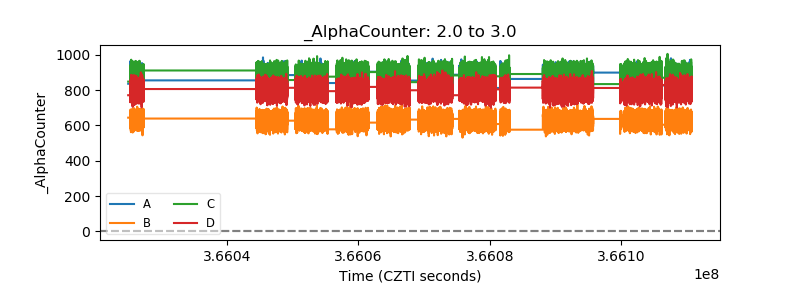 |
| _CPM_Rate | 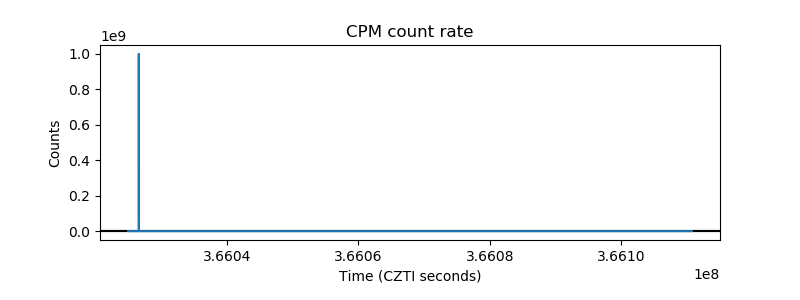 |
| CZT Counter | 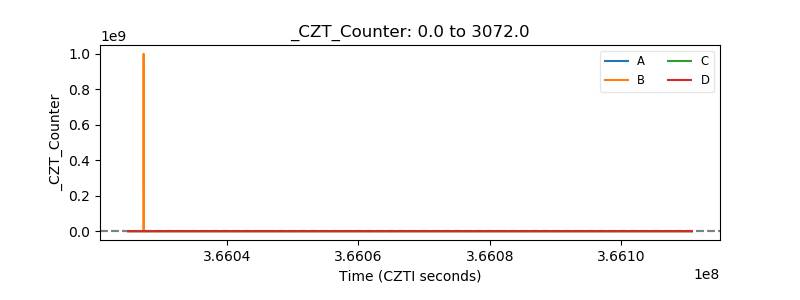 |
| +2.5 Volts monitor | 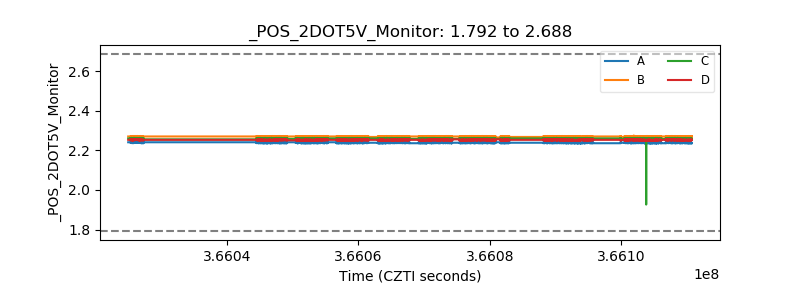 |
| +5 Volts monitor | 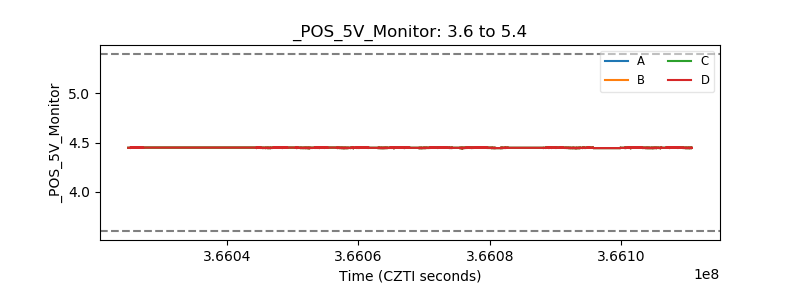 |
| _ROLL_ROT | 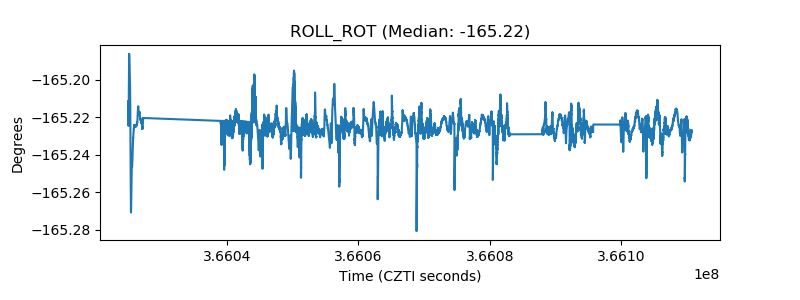 |
| _Roll_DEC | 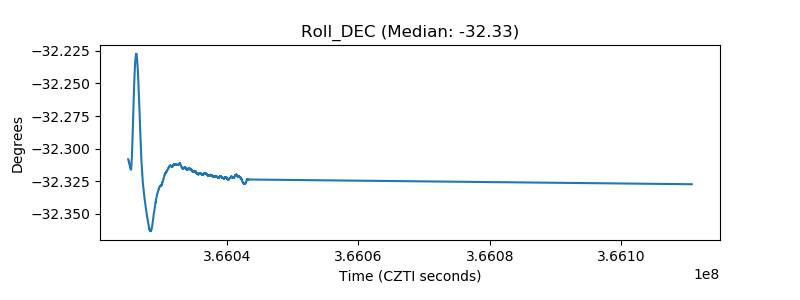 |
| _Roll_RA | 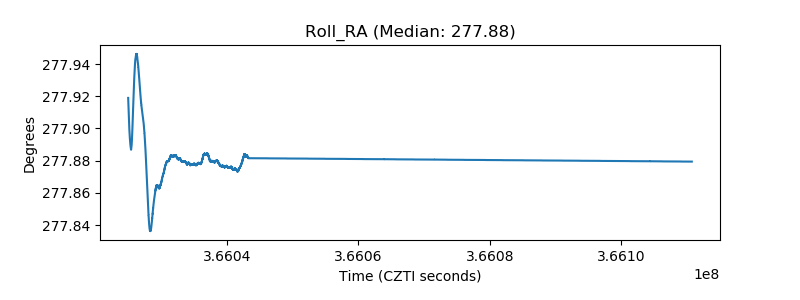 |
| Veto Counter | 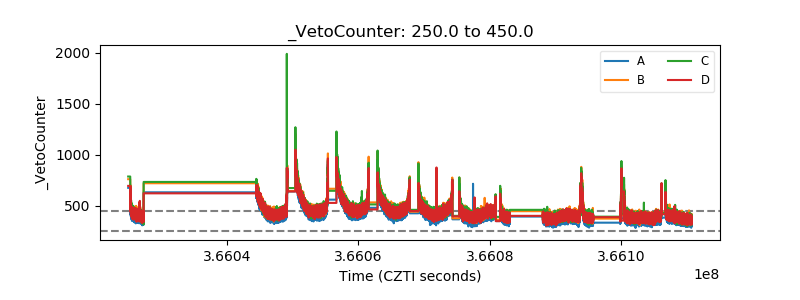 |