| Param | Original file | Final file |
|---|---|---|
| Filename | modeM0/AS1A10_103T09_9000004630_31683cztM0_level2.evt | modeM0/AS1A10_103T09_9000004630_31683cztM0_level2_quad_clean.evt |
| Size (bytes) | 201,801,600 | 40,898,880 |
| Size | 192.5 MB | 39.0 MB |
| Events in quadrant A | 1,008,702 | 285,490 |
| Events in quadrant B | 1,750,532 | 277,781 |
| Events in quadrant C | 1,860,015 | 262,781 |
| Events in quadrant D | 1,355,305 | 267,255 |
| Mode M9 | |||
|---|---|---|---|
| Quadrant | BADHDUFLAG | Total packets | Discarded packets |
| A | 1 | 139781875350312 | 46 |
| B | 1 | -1 | -1 |
| C | 1 | -1 | -1 |
| D | 1 | -1 | -1 |
| Mode M0 | |||
|---|---|---|---|
| Quadrant | BADHDUFLAG | Total packets | Discarded packets |
| A | 0 | 5628 | 1431 |
| B | 0 | 8841 | 2368 |
| C | 0 | 9456 | 2472 |
| D | 0 | 7199 | 1676 |
| Mode SS | |||
|---|---|---|---|
| Quadrant | BADHDUFLAG | Total packets | Discarded packets |
| A | 0 | 54 | 14 |
| B | 0 | 55 | 13 |
| C | 0 | 55 | 13 |
| D | 0 | 56 | 14 |
| Quadrant | Total seconds | Saturated seconds | Saturation percentage |
|---|---|---|---|
| A | 2007 | 7 | 0.348779% |
| B | 1981 | 51 | 2.574457% |
| C | 1965 | 66 | 3.358779% |
| D | 1997 | 21 | 1.051577% |
Noise dominated data is calculated using 1-second bins in cleaned event files. If a bin has >2000 counts, and if more than 50% of those come from <1% of pixels, then it is considered to be noise-dominated and hence unusable.
| Quadrant | # 1 sec bins | Bins with >0 counts | Bins with >2000 counts | High rate bins dominated by noise | Noise dominated (total time) | Noise dominated (detector-on time) | Marked lightcurve |
|---|---|---|---|---|---|---|---|
| A | 2287 | 2051 | 0 | 0 | 0.00% | 0.00% | 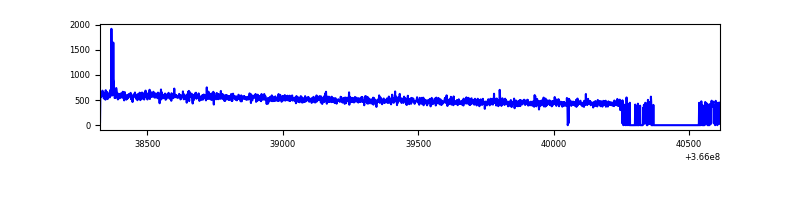 |
| B | 2281 | 2020 | 36 | 36 | 1.58% | 1.78% | 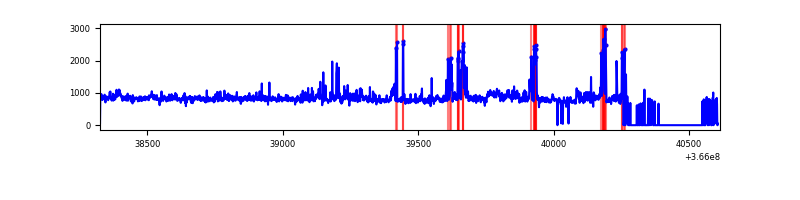 |
| C | 2283 | 1998 | 25 | 25 | 1.10% | 1.25% | 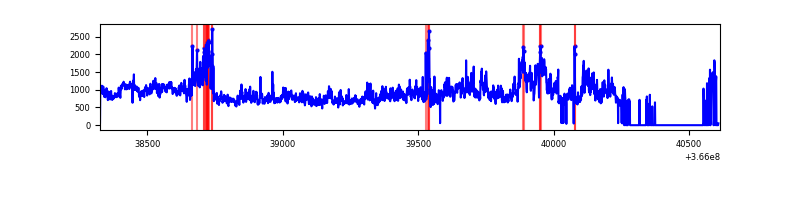 |
| D | 2288 | 2039 | 20 | 20 | 0.87% | 0.98% | 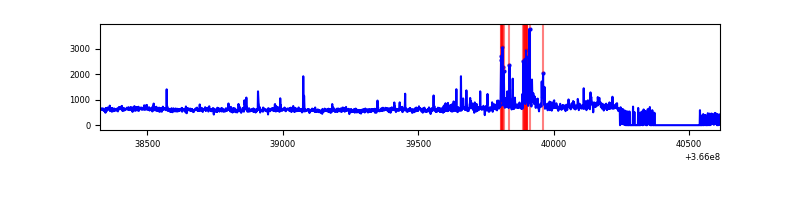 |
Top three noisy pixels from each quadrant. If the there are fewer than three noisy pixels in the level2.evt file, extra rows are filled as -1
| Pixel properties | Quadrant properties | ||||||
|---|---|---|---|---|---|---|---|
| Quadrant | DetID | PixID | Counts | Sigma | Mean | Median | Sigma |
| A | 12 | 96 | 6049 | 108.03 | 259 | 254 | 53.6 |
| A | 13 | 254 | 4140 | 72.44 | 259 | 254 | 53.6 |
| A | 3 | 137 | 2496 | 41.79 | 259 | 254 | 53.6 |
| B | 6 | 159 | 525803 | 10775.17 | 246 | 241 | 48.8 |
| B | 4 | 80 | 148684 | 3043.41 | 246 | 241 | 48.8 |
| B | 0 | 229 | 35352 | 719.85 | 246 | 241 | 48.8 |
| C | 3 | 233 | 692821 | 12389.25 | 233 | 234 | 55.9 |
| C | 10 | 22 | 174454 | 3116.51 | 233 | 234 | 55.9 |
| C | 14 | 238 | 37579 | 668.04 | 233 | 234 | 55.9 |
| D | 8 | 195 | 325309 | 5478.04 | 246 | 240 | 59.3 |
| D | 13 | 249 | 67792 | 1138.38 | 246 | 240 | 59.3 |
| D | 2 | 120 | 8961 | 146.97 | 246 | 240 | 59.3 |
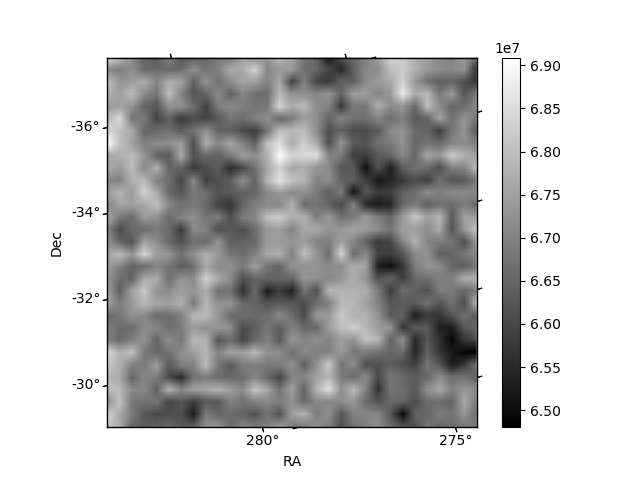
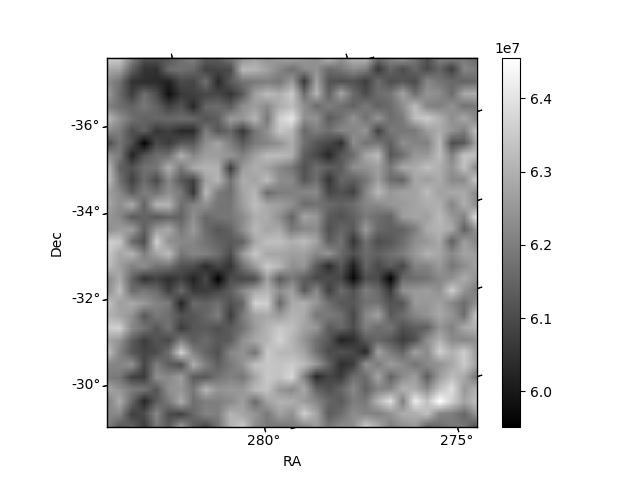
Histogram calculated using DETX and DETY for each event in the final _common_clean file
| Quadrant A | 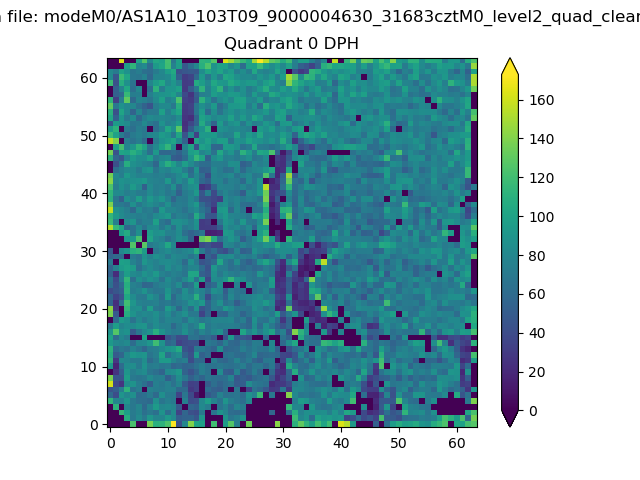 |
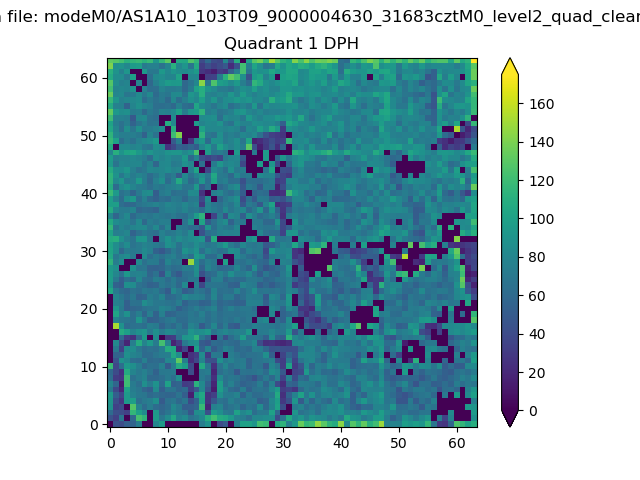 |
Quadrant B |
|---|---|---|---|
| Quadrant D | 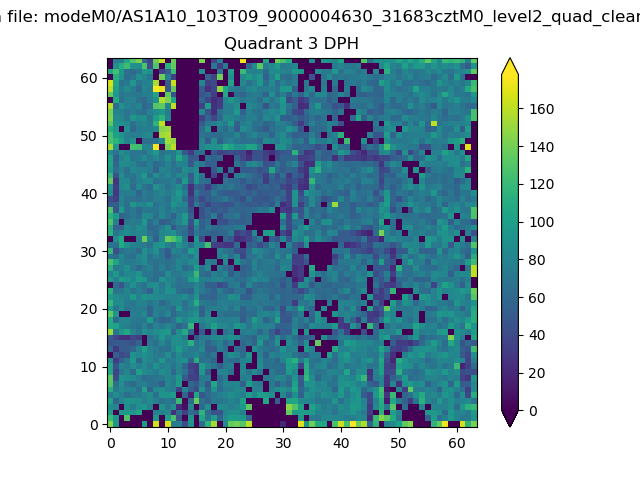 |
 |
Quadrant C |
| Plot type | Count rate plots | Images |
|---|---|---|
| Comparison with Poisson distribution Blue bars denote a histogram of data divided into 1 sec bins. Red curve is a Poisson curve with rate = median count rate of data. |
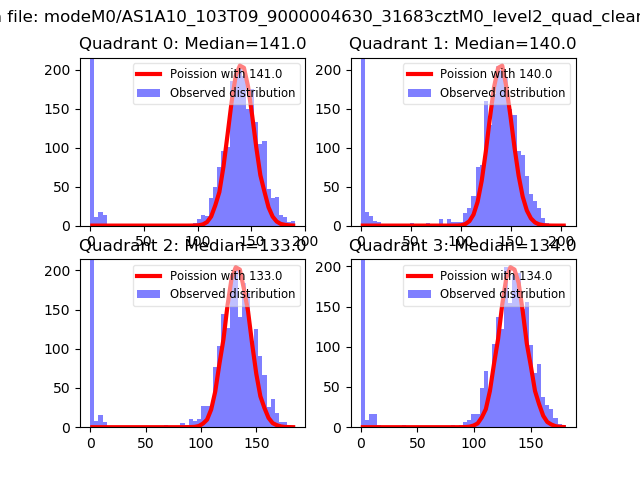 |
 |
| Quadrant-wise count rates Data is divided into 100 sec bins |
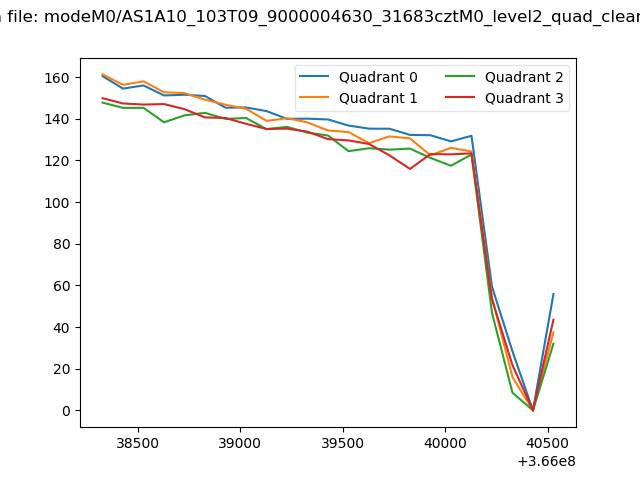 |
|
| Module-wise count rates for Quadrant A Data is divided into 100 sec bins |
 |
 |
| Module-wise count rates for Quadrant B Data is divided into 100 sec bins |
 |
 |
| Module-wise count rates for Quadrant C Data is divided into 100 sec bins |
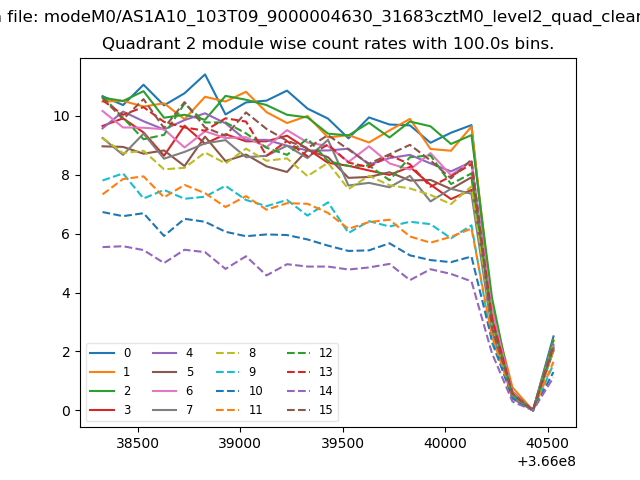 |
 |
| Module-wise count rates for Quadrant D Data is divided into 100 sec bins |
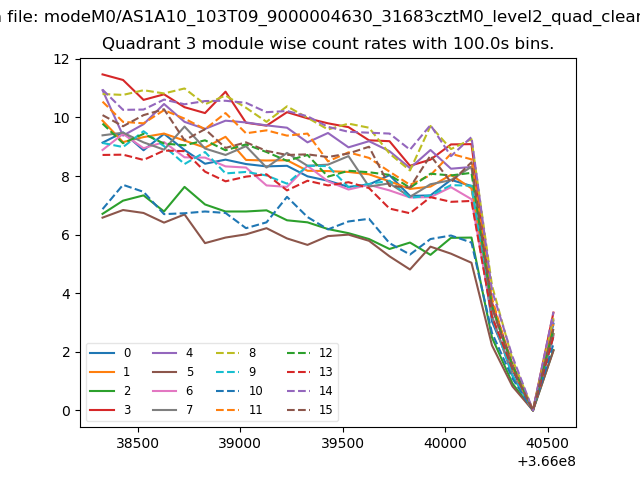 |
 |
| Parameter | Plot |
|---|---|
| CZT HV Monitor | 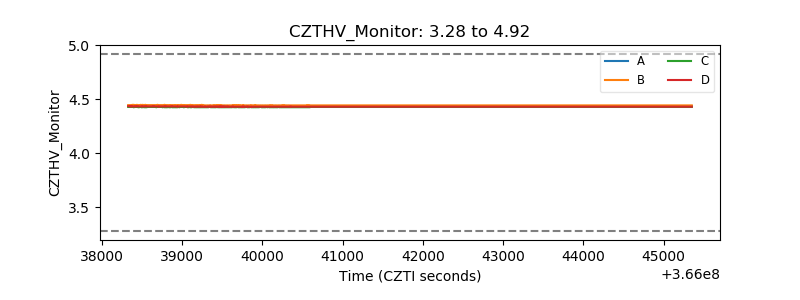 |
| D_VDD | 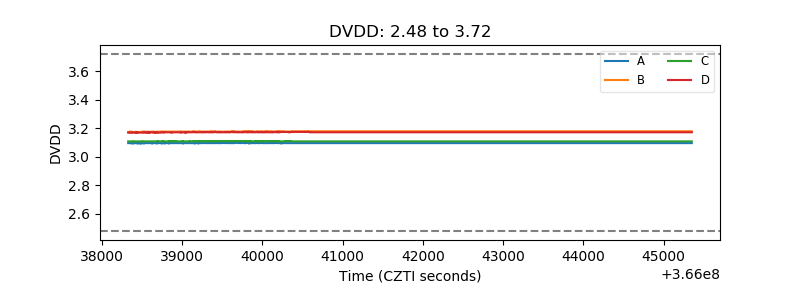 |
| Temperature 1 | 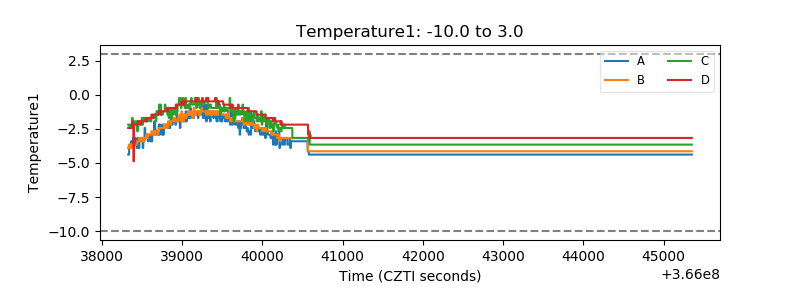 |
| Veto HV Monitor | 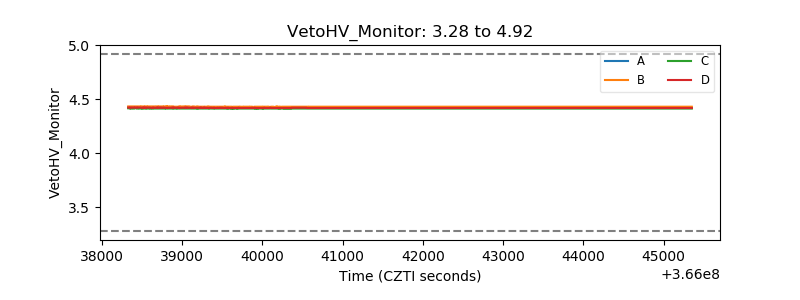 |
| Veto LLD | 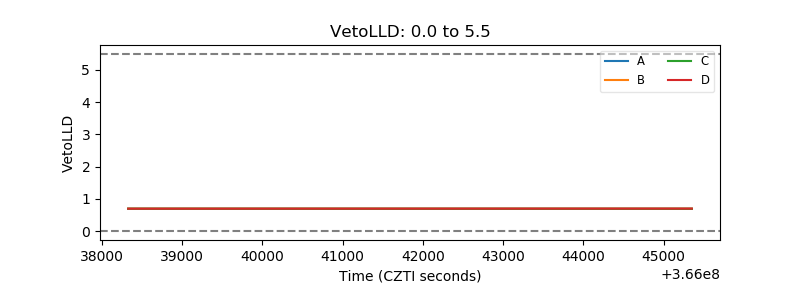 |
| Alpha Counter |  |
| _CPM_Rate | 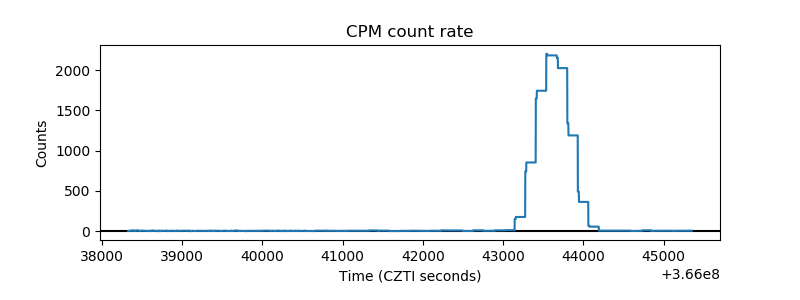 |
| CZT Counter |  |
| +2.5 Volts monitor |  |
| +5 Volts monitor |  |
| _ROLL_ROT | 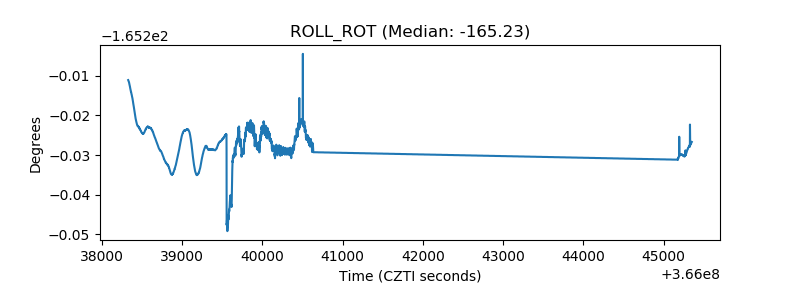 |
| _Roll_DEC | 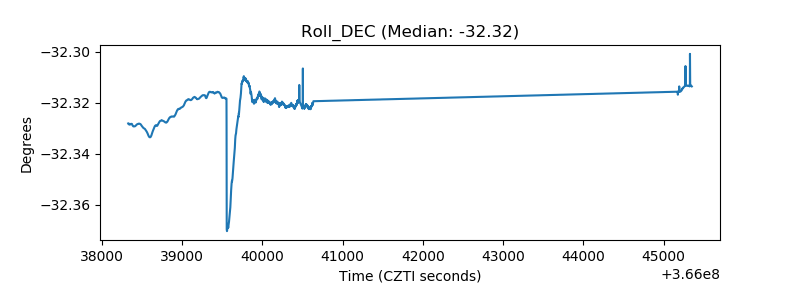 |
| _Roll_RA |  |
| Veto Counter | 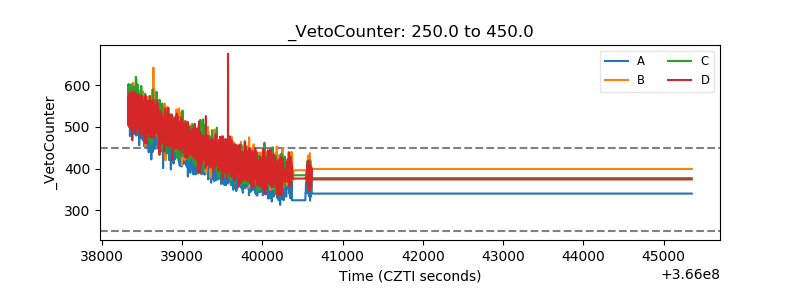 |