| Param | Original file | Final file |
|---|---|---|
| Filename | modeM0/AS1A10_103T09_9000004630_31684cztM0_level2.evt | modeM0/AS1A10_103T09_9000004630_31684cztM0_level2_quad_clean.evt |
| Size (bytes) | 798,180,480 | 128,252,160 |
| Size | 761.2 MB | 122.3 MB |
| Events in quadrant A | 4,338,453 | 862,369 |
| Events in quadrant B | 7,447,792 | 847,598 |
| Events in quadrant C | 7,130,508 | 790,608 |
| Events in quadrant D | 4,696,411 | 806,984 |
| Mode M9 | |||
|---|---|---|---|
| Quadrant | BADHDUFLAG | Total packets | Discarded packets |
| A | 0 | 16 | 0 |
| B | 0 | 16 | 0 |
| C | 0 | 16 | 0 |
| D | 0 | 16 | 0 |
| Mode M0 | |||
|---|---|---|---|
| Quadrant | BADHDUFLAG | Total packets | Discarded packets |
| A | 0 | 18226 | 5 |
| B | 0 | 27581 | 2 |
| C | 0 | 26924 | 2 |
| D | 0 | 19240 | 2 |
| Mode SS | |||
|---|---|---|---|
| Quadrant | BADHDUFLAG | Total packets | Discarded packets |
| A | 0 | 168 | 0 |
| B | 0 | 168 | 0 |
| C | 0 | 168 | 0 |
| D | 0 | 168 | 0 |
| Quadrant | Total seconds | Saturated seconds | Saturation percentage |
|---|---|---|---|
| A | 8297 | 86 | 1.036519% |
| B | 8299 | 364 | 4.386071% |
| C | 8299 | 603 | 7.265936% |
| D | 8299 | 99 | 1.192915% |
Noise dominated data is calculated using 1-second bins in cleaned event files. If a bin has >2000 counts, and if more than 50% of those come from <1% of pixels, then it is considered to be noise-dominated and hence unusable.
| Quadrant | # 1 sec bins | Bins with >0 counts | Bins with >2000 counts | High rate bins dominated by noise | Noise dominated (total time) | Noise dominated (detector-on time) | Marked lightcurve |
|---|---|---|---|---|---|---|---|
| A | 26678 | 8299 | 2 | 2 | 0.01% | 0.02% | 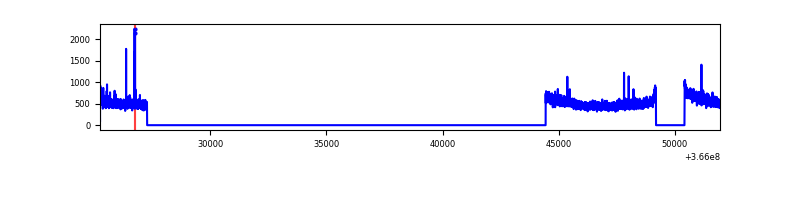 |
| B | 26678 | 8301 | 142 | 142 | 0.53% | 1.71% | 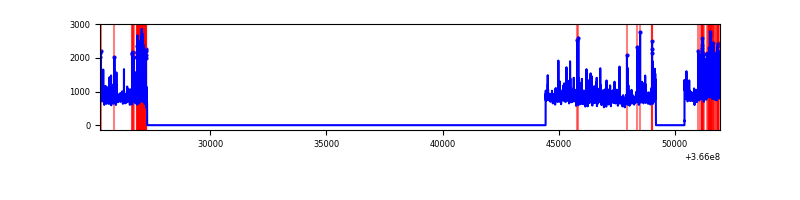 |
| C | 26678 | 8301 | 186 | 186 | 0.70% | 2.24% | 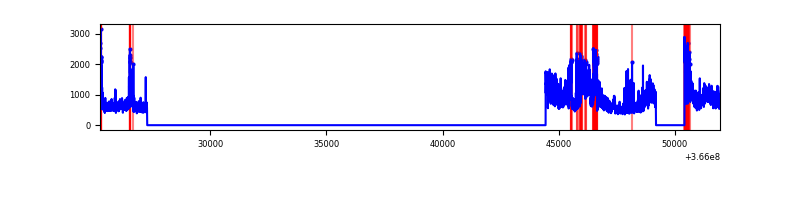 |
| D | 26678 | 8301 | 36 | 36 | 0.13% | 0.43% | 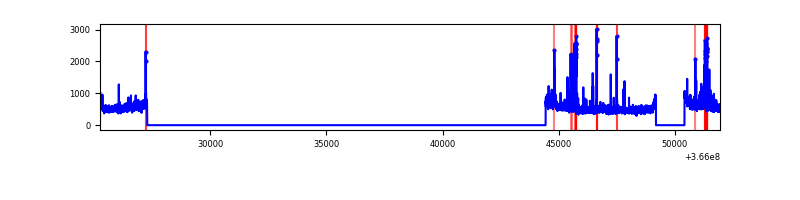 |
Top three noisy pixels from each quadrant. If the there are fewer than three noisy pixels in the level2.evt file, extra rows are filled as -1
| Pixel properties | Quadrant properties | ||||||
|---|---|---|---|---|---|---|---|
| Quadrant | DetID | PixID | Counts | Sigma | Mean | Median | Sigma |
| A | 0 | 13 | 60311 | 269.81 | 1103 | 1084 | 219.5 |
| A | 13 | 254 | 15253 | 64.55 | 1103 | 1084 | 219.5 |
| A | 3 | 1 | 12472 | 51.88 | 1103 | 1084 | 219.5 |
| B | 6 | 159 | 2242818 | 11104.87 | 1072 | 1047 | 201.9 |
| B | 4 | 80 | 495477 | 2449.22 | 1072 | 1047 | 201.9 |
| B | 10 | 245 | 194363 | 957.61 | 1072 | 1047 | 201.9 |
| C | 3 | 233 | 2474619 | 10491.22 | 1015 | 1021 | 235.8 |
| C | 0 | 10 | 341185 | 1442.73 | 1015 | 1021 | 235.8 |
| C | 14 | 238 | 166971 | 703.84 | 1015 | 1021 | 235.8 |
| D | 8 | 195 | 412803 | 1641.76 | 1059 | 1031 | 250.8 |
| D | 13 | 249 | 154424 | 611.59 | 1059 | 1031 | 250.8 |
| D | 10 | 203 | 41006 | 159.38 | 1059 | 1031 | 250.8 |
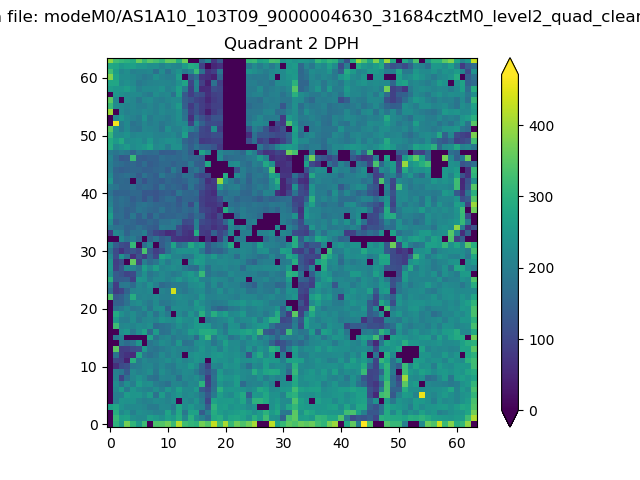
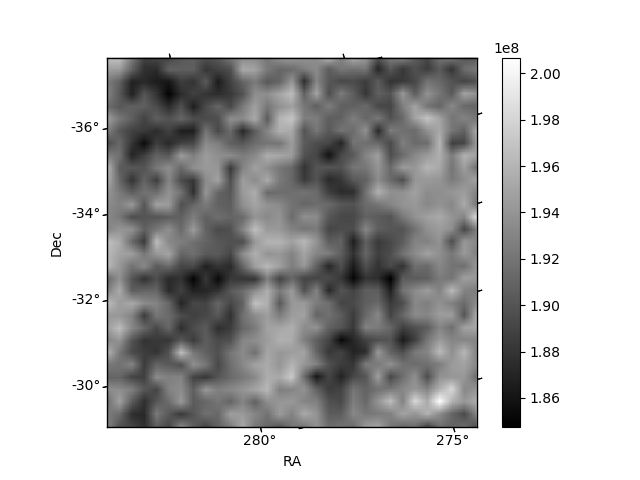
Histogram calculated using DETX and DETY for each event in the final _common_clean file
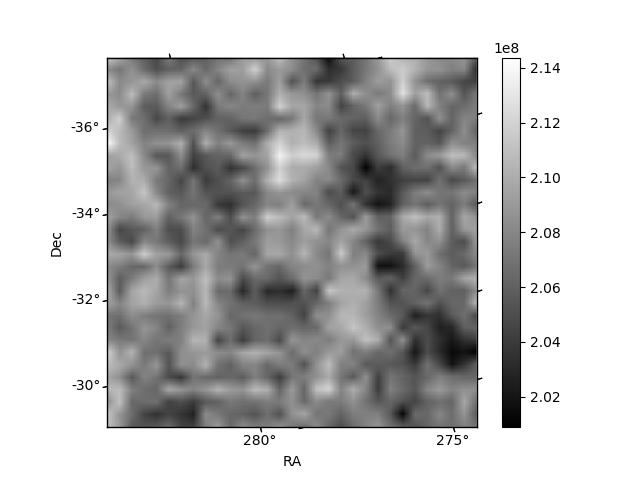
| Quadrant A | 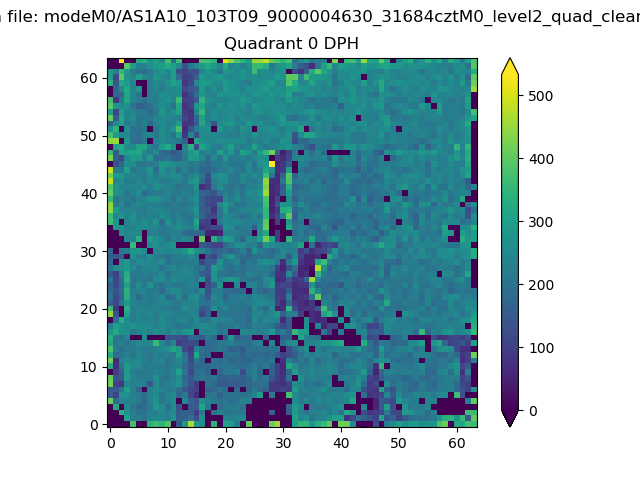 |
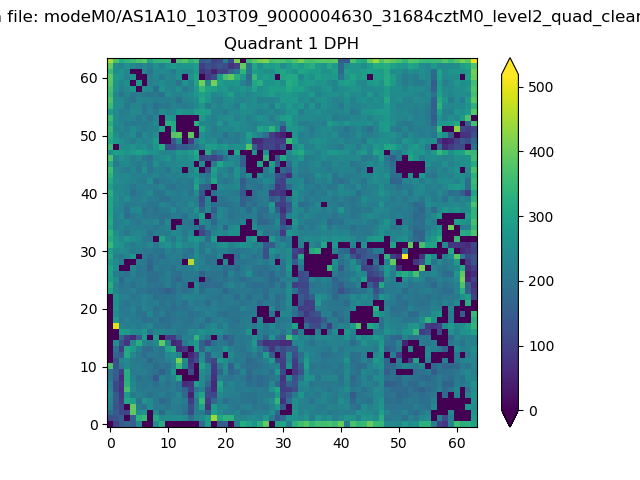 |
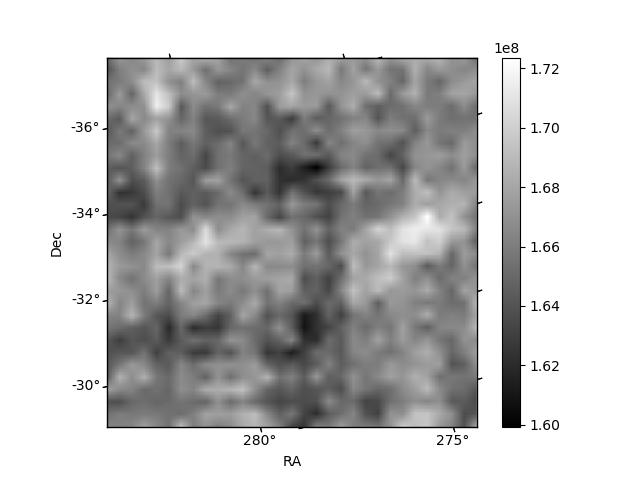
Quadrant B |
|---|---|---|---|
| Quadrant D | 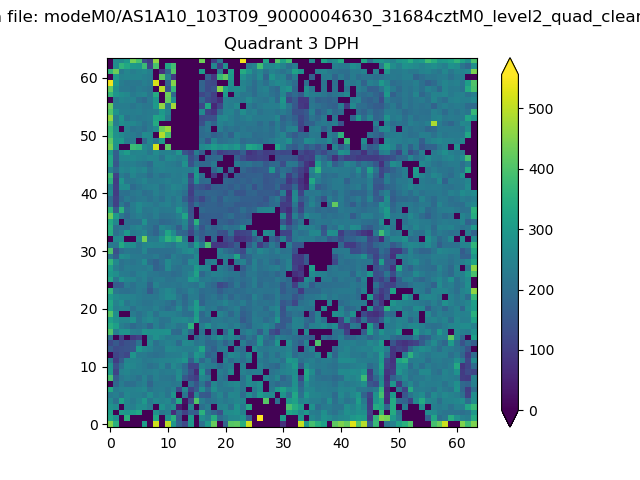 |
 |
Quadrant C |
| Plot type | Count rate plots | Images |
|---|---|---|
| Comparison with Poisson distribution Blue bars denote a histogram of data divided into 1 sec bins. Red curve is a Poisson curve with rate = median count rate of data. |
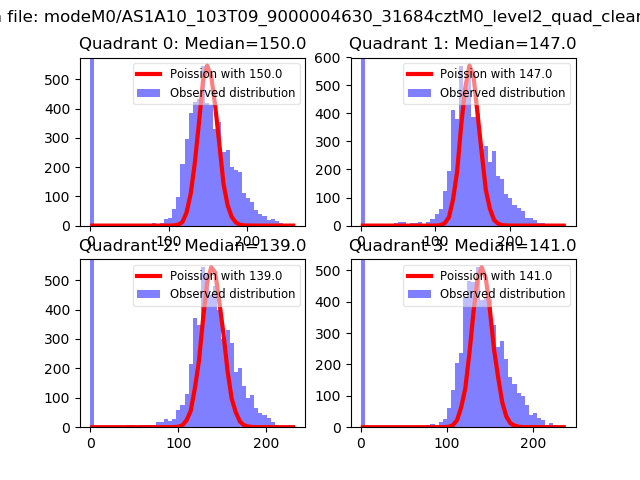 |
 |
| Quadrant-wise count rates Data is divided into 100 sec bins |
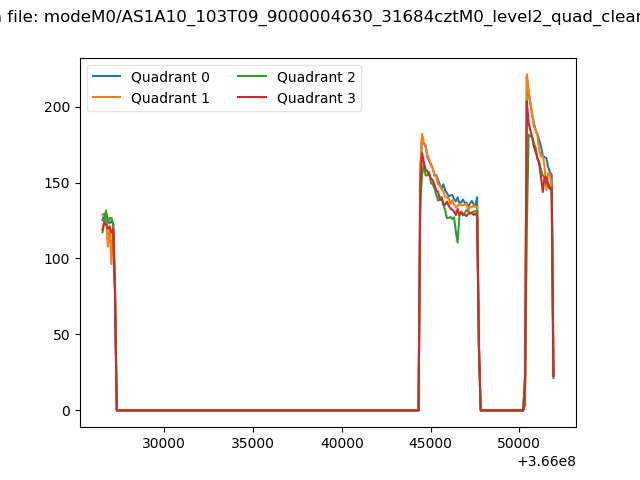 |
|
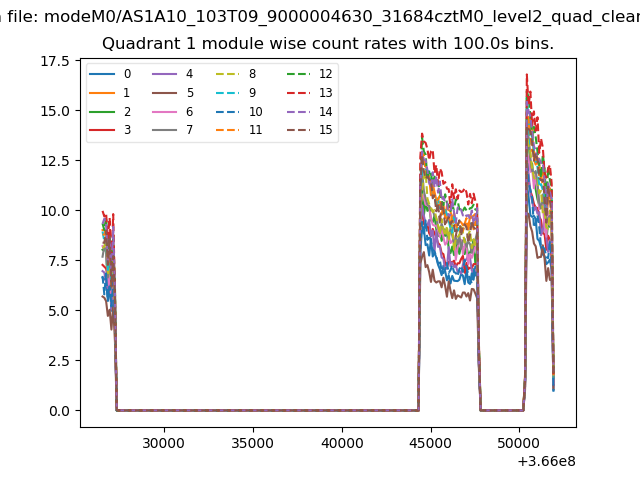
| Module-wise count rates for Quadrant A Data is divided into 100 sec bins |
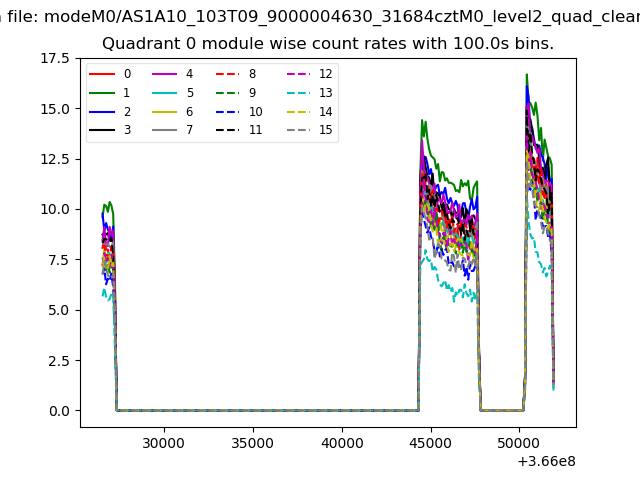 |
 |
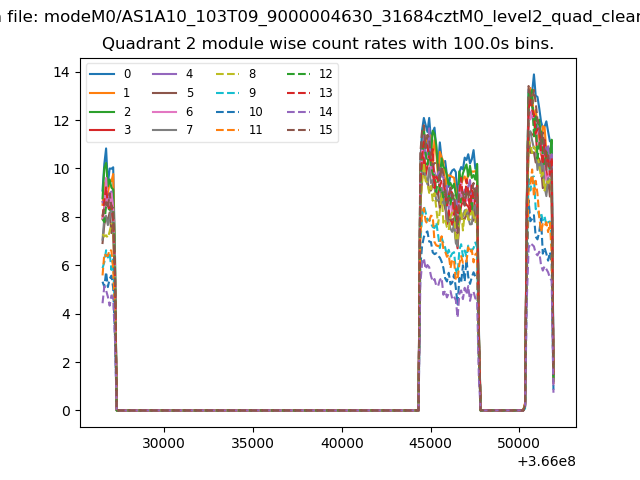
| Module-wise count rates for Quadrant B Data is divided into 100 sec bins |
 |
 |
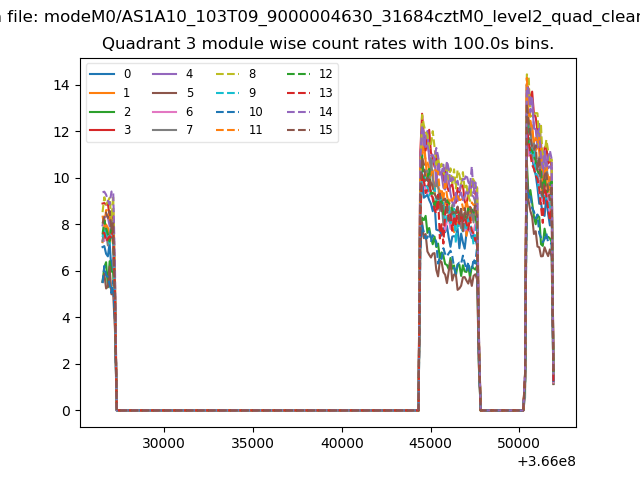
| Module-wise count rates for Quadrant C Data is divided into 100 sec bins |
 |
 |
| Module-wise count rates for Quadrant D Data is divided into 100 sec bins |
 |
 |
| Parameter | Plot |
|---|---|
| CZT HV Monitor | 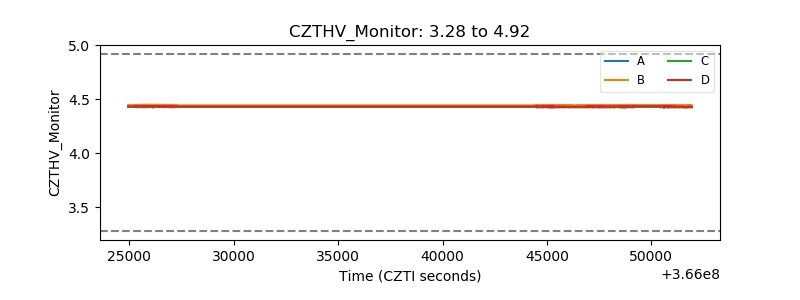 |
| D_VDD | 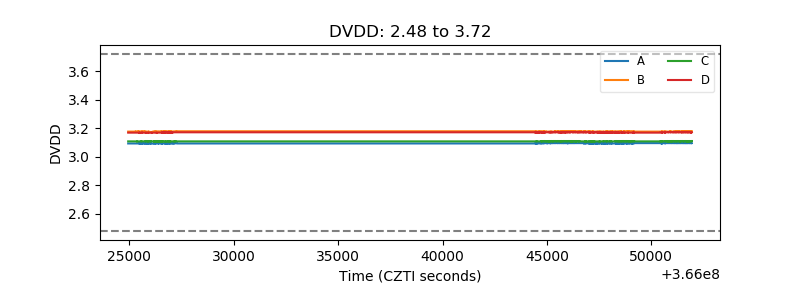 |
| Temperature 1 | 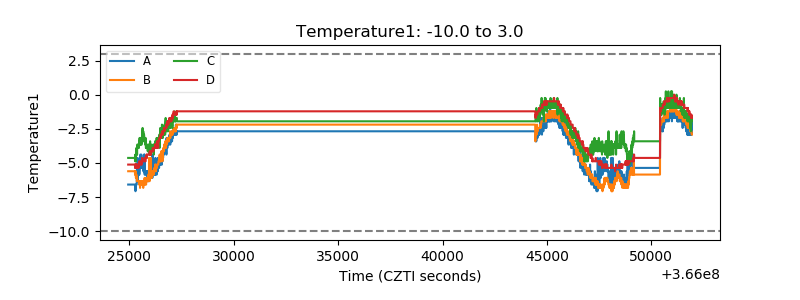 |
| Veto HV Monitor | 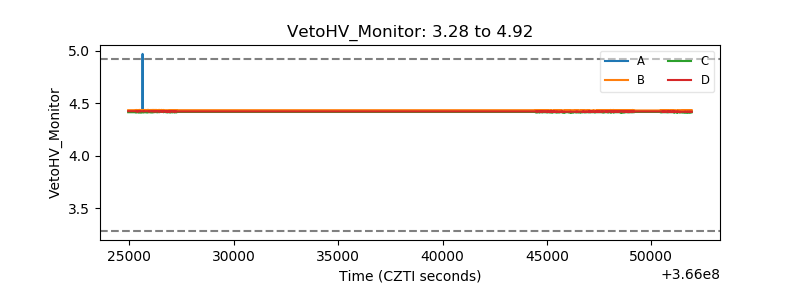 |
| Veto LLD | 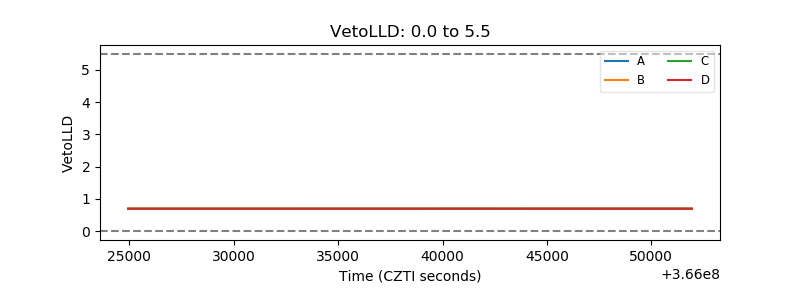 |
| Alpha Counter | 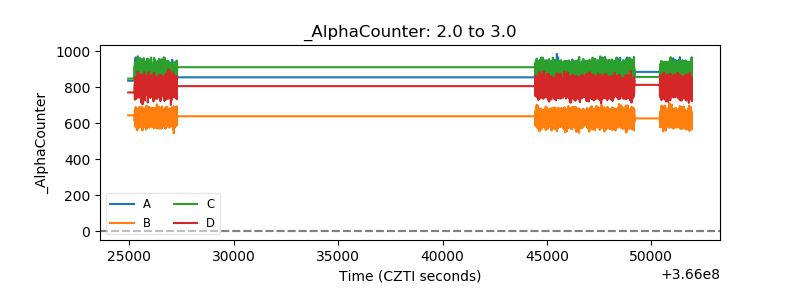 |
| _CPM_Rate | 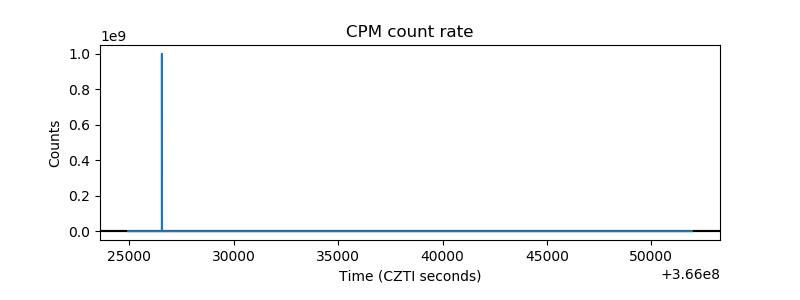 |
| CZT Counter | 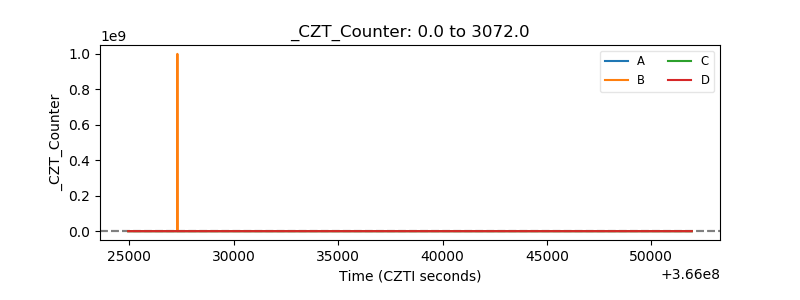 |
| +2.5 Volts monitor |  |
| +5 Volts monitor | 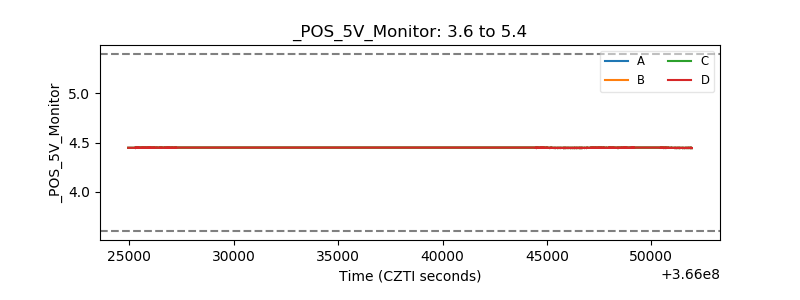 |
| _ROLL_ROT | 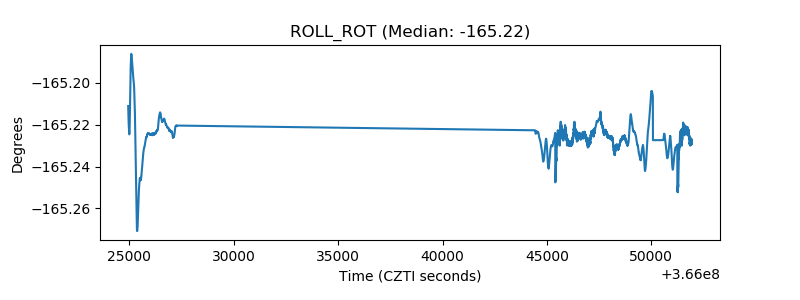 |
| _Roll_DEC | 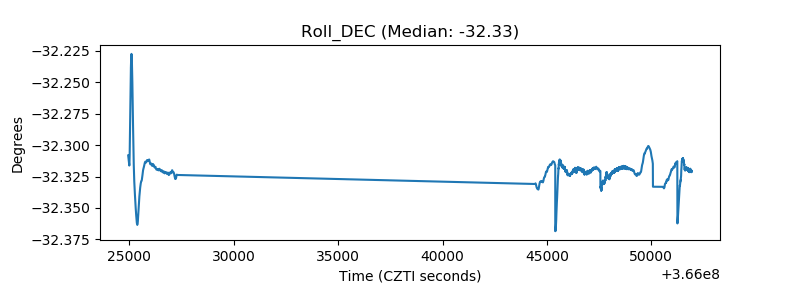 |
| _Roll_RA |  |
| Veto Counter | 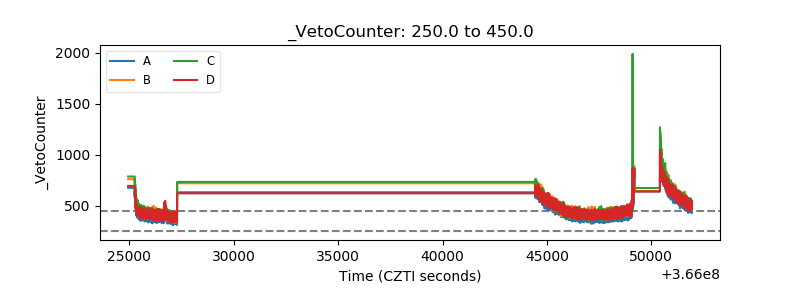 |