| Param | Original file | Final file |
|---|---|---|
| Filename | modeM0/AS1A10_103T09_9000004630_31686cztM0_level2.evt | modeM0/AS1A10_103T09_9000004630_31686cztM0_level2_quad_clean.evt |
| Size (bytes) | 572,817,600 | 93,695,040 |
| Size | 546.3 MB | 89.4 MB |
| Events in quadrant A | 3,162,789 | 632,475 |
| Events in quadrant B | 5,825,786 | 615,462 |
| Events in quadrant C | 4,288,768 | 583,524 |
| Events in quadrant D | 3,661,258 | 583,220 |
| Mode M9 | |||
|---|---|---|---|
| Quadrant | BADHDUFLAG | Total packets | Discarded packets |
| A | 0 | 13 | 0 |
| B | 0 | 13 | 0 |
| C | 0 | 13 | 0 |
| D | 0 | 13 | 0 |
| Mode M0 | |||
|---|---|---|---|
| Quadrant | BADHDUFLAG | Total packets | Discarded packets |
| A | 0 | 13110 | 1 |
| B | 0 | 21498 | 2 |
| C | 0 | 16654 | 1 |
| D | 0 | 15084 | 1 |
| Mode SS | |||
|---|---|---|---|
| Quadrant | BADHDUFLAG | Total packets | Discarded packets |
| A | 0 | 124 | 0 |
| B | 0 | 124 | 0 |
| C | 0 | 124 | 0 |
| D | 0 | 124 | 0 |
| Quadrant | Total seconds | Saturated seconds | Saturation percentage |
|---|---|---|---|
| A | 6048 | 66 | 1.091270% |
| B | 6048 | 382 | 6.316138% |
| C | 6048 | 319 | 5.274471% |
| D | 6048 | 73 | 1.207011% |
Noise dominated data is calculated using 1-second bins in cleaned event files. If a bin has >2000 counts, and if more than 50% of those come from <1% of pixels, then it is considered to be noise-dominated and hence unusable.
| Quadrant | # 1 sec bins | Bins with >0 counts | Bins with >2000 counts | High rate bins dominated by noise | Noise dominated (total time) | Noise dominated (detector-on time) | Marked lightcurve |
|---|---|---|---|---|---|---|---|
| A | 7403 | 6049 | 0 | 0 | 0.00% | 0.00% | 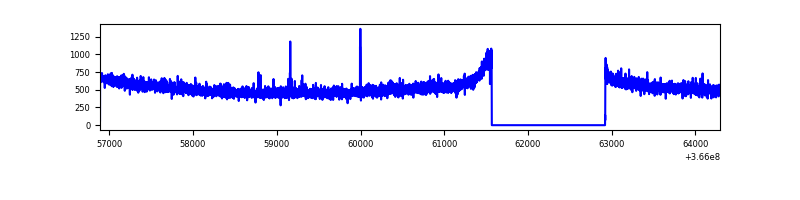 |
| B | 7403 | 6049 | 186 | 186 | 2.51% | 3.07% | 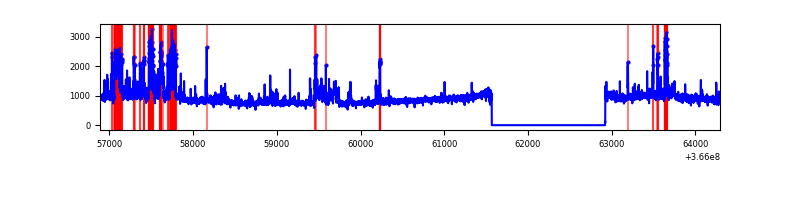 |
| C | 7403 | 6049 | 136 | 136 | 1.84% | 2.25% |  |
| D | 7403 | 6049 | 15 | 15 | 0.20% | 0.25% | 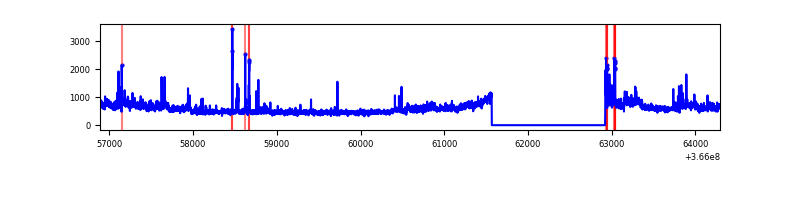 |
Top three noisy pixels from each quadrant. If the there are fewer than three noisy pixels in the level2.evt file, extra rows are filled as -1
| Pixel properties | Quadrant properties | ||||||
|---|---|---|---|---|---|---|---|
| Quadrant | DetID | PixID | Counts | Sigma | Mean | Median | Sigma |
| A | 0 | 13 | 19171 | 113.72 | 813 | 800 | 161.5 |
| A | 13 | 254 | 12093 | 69.9 | 813 | 800 | 161.5 |
| A | 3 | 137 | 7684 | 42.61 | 813 | 800 | 161.5 |
| B | 6 | 159 | 1781939 | 11918.6 | 793 | 776 | 149.4 |
| B | 10 | 245 | 542519 | 3625.06 | 793 | 776 | 149.4 |
| B | 4 | 80 | 174479 | 1162.33 | 793 | 776 | 149.4 |
| C | 3 | 233 | 802074 | 4598.37 | 750 | 756 | 174.3 |
| C | 0 | 10 | 267783 | 1532.34 | 750 | 756 | 174.3 |
| C | 14 | 238 | 124659 | 711.02 | 750 | 756 | 174.3 |
| D | 8 | 195 | 589024 | 3262.72 | 769 | 754 | 180.3 |
| D | 13 | 249 | 94944 | 522.4 | 769 | 754 | 180.3 |
| D | 2 | 234 | 28367 | 153.15 | 769 | 754 | 180.3 |
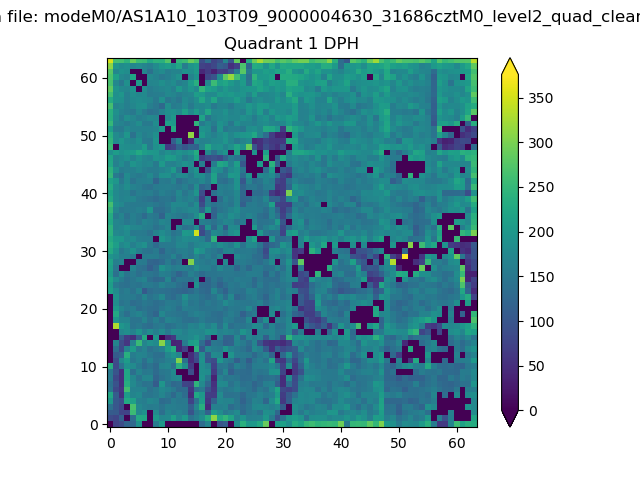
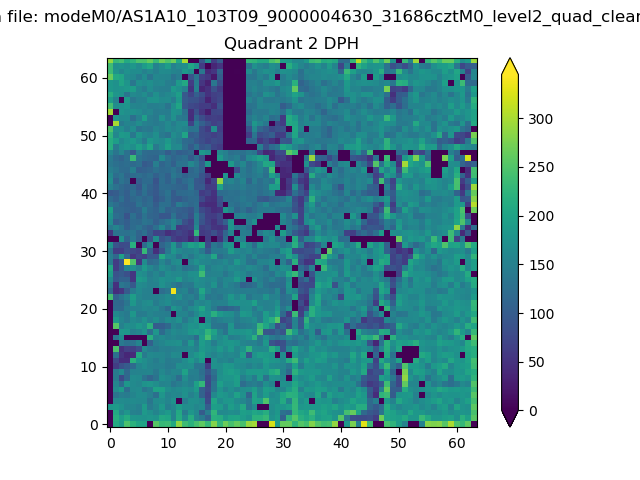
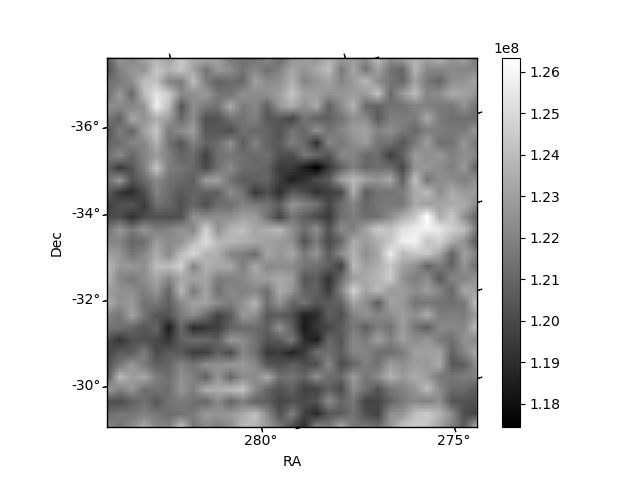
Histogram calculated using DETX and DETY for each event in the final _common_clean file
| Quadrant A |  |
 |
Quadrant B |
|---|---|---|---|
| Quadrant D | 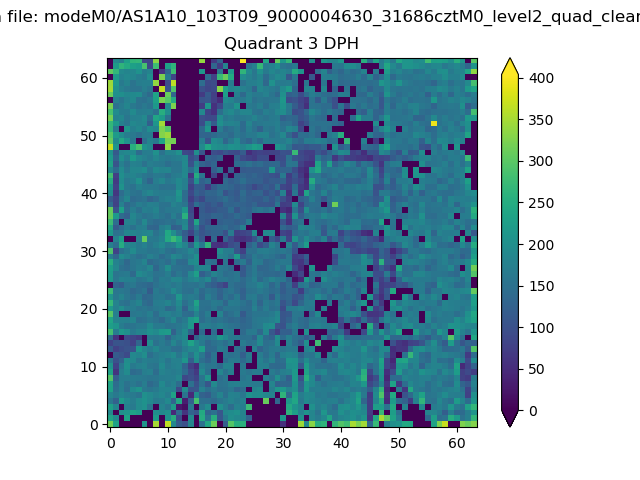 |
 |
Quadrant C |
| Plot type | Count rate plots | Images |
|---|---|---|
| Comparison with Poisson distribution Blue bars denote a histogram of data divided into 1 sec bins. Red curve is a Poisson curve with rate = median count rate of data. |
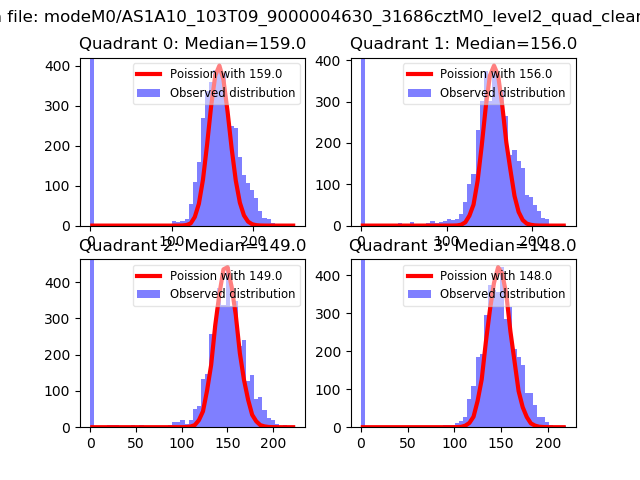 |
 |
| Quadrant-wise count rates Data is divided into 100 sec bins |
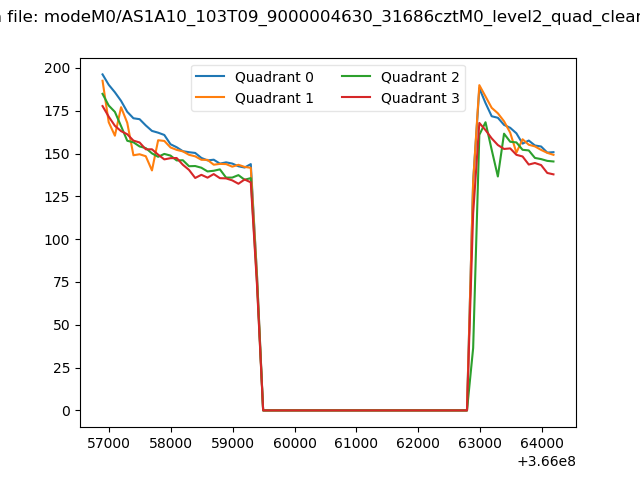 |
|
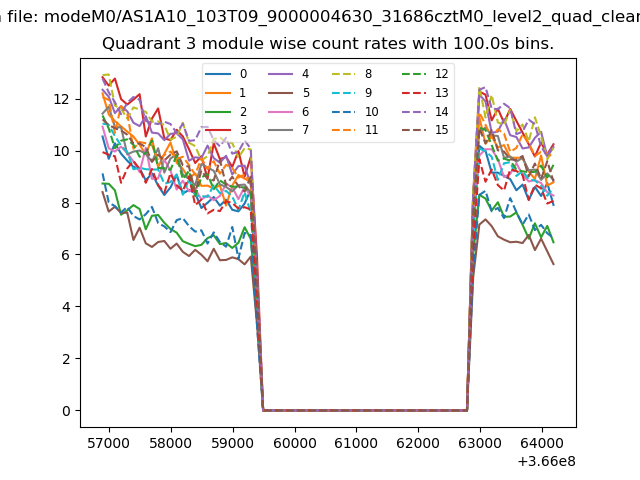
| Module-wise count rates for Quadrant A Data is divided into 100 sec bins |
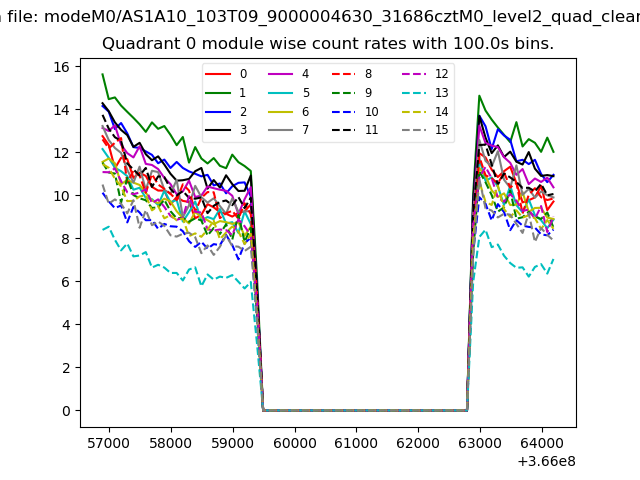 |
 |
| Module-wise count rates for Quadrant B Data is divided into 100 sec bins |
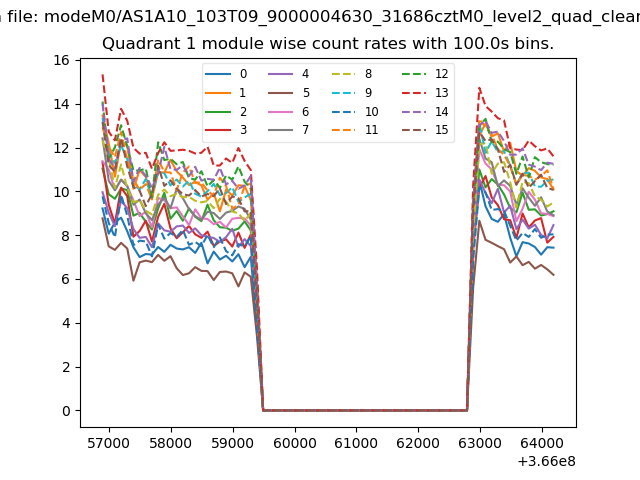 |
 |
| Module-wise count rates for Quadrant C Data is divided into 100 sec bins |
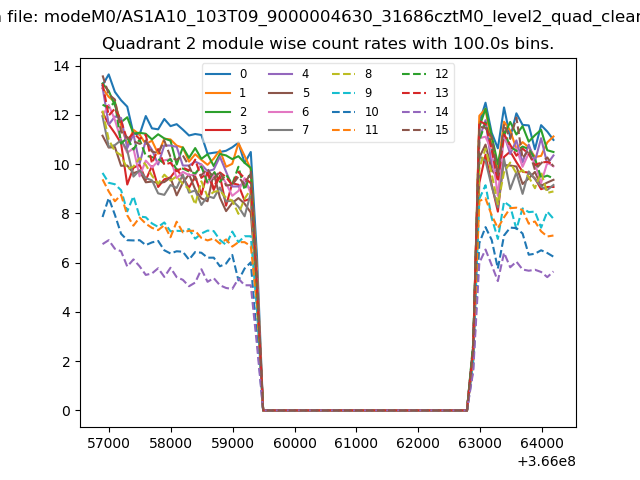 |
 |
| Module-wise count rates for Quadrant D Data is divided into 100 sec bins |
 |
 |
| Parameter | Plot |
|---|---|
| CZT HV Monitor | 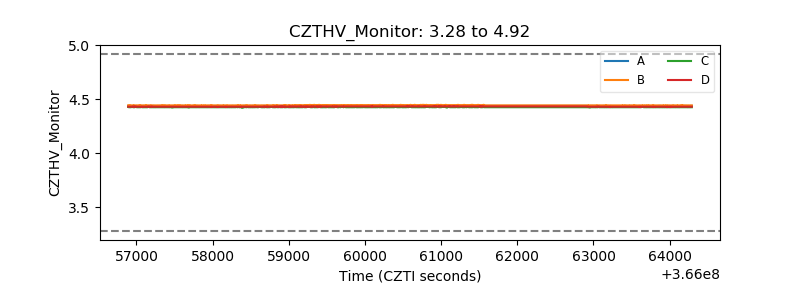 |
| D_VDD | 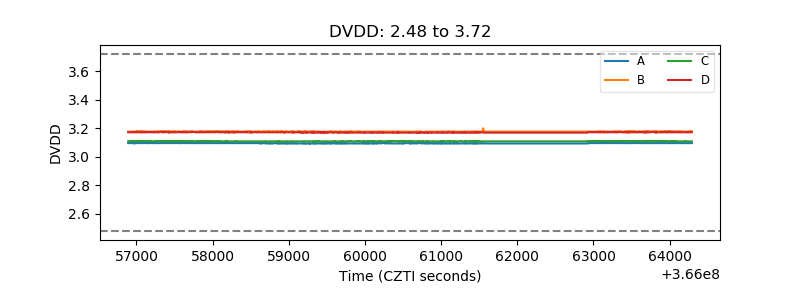 |
| Temperature 1 | 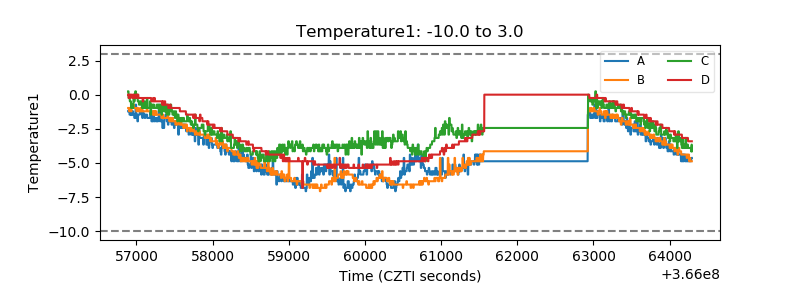 |
| Veto HV Monitor | 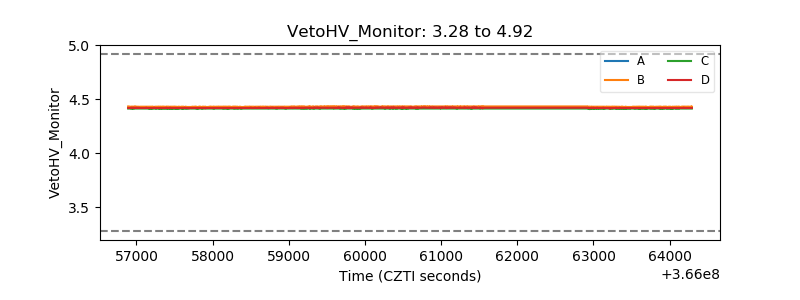 |
| Veto LLD | 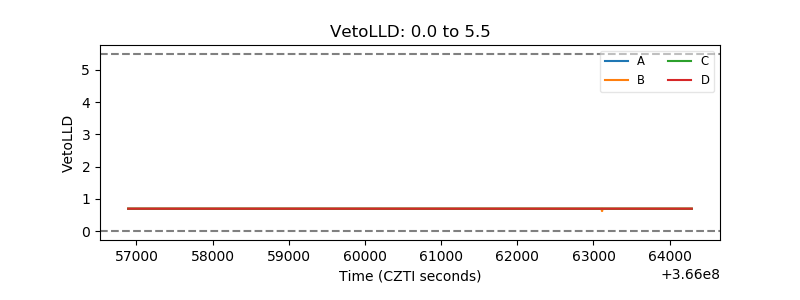 |
| Alpha Counter | 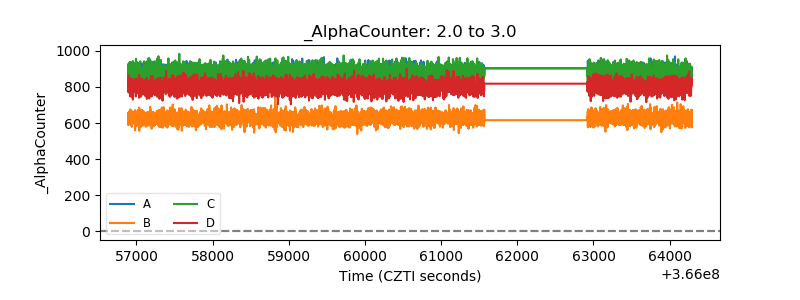 |
| _CPM_Rate | 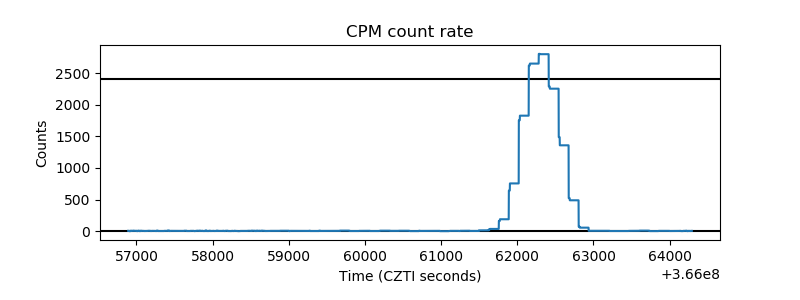 |
| CZT Counter | 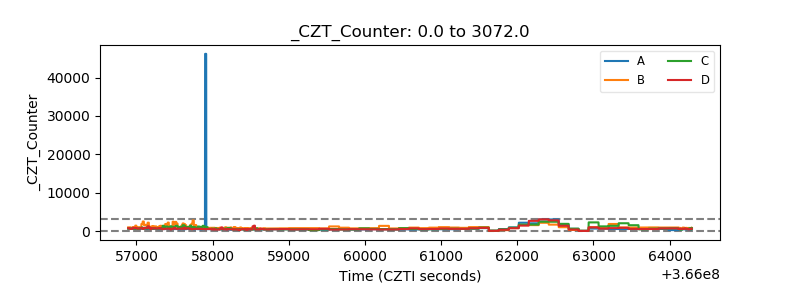 |
| +2.5 Volts monitor |  |
| +5 Volts monitor |  |
| _ROLL_ROT | 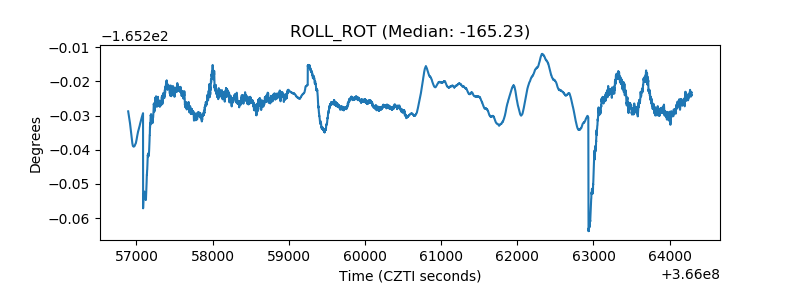 |
| _Roll_DEC | 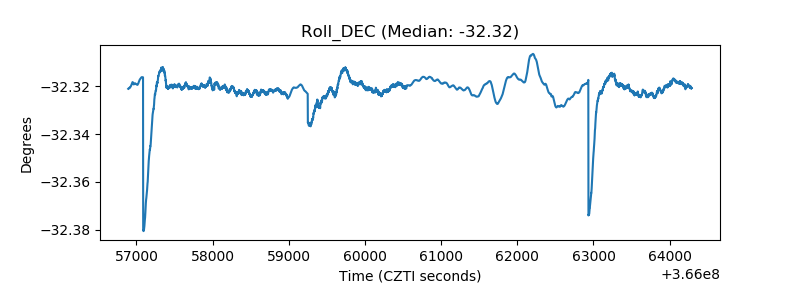 |
| _Roll_RA | 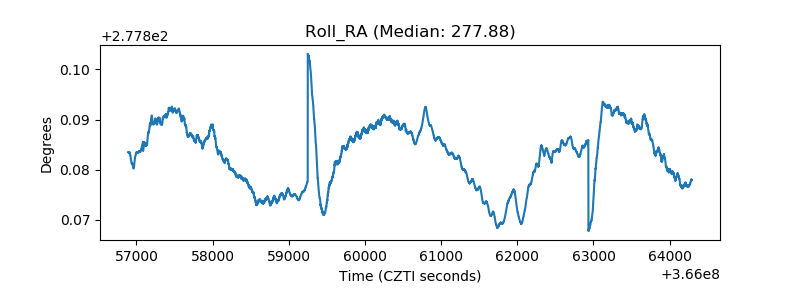 |
| Veto Counter | 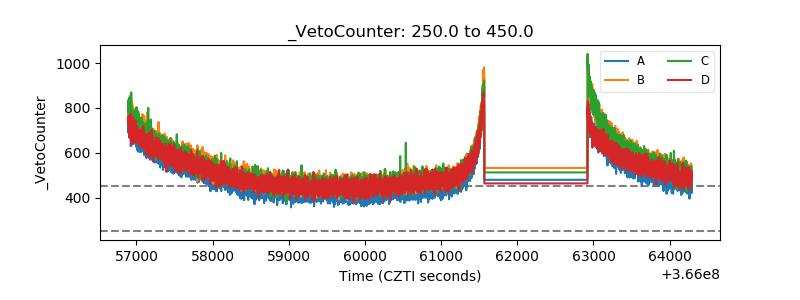 |