| Param | Original file | Final file |
|---|---|---|
| Filename | modeM0/AS1A10_103T09_9000004630_31687cztM0_level2.evt | modeM0/AS1A10_103T09_9000004630_31687cztM0_level2_quad_clean.evt |
| Size (bytes) | 613,137,600 | 91,405,440 |
| Size | 584.7 MB | 87.2 MB |
| Events in quadrant A | 3,259,099 | 616,123 |
| Events in quadrant B | 5,525,389 | 617,358 |
| Events in quadrant C | 4,409,775 | 569,964 |
| Events in quadrant D | 4,959,311 | 535,294 |
| Mode M9 | |||
|---|---|---|---|
| Quadrant | BADHDUFLAG | Total packets | Discarded packets |
| A | 0 | 20 | 0 |
| B | 0 | 21 | 0 |
| C | 0 | 21 | 0 |
| D | 0 | 21 | 0 |
| Mode M0 | |||
|---|---|---|---|
| Quadrant | BADHDUFLAG | Total packets | Discarded packets |
| A | 0 | 13572 | 2 |
| B | 0 | 20748 | 2 |
| C | 0 | 17277 | 2 |
| D | 0 | 18827 | 2 |
| Mode SS | |||
|---|---|---|---|
| Quadrant | BADHDUFLAG | Total packets | Discarded packets |
| A | 0 | 126 | 0 |
| B | 0 | 126 | 0 |
| C | 0 | 126 | 0 |
| D | 0 | 126 | 0 |
| Quadrant | Total seconds | Saturated seconds | Saturation percentage |
|---|---|---|---|
| A | 6143 | 76 | 1.237181% |
| B | 6143 | 146 | 2.376689% |
| C | 6143 | 339 | 5.518476% |
| D | 6143 | 521 | 8.481198% |
Noise dominated data is calculated using 1-second bins in cleaned event files. If a bin has >2000 counts, and if more than 50% of those come from <1% of pixels, then it is considered to be noise-dominated and hence unusable.
| Quadrant | # 1 sec bins | Bins with >0 counts | Bins with >2000 counts | High rate bins dominated by noise | Noise dominated (total time) | Noise dominated (detector-on time) | Marked lightcurve |
|---|---|---|---|---|---|---|---|
| A | 7468 | 6144 | 37 | 37 | 0.50% | 0.60% | 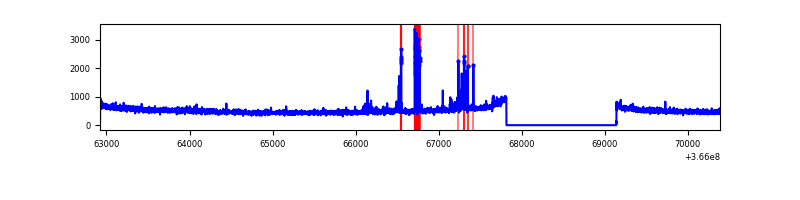 |
| B | 7468 | 6144 | 33 | 33 | 0.44% | 0.54% | 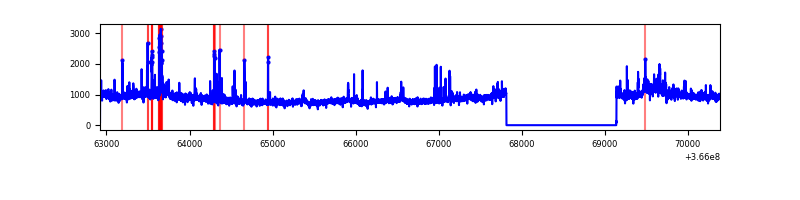 |
| C | 7468 | 6144 | 180 | 180 | 2.41% | 2.93% | 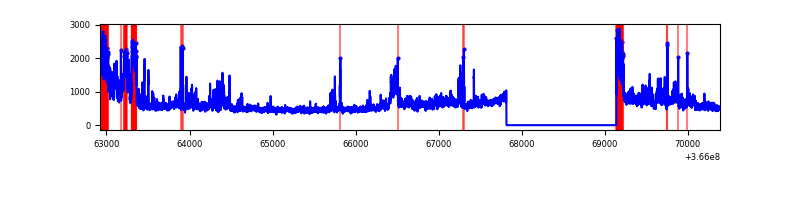 |
| D | 7468 | 6144 | 477 | 477 | 6.39% | 7.76% | 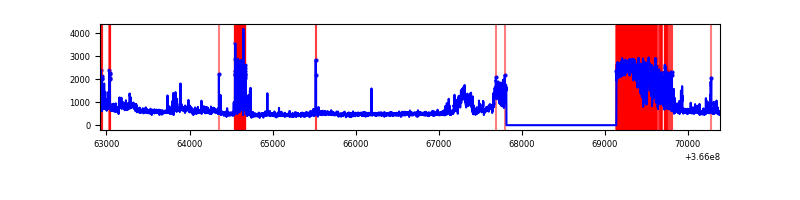 |
Top three noisy pixels from each quadrant. If the there are fewer than three noisy pixels in the level2.evt file, extra rows are filled as -1
| Pixel properties | Quadrant properties | ||||||
|---|---|---|---|---|---|---|---|
| Quadrant | DetID | PixID | Counts | Sigma | Mean | Median | Sigma |
| A | 0 | 13 | 172807 | 1082.03 | 797 | 783 | 159.0 |
| A | 13 | 254 | 12763 | 75.35 | 797 | 783 | 159.0 |
| A | 3 | 137 | 7739 | 43.75 | 797 | 783 | 159.0 |
| B | 6 | 159 | 1831076 | 12066.55 | 795 | 777 | 151.7 |
| B | 10 | 245 | 329281 | 2165.72 | 795 | 777 | 151.7 |
| B | 4 | 80 | 140057 | 918.23 | 795 | 777 | 151.7 |
| C | 3 | 233 | 839312 | 4861.85 | 742 | 748 | 172.5 |
| C | 0 | 10 | 395036 | 2286.01 | 742 | 748 | 172.5 |
| C | 14 | 238 | 120873 | 696.46 | 742 | 748 | 172.5 |
| D | 12 | 227 | 1181406 | 6771.9 | 733 | 715 | 174.4 |
| D | 8 | 195 | 640522 | 3669.64 | 733 | 715 | 174.4 |
| D | 13 | 249 | 236252 | 1350.93 | 733 | 715 | 174.4 |
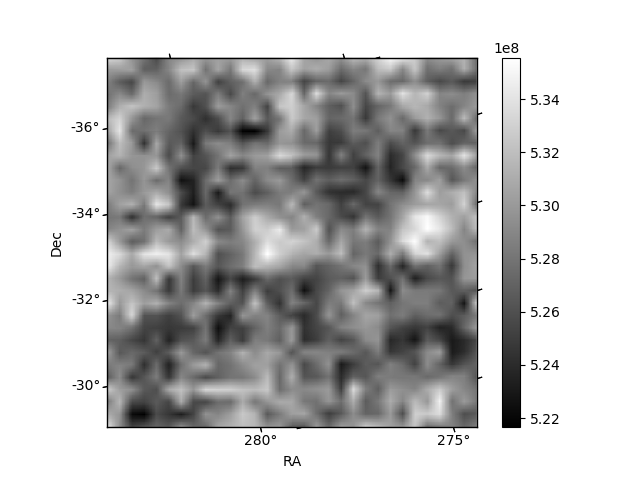
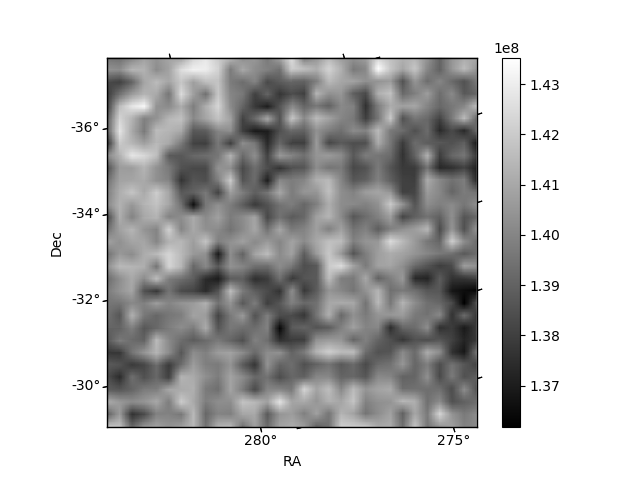
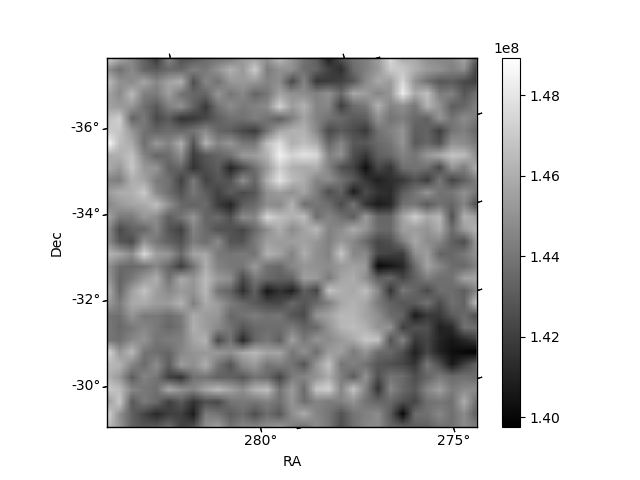
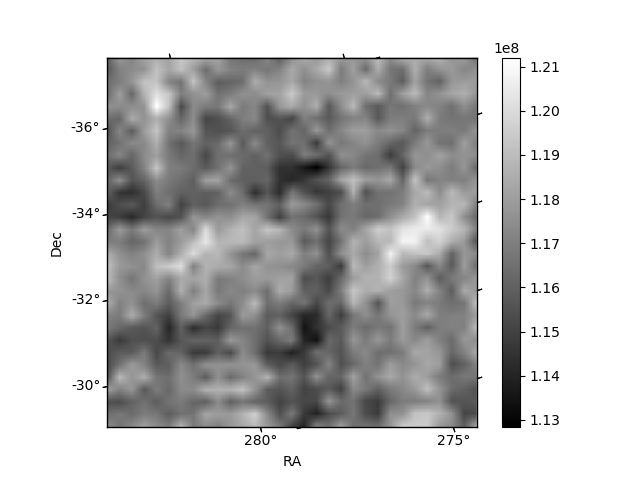
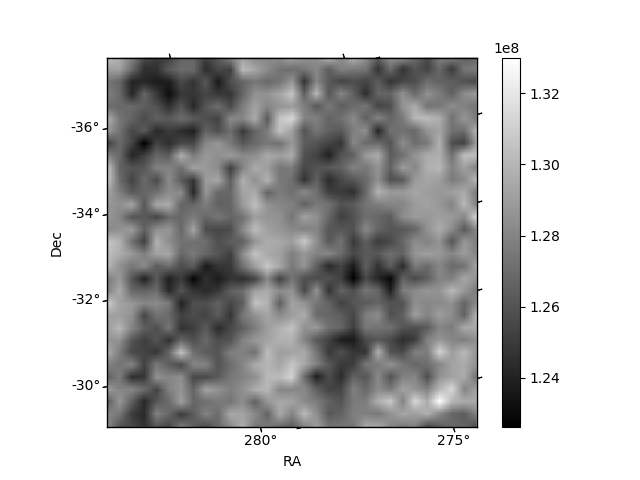
Histogram calculated using DETX and DETY for each event in the final _common_clean file
| Quadrant A | 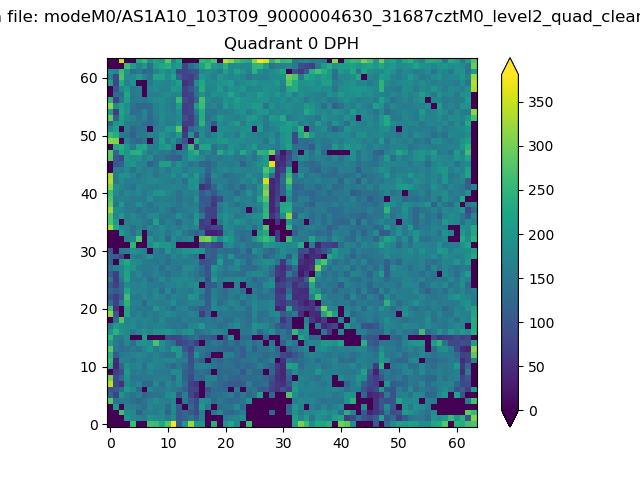 |
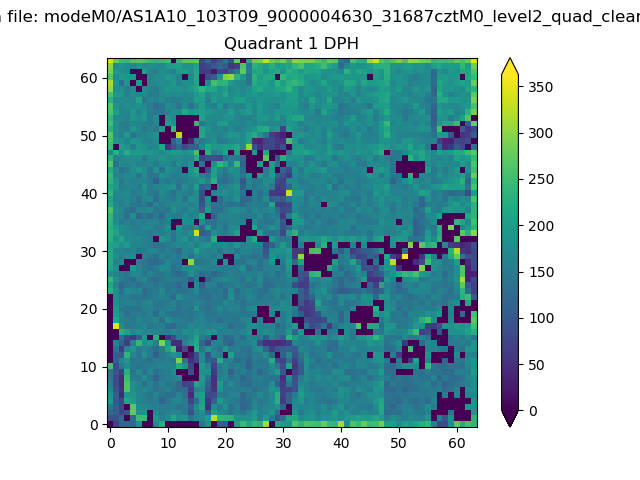 |
Quadrant B |
|---|---|---|---|
| Quadrant D | 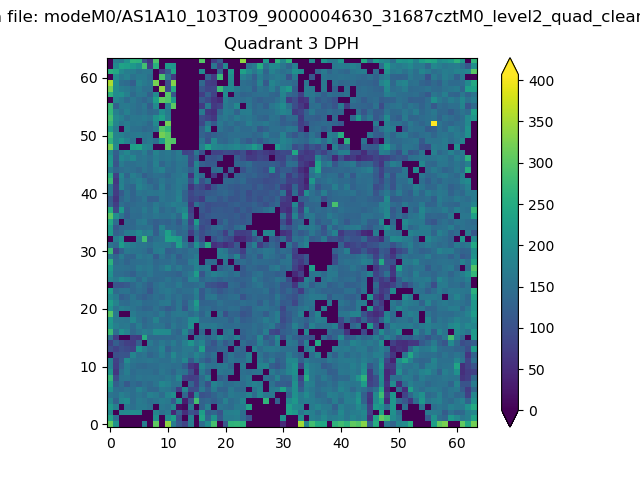 |
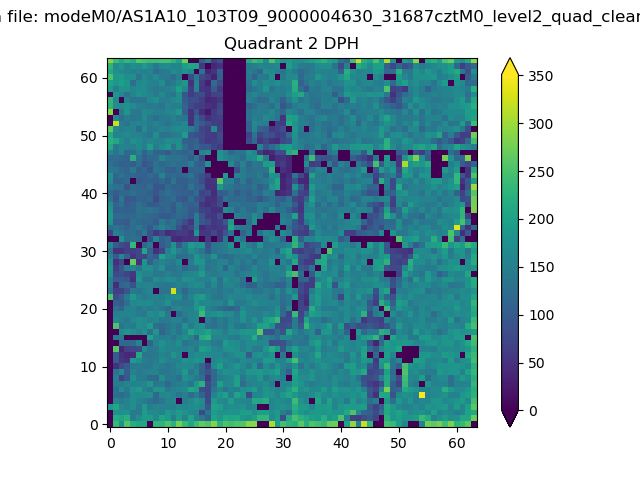 |
Quadrant C |
| Plot type | Count rate plots | Images |
|---|---|---|
| Comparison with Poisson distribution Blue bars denote a histogram of data divided into 1 sec bins. Red curve is a Poisson curve with rate = median count rate of data. |
 |
 |
| Quadrant-wise count rates Data is divided into 100 sec bins |
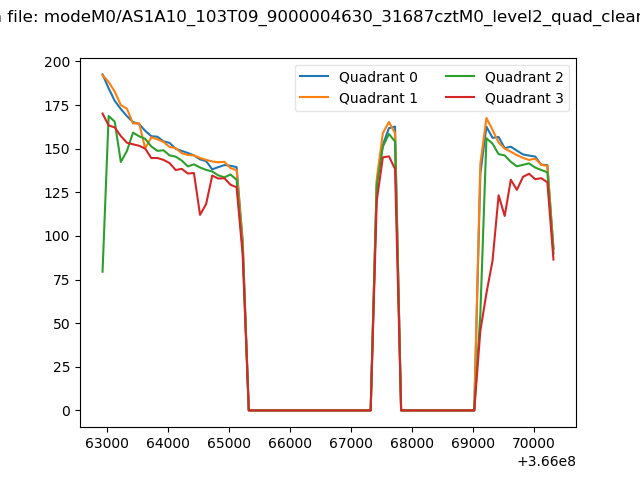 |
|
| Module-wise count rates for Quadrant A Data is divided into 100 sec bins |
 |
 |
| Module-wise count rates for Quadrant B Data is divided into 100 sec bins |
 |
 |
| Module-wise count rates for Quadrant C Data is divided into 100 sec bins |
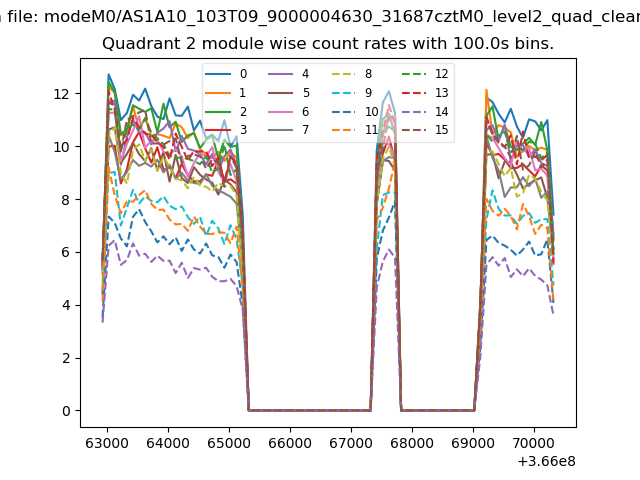 |
 |
| Module-wise count rates for Quadrant D Data is divided into 100 sec bins |
 |
 |
| Parameter | Plot |
|---|---|
| CZT HV Monitor |  |
| D_VDD | 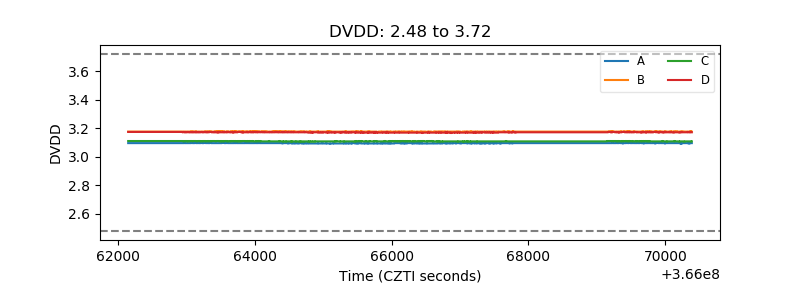 |
| Temperature 1 |  |
| Veto HV Monitor | 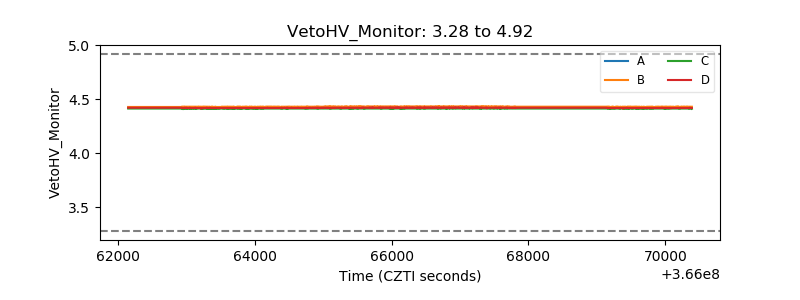 |
| Veto LLD | 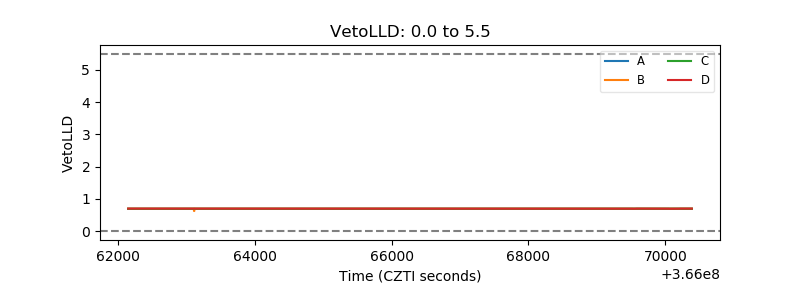 |
| Alpha Counter | 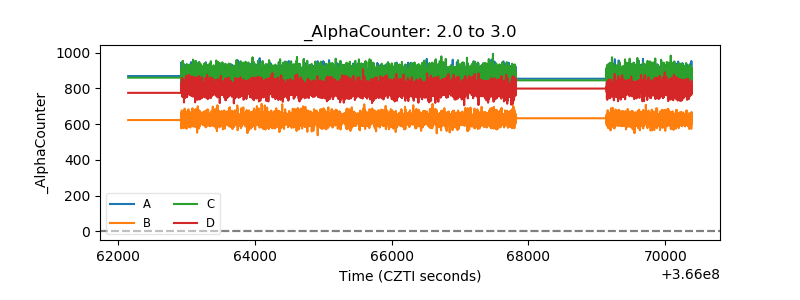 |
| _CPM_Rate | 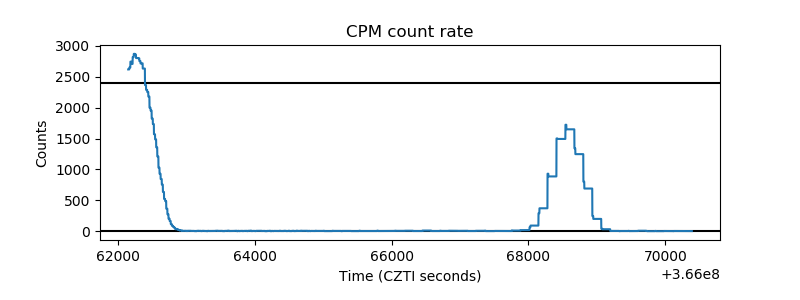 |
| CZT Counter | 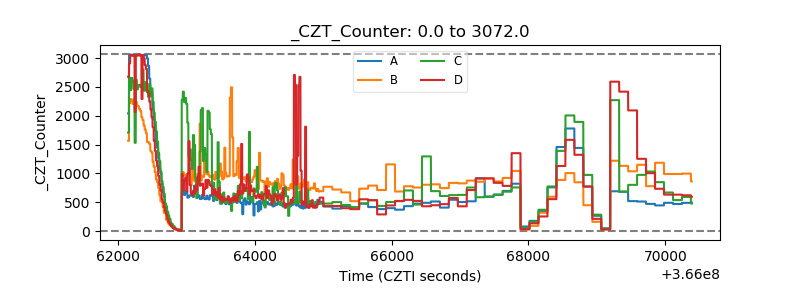 |
| +2.5 Volts monitor |  |
| +5 Volts monitor |  |
| _ROLL_ROT |  |
| _Roll_DEC |  |
| _Roll_RA | 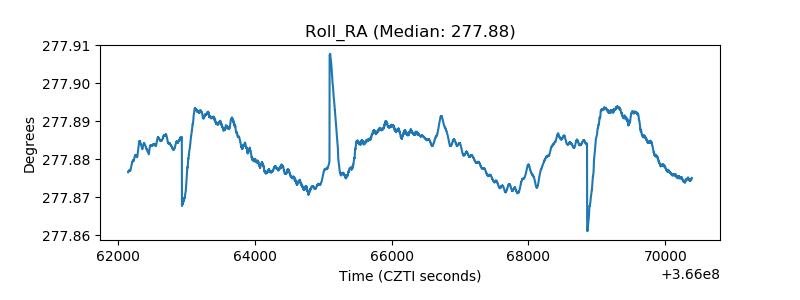 |
| Veto Counter | 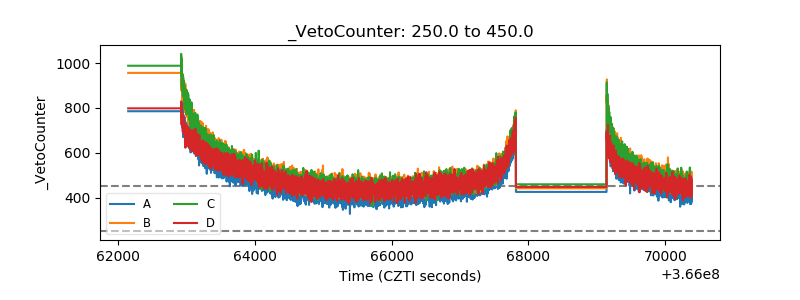 |