| Param | Original file | Final file |
|---|---|---|
| Filename | modeM0/AS1A10_103T09_9000004630_31688cztM0_level2.evt | modeM0/AS1A10_103T09_9000004630_31688cztM0_level2_quad_clean.evt |
| Size (bytes) | 613,350,720 | 94,426,560 |
| Size | 584.9 MB | 90.1 MB |
| Events in quadrant A | 3,350,189 | 628,135 |
| Events in quadrant B | 5,886,280 | 622,787 |
| Events in quadrant C | 3,995,374 | 595,009 |
| Events in quadrant D | 4,901,513 | 557,346 |
| Mode M9 | |||
|---|---|---|---|
| Quadrant | BADHDUFLAG | Total packets | Discarded packets |
| A | 0 | 19 | 0 |
| B | 0 | 20 | 0 |
| C | 0 | 20 | 0 |
| D | 0 | 20 | 0 |
| Mode M0 | |||
|---|---|---|---|
| Quadrant | BADHDUFLAG | Total packets | Discarded packets |
| A | 0 | 14154 | 2 |
| B | 0 | 22045 | 2 |
| C | 0 | 16120 | 2 |
| D | 0 | 18924 | 2 |
| Mode SS | |||
|---|---|---|---|
| Quadrant | BADHDUFLAG | Total packets | Discarded packets |
| A | 0 | 132 | 0 |
| B | 0 | 132 | 0 |
| C | 0 | 132 | 0 |
| D | 0 | 132 | 0 |
| Quadrant | Total seconds | Saturated seconds | Saturation percentage |
|---|---|---|---|
| A | 6541 | 41 | 0.626815% |
| B | 6541 | 154 | 2.354380% |
| C | 6541 | 237 | 3.623299% |
| D | 6541 | 453 | 6.925547% |
Noise dominated data is calculated using 1-second bins in cleaned event files. If a bin has >2000 counts, and if more than 50% of those come from <1% of pixels, then it is considered to be noise-dominated and hence unusable.
| Quadrant | # 1 sec bins | Bins with >0 counts | Bins with >2000 counts | High rate bins dominated by noise | Noise dominated (total time) | Noise dominated (detector-on time) | Marked lightcurve |
|---|---|---|---|---|---|---|---|
| A | 7596 | 6542 | 12 | 12 | 0.16% | 0.18% | 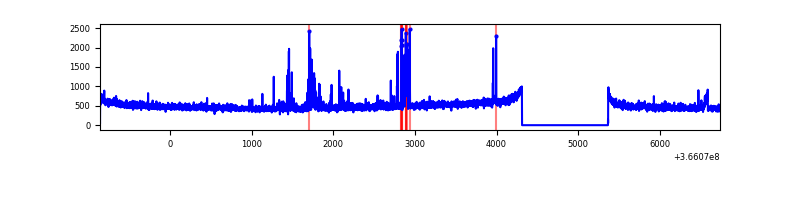 |
| B | 7596 | 6542 | 61 | 61 | 0.80% | 0.93% | 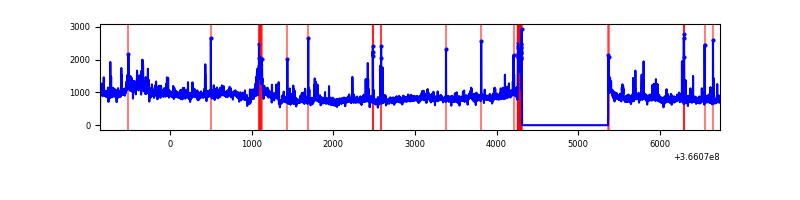 |
| C | 7596 | 6542 | 112 | 112 | 1.47% | 1.71% | 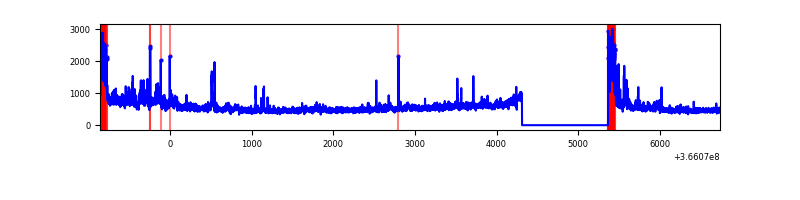 |
| D | 7596 | 6542 | 473 | 473 | 6.23% | 7.23% | 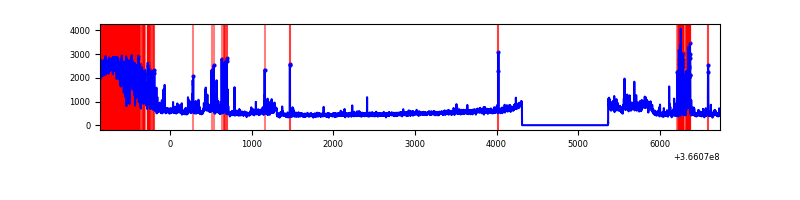 |
Top three noisy pixels from each quadrant. If the there are fewer than three noisy pixels in the level2.evt file, extra rows are filled as -1
| Pixel properties | Quadrant properties | ||||||
|---|---|---|---|---|---|---|---|
| Quadrant | DetID | PixID | Counts | Sigma | Mean | Median | Sigma |
| A | 0 | 13 | 163217 | 977.23 | 820 | 803 | 166.2 |
| A | 15 | 174 | 13823 | 78.34 | 820 | 803 | 166.2 |
| A | 13 | 254 | 13415 | 75.89 | 820 | 803 | 166.2 |
| B | 6 | 159 | 1883166 | 12161.2 | 810 | 792 | 154.8 |
| B | 10 | 245 | 425362 | 2742.96 | 810 | 792 | 154.8 |
| B | 0 | 229 | 128238 | 823.37 | 810 | 792 | 154.8 |
| C | 3 | 233 | 388210 | 2137.87 | 771 | 777 | 181.2 |
| C | 0 | 10 | 349707 | 1925.41 | 771 | 777 | 181.2 |
| C | 14 | 238 | 124566 | 683.07 | 771 | 777 | 181.2 |
| D | 12 | 227 | 1009331 | 5522.56 | 762 | 741 | 182.6 |
| D | 8 | 195 | 612338 | 3348.81 | 762 | 741 | 182.6 |
| D | 13 | 249 | 242160 | 1321.9 | 762 | 741 | 182.6 |
Histogram calculated using DETX and DETY for each event in the final _common_clean file
| Quadrant A | 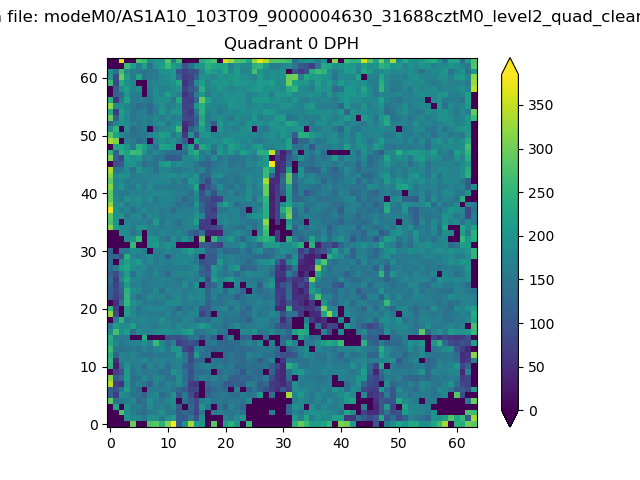 |
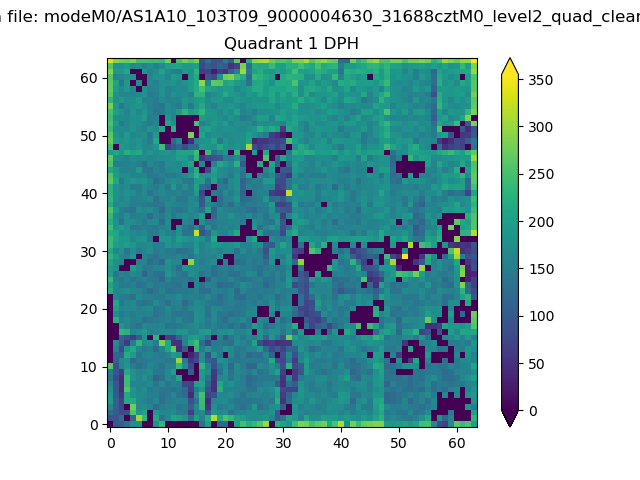 |
Quadrant B |
|---|---|---|---|
| Quadrant D | 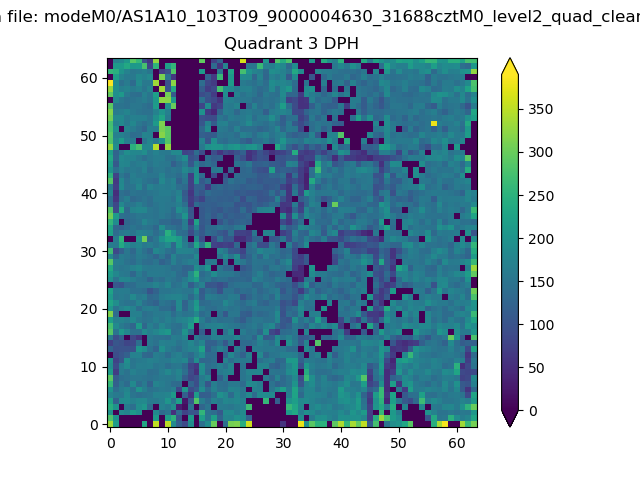 |
 |
Quadrant C |
| Plot type | Count rate plots | Images |
|---|---|---|
| Comparison with Poisson distribution Blue bars denote a histogram of data divided into 1 sec bins. Red curve is a Poisson curve with rate = median count rate of data. |
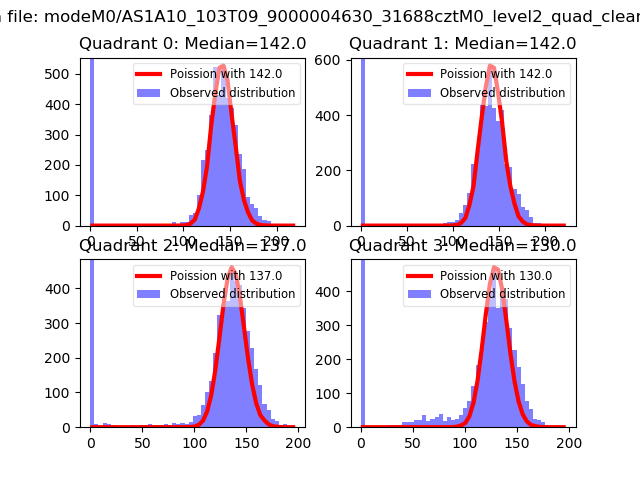 |
 |
| Quadrant-wise count rates Data is divided into 100 sec bins |
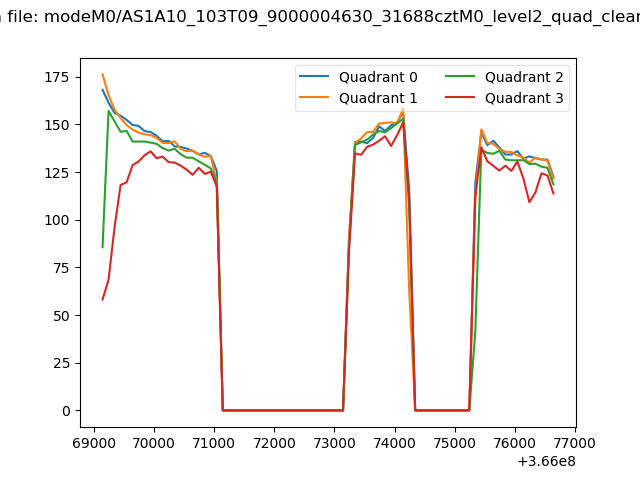 |
|
| Module-wise count rates for Quadrant A Data is divided into 100 sec bins |
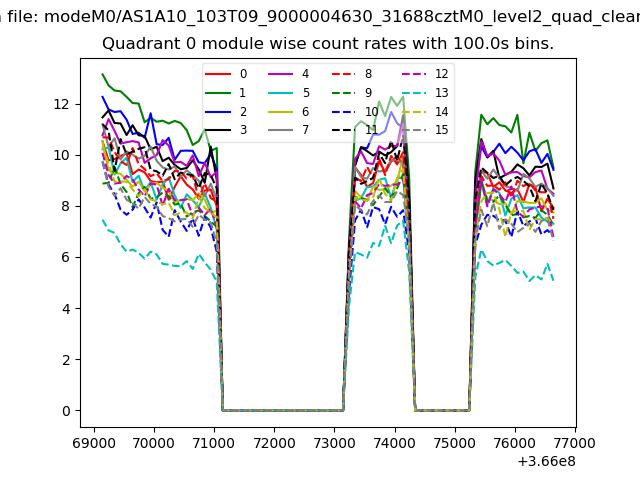 |
 |
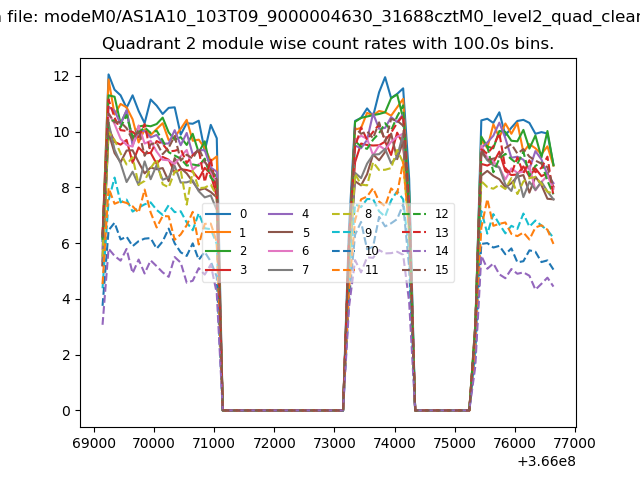
| Module-wise count rates for Quadrant B Data is divided into 100 sec bins |
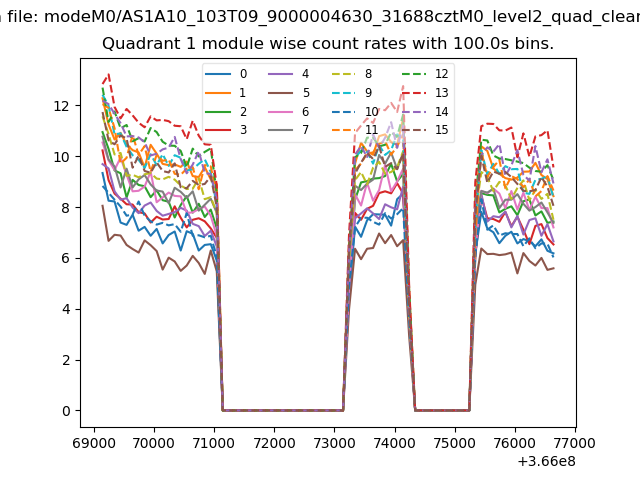 |
 |
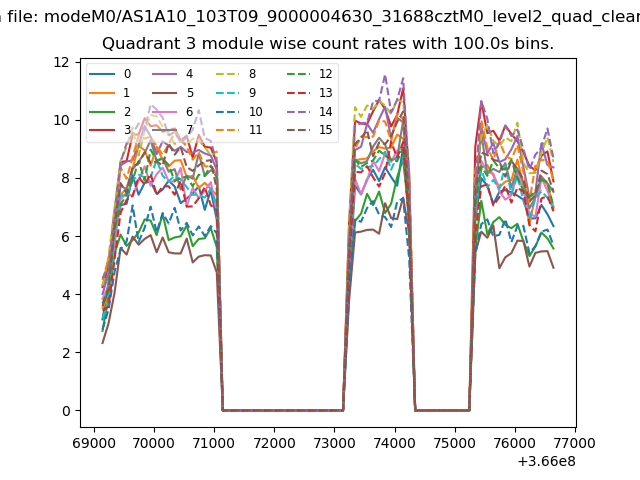
| Module-wise count rates for Quadrant C Data is divided into 100 sec bins |
 |
 |
| Module-wise count rates for Quadrant D Data is divided into 100 sec bins |
 |
 |
| Parameter | Plot |
|---|---|
| CZT HV Monitor | 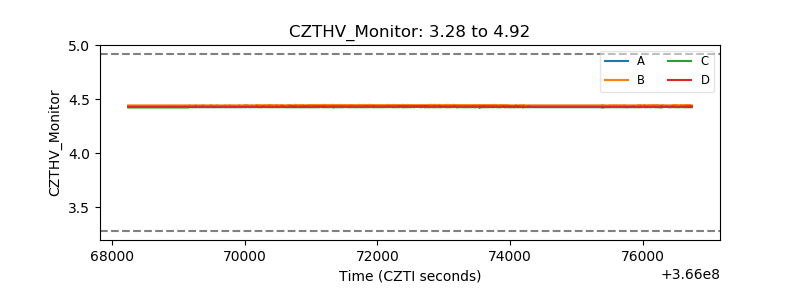 |
| D_VDD | 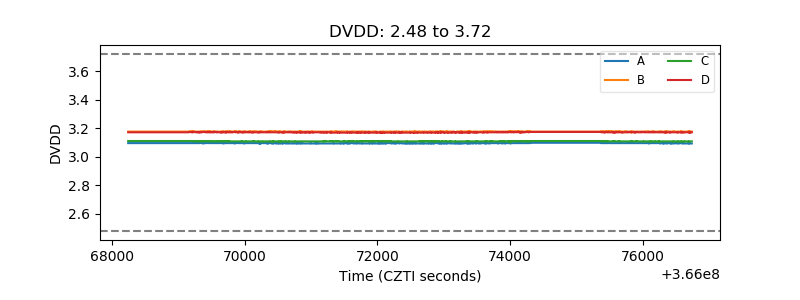 |
| Temperature 1 | 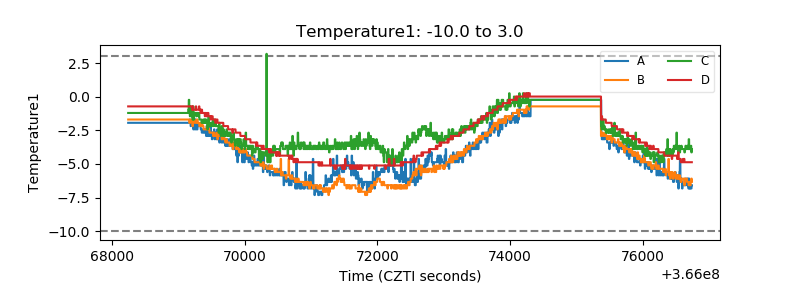 |
| Veto HV Monitor | 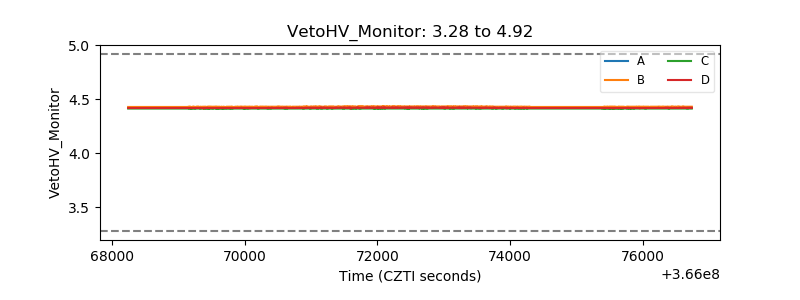 |
| Veto LLD | 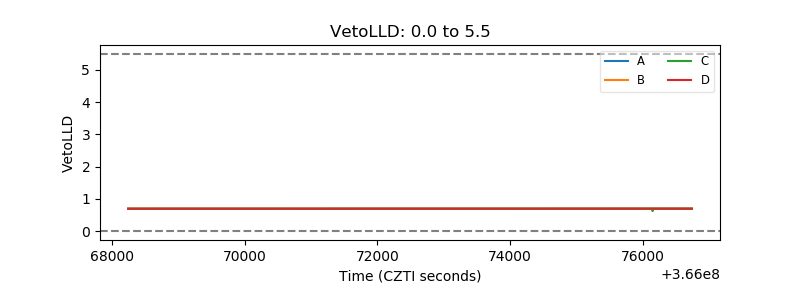 |
| Alpha Counter | 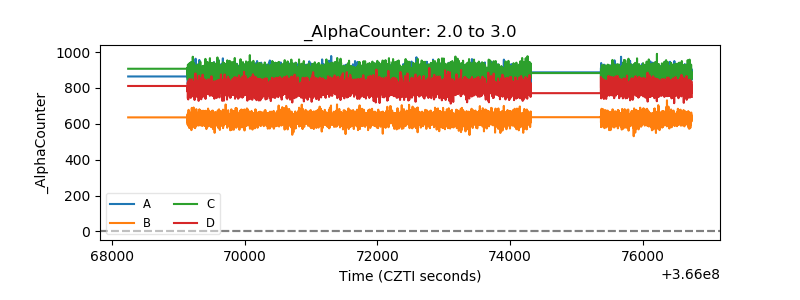 |
| _CPM_Rate | 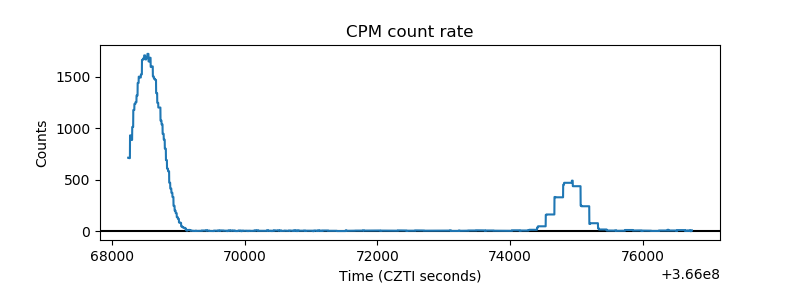 |
| CZT Counter |  |
| +2.5 Volts monitor |  |
| +5 Volts monitor |  |
| _ROLL_ROT | 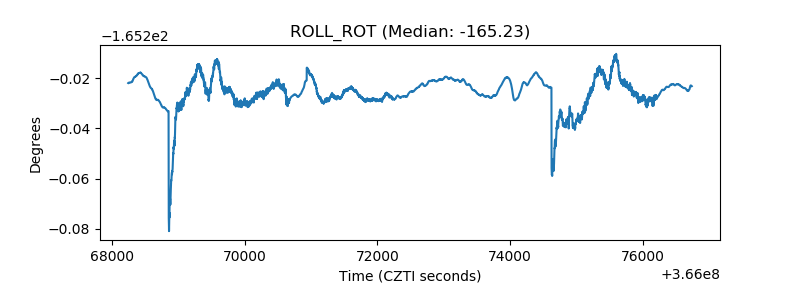 |
| _Roll_DEC | 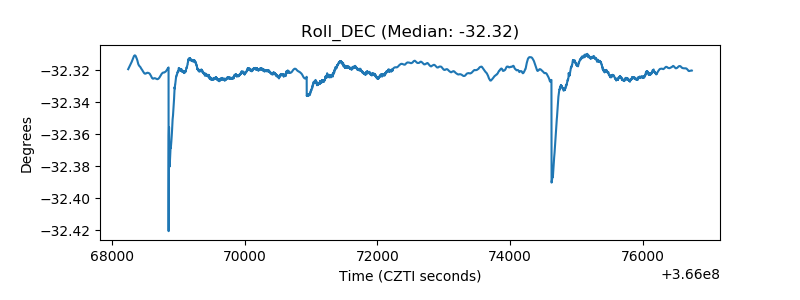 |
| _Roll_RA |  |
| Veto Counter | 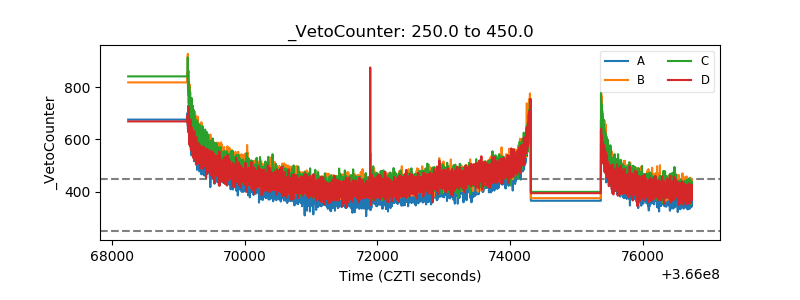 |