| Param | Original file | Final file |
|---|---|---|
| Filename | modeM0/AS1A10_103T09_9000004630_31690cztM0_level2.evt | modeM0/AS1A10_103T09_9000004630_31690cztM0_level2_quad_clean.evt |
| Size (bytes) | 127,094,400 | 11,050,560 |
| Size | 121.2 MB | 10.5 MB |
| Events in quadrant A | 605,640 | 60,108 |
| Events in quadrant B | 1,034,244 | 57,771 |
| Events in quadrant C | 1,362,765 | 56,681 |
| Events in quadrant D | 750,511 | 56,779 |
| Mode M0 | |||
|---|---|---|---|
| Quadrant | BADHDUFLAG | Total packets | Discarded packets |
| A | 0 | 3113 | 315 |
| B | 0 | 4688 | 552 |
| C | 0 | 5466 | 453 |
| D | 0 | 3451 | 394 |
| Mode SS | |||
|---|---|---|---|
| Quadrant | BADHDUFLAG | Total packets | Discarded packets |
| A | 0 | 32 | 4 |
| B | 0 | 31 | 3 |
| C | 0 | 32 | 4 |
| D | 0 | 32 | 4 |
| Quadrant | Total seconds | Saturated seconds | Saturation percentage |
|---|---|---|---|
| A | 1380 | 0 | 0.000000% |
| B | 1362 | 7 | 0.513950% |
| C | 1369 | 115 | 8.400292% |
| D | 1378 | 7 | 0.507983% |
Noise dominated data is calculated using 1-second bins in cleaned event files. If a bin has >2000 counts, and if more than 50% of those come from <1% of pixels, then it is considered to be noise-dominated and hence unusable.
| Quadrant | # 1 sec bins | Bins with >0 counts | Bins with >2000 counts | High rate bins dominated by noise | Noise dominated (total time) | Noise dominated (detector-on time) | Marked lightcurve |
|---|---|---|---|---|---|---|---|
| A | 1495 | 1426 | 0 | 0 | 0.00% | 0.00% |  |
| B | 1491 | 1394 | 0 | 0 | 0.00% | 0.00% |  |
| C | 1496 | 1408 | 35 | 35 | 2.34% | 2.49% |  |
| D | 1493 | 1424 | 6 | 6 | 0.40% | 0.42% |  |
Top three noisy pixels from each quadrant. If the there are fewer than three noisy pixels in the level2.evt file, extra rows are filled as -1
| Pixel properties | Quadrant properties | ||||||
|---|---|---|---|---|---|---|---|
| Quadrant | DetID | PixID | Counts | Sigma | Mean | Median | Sigma |
| A | 0 | 13 | 12463 | 379.16 | 153 | 150 | 32.5 |
| A | 13 | 254 | 2593 | 75.23 | 153 | 150 | 32.5 |
| A | 3 | 137 | 1647 | 46.1 | 153 | 150 | 32.5 |
| B | 6 | 159 | 392302 | 12438.81 | 153 | 148 | 31.5 |
| B | 10 | 245 | 18624 | 586.03 | 153 | 148 | 31.5 |
| B | 0 | 229 | 10153 | 317.34 | 153 | 148 | 31.5 |
| C | 3 | 233 | 756572 | 20697.0 | 146 | 146 | 36.5 |
| C | 14 | 238 | 23484 | 638.56 | 146 | 146 | 36.5 |
| C | 0 | 10 | 6077 | 162.28 | 146 | 146 | 36.5 |
| D | 8 | 195 | 120151 | 3190.92 | 147 | 142 | 37.6 |
| D | 12 | 227 | 24331 | 643.16 | 147 | 142 | 37.6 |
| D | 2 | 250 | 11644 | 305.83 | 147 | 142 | 37.6 |
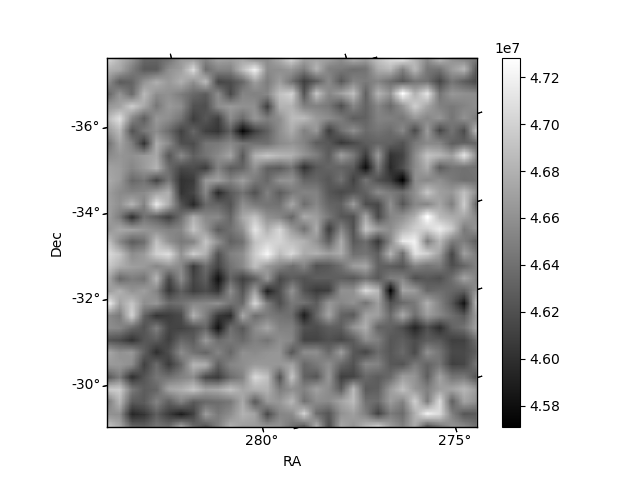
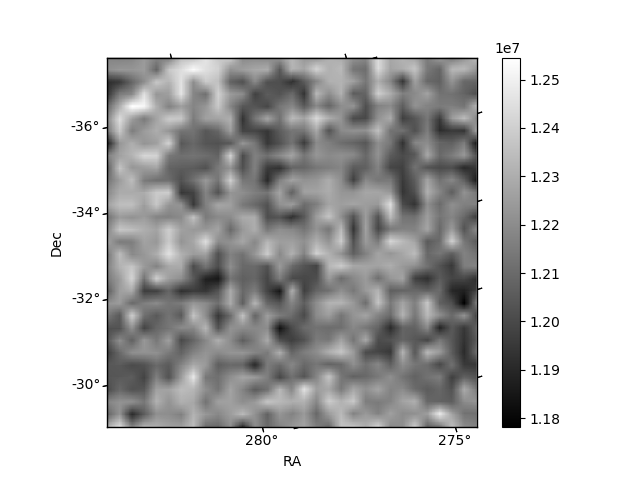
Histogram calculated using DETX and DETY for each event in the final _common_clean file
| Quadrant A | 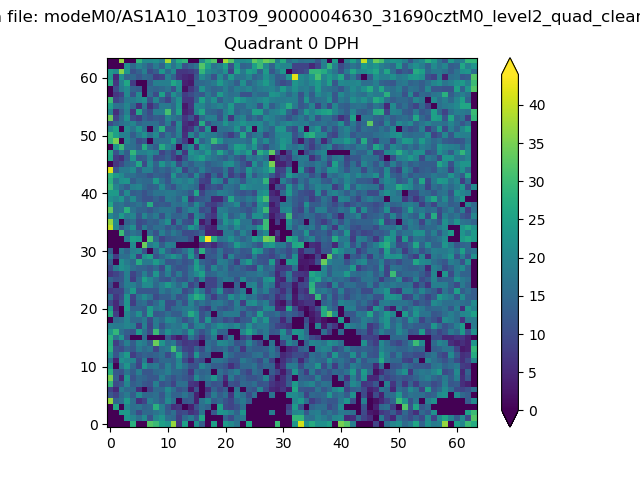 |
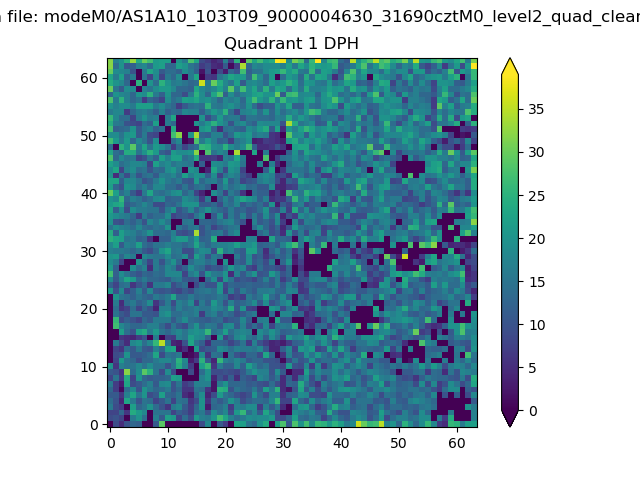 |
Quadrant B |
|---|---|---|---|
| Quadrant D | 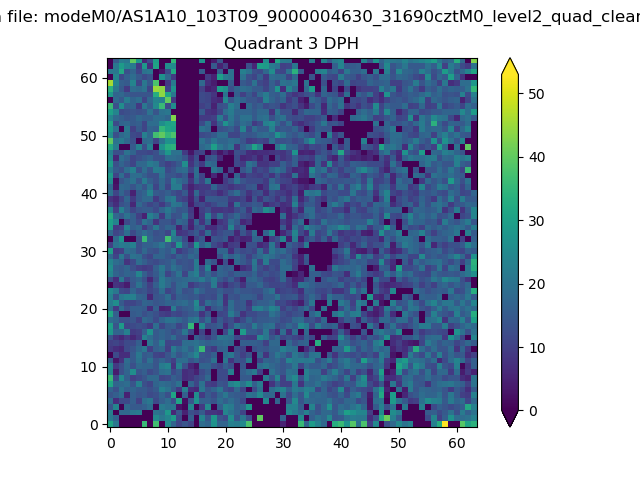 |
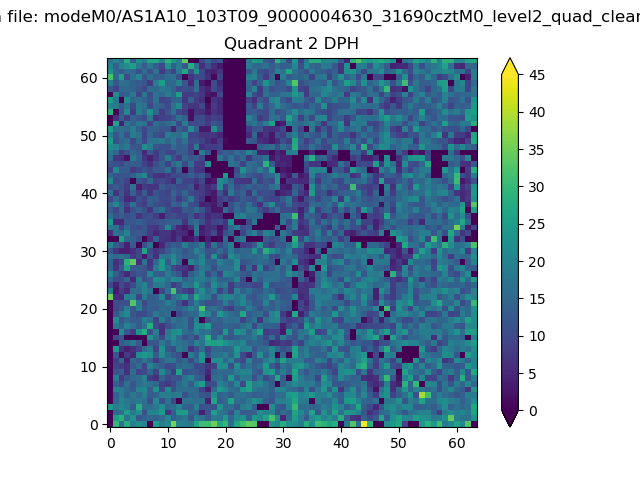 |
Quadrant C |
| Plot type | Count rate plots | Images |
|---|---|---|
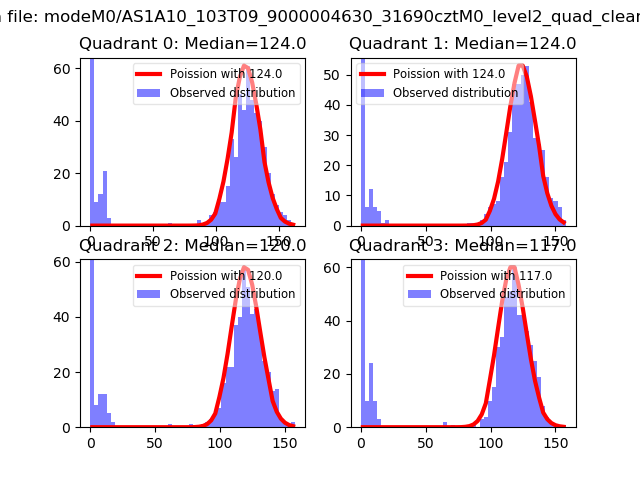
| Comparison with Poisson distribution Blue bars denote a histogram of data divided into 1 sec bins. Red curve is a Poisson curve with rate = median count rate of data. |
 |
 |
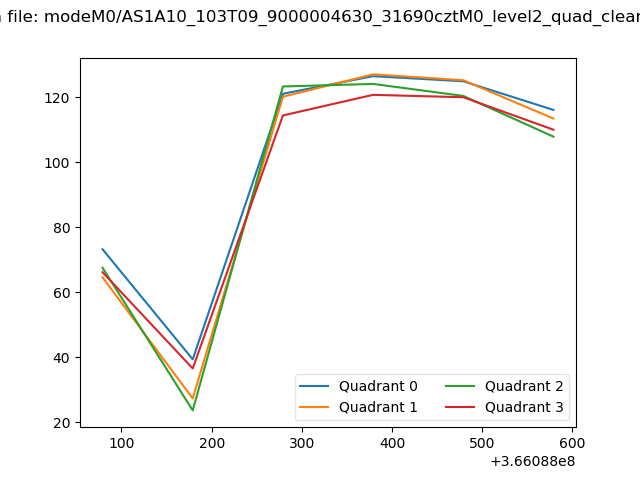
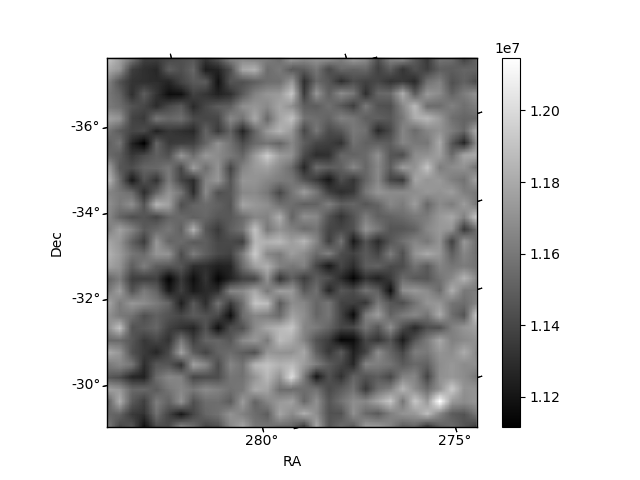
| Quadrant-wise count rates Data is divided into 100 sec bins |
 |
|
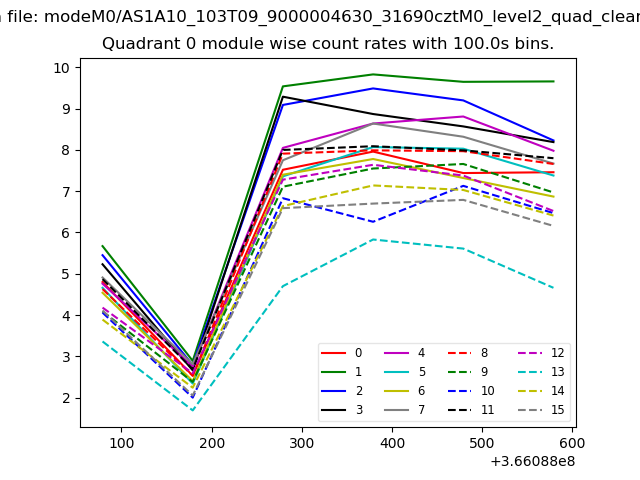
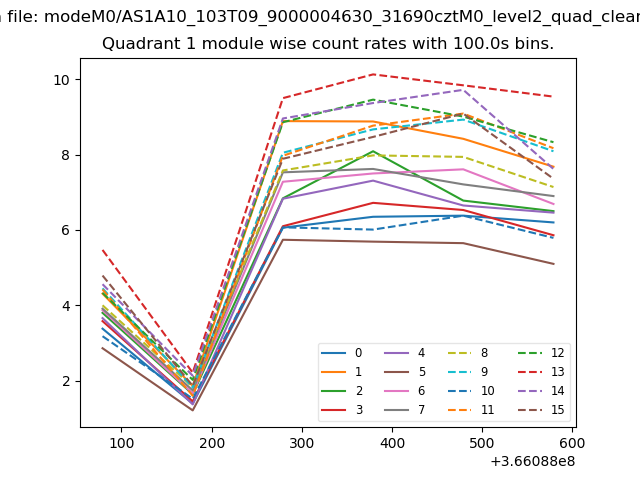
| Module-wise count rates for Quadrant A Data is divided into 100 sec bins |
 |
 |
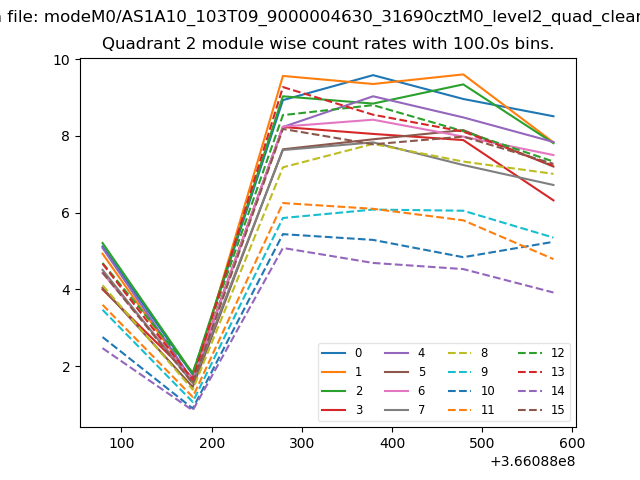
| Module-wise count rates for Quadrant B Data is divided into 100 sec bins |
 |
 |
| Module-wise count rates for Quadrant C Data is divided into 100 sec bins |
 |
 |
| Module-wise count rates for Quadrant D Data is divided into 100 sec bins |
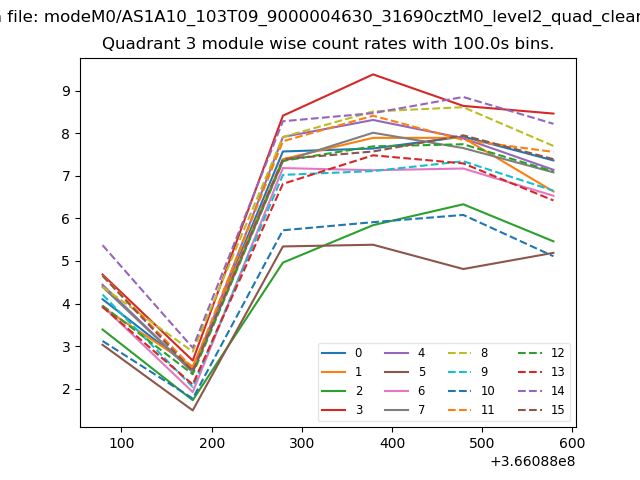 |
 |
| Parameter | Plot |
|---|---|
| CZT HV Monitor | 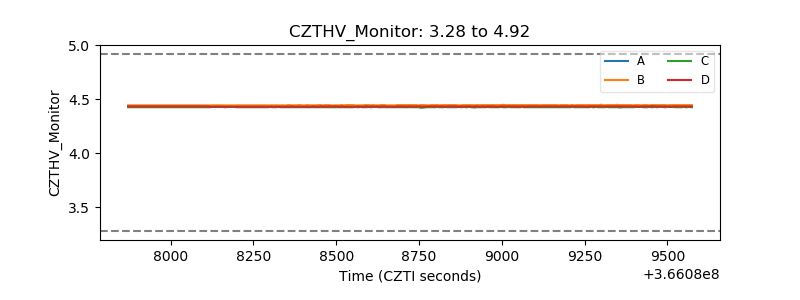 |
| D_VDD | 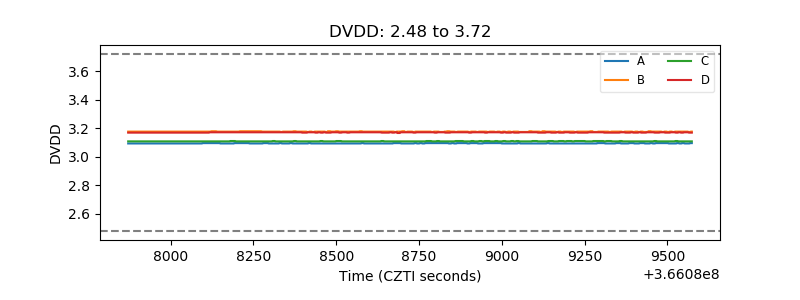 |
| Temperature 1 | 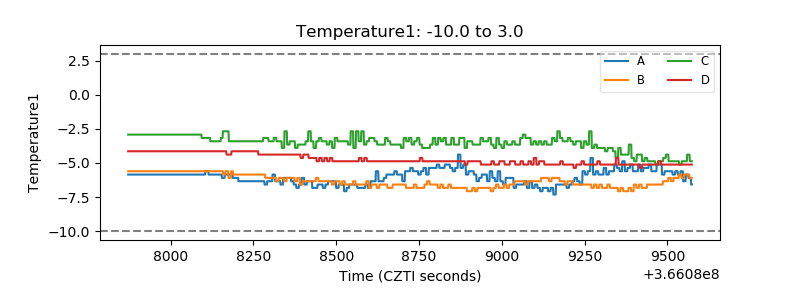 |
| Veto HV Monitor | 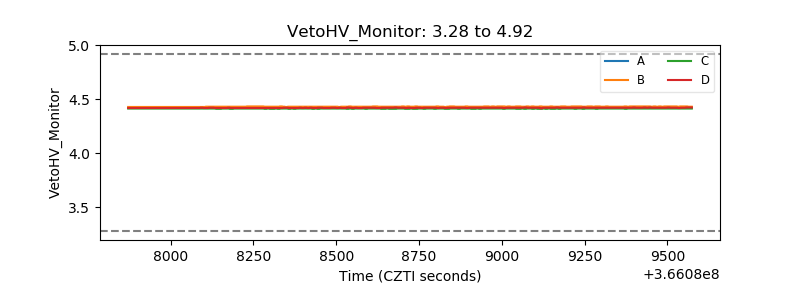 |
| Veto LLD | 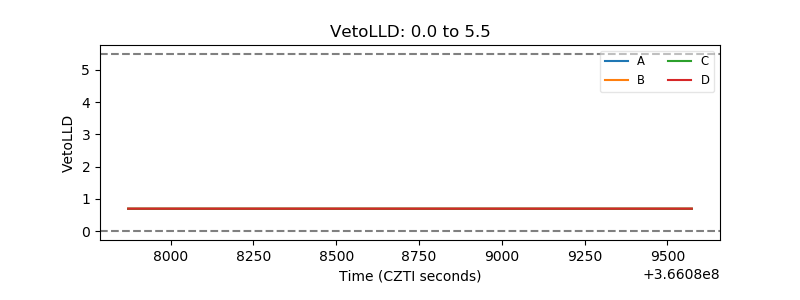 |
| Alpha Counter | 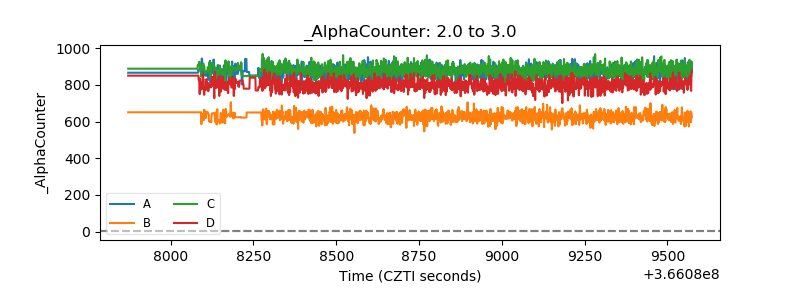 |
| _CPM_Rate | 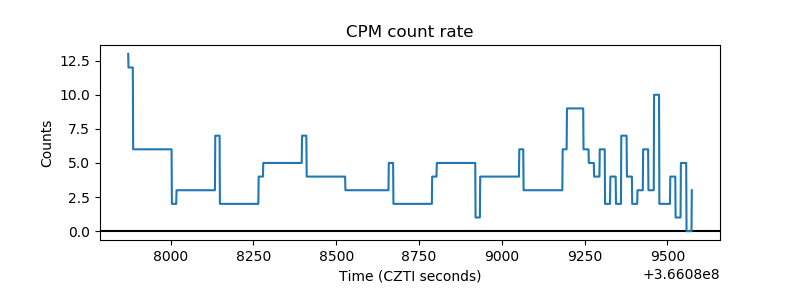 |
| CZT Counter | 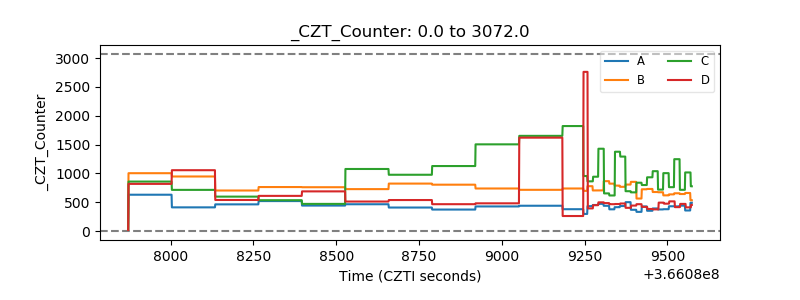 |
| +2.5 Volts monitor |  |
| +5 Volts monitor |  |
| _ROLL_ROT | 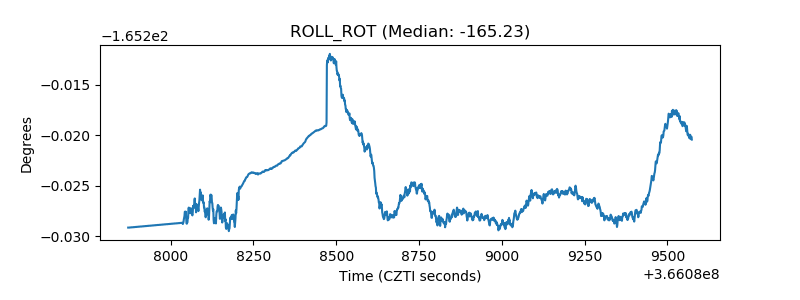 |
| _Roll_DEC | 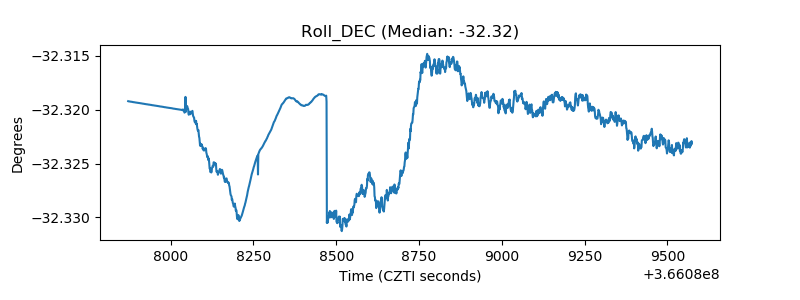 |
| _Roll_RA | 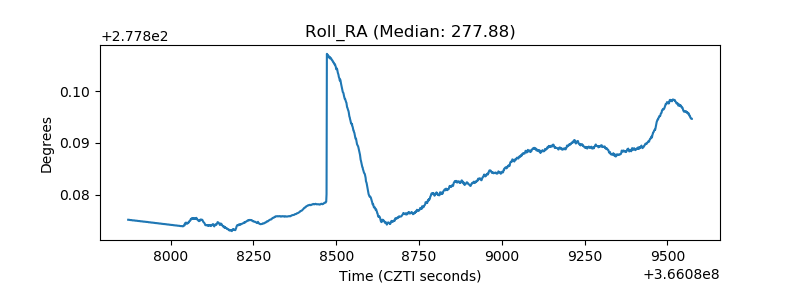 |
| Veto Counter | 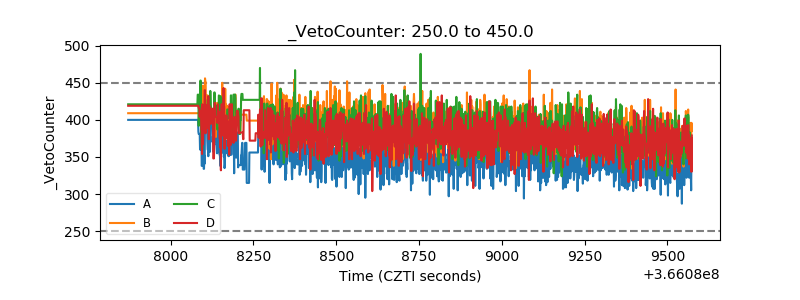 |