| Param | Original file | Final file |
|---|---|---|
| Filename | modeM0/AS1A10_103T09_9000004630_31694cztM0_level2.evt | modeM0/AS1A10_103T09_9000004630_31694cztM0_level2_quad_clean.evt |
| Size (bytes) | 832,092,480 | 125,565,120 |
| Size | 793.5 MB | 119.7 MB |
| Events in quadrant A | 5,824,402 | 786,738 |
| Events in quadrant B | 7,756,487 | 788,617 |
| Events in quadrant C | 5,381,393 | 777,723 |
| Events in quadrant D | 5,565,623 | 760,029 |
| Mode M9 | |||
|---|---|---|---|
| Quadrant | BADHDUFLAG | Total packets | Discarded packets |
| A | 0 | 10 | 0 |
| B | 0 | 10 | 0 |
| C | 0 | 10 | 0 |
| D | 0 | 10 | 0 |
| Mode M0 | |||
|---|---|---|---|
| Quadrant | BADHDUFLAG | Total packets | Discarded packets |
| A | 0 | 23957 | 2 |
| B | 0 | 30799 | 2 |
| C | 0 | 22186 | 2 |
| D | 0 | 22747 | 2 |
| Mode SS | |||
|---|---|---|---|
| Quadrant | BADHDUFLAG | Total packets | Discarded packets |
| A | 0 | 204 | 0 |
| B | 0 | 204 | 0 |
| C | 0 | 204 | 0 |
| D | 0 | 204 | 0 |
| Quadrant | Total seconds | Saturated seconds | Saturation percentage |
|---|---|---|---|
| A | 9944 | 291 | 2.926388% |
| B | 9945 | 256 | 2.574158% |
| C | 9945 | 275 | 2.765209% |
| D | 9945 | 137 | 1.377577% |
Noise dominated data is calculated using 1-second bins in cleaned event files. If a bin has >2000 counts, and if more than 50% of those come from <1% of pixels, then it is considered to be noise-dominated and hence unusable.
| Quadrant | # 1 sec bins | Bins with >0 counts | Bins with >2000 counts | High rate bins dominated by noise | Noise dominated (total time) | Noise dominated (detector-on time) | Marked lightcurve |
|---|---|---|---|---|---|---|---|
| A | 10929 | 9946 | 95 | 95 | 0.87% | 0.96% | 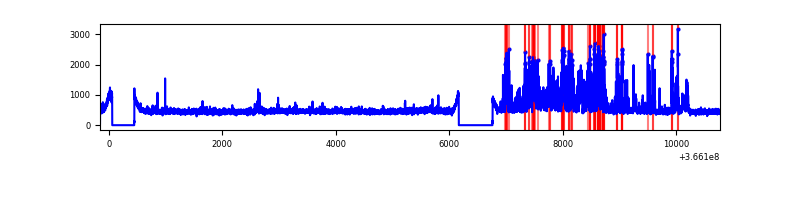 |
| B | 10930 | 9947 | 46 | 46 | 0.42% | 0.46% | 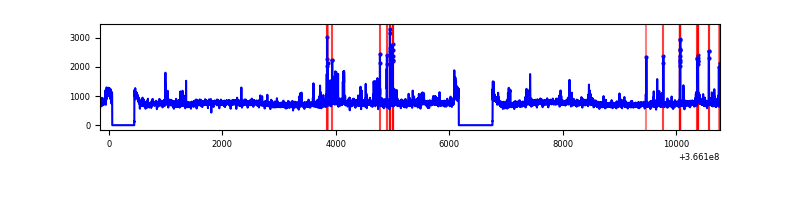 |
| C | 10930 | 9947 | 37 | 37 | 0.34% | 0.37% | 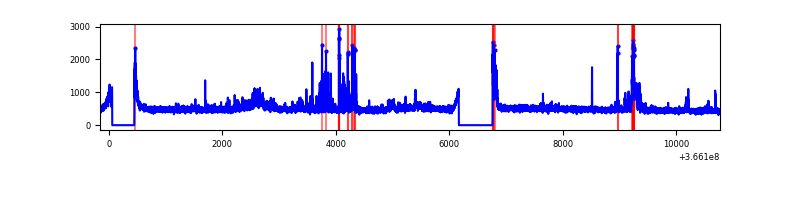 |
| D | 10930 | 9947 | 44 | 44 | 0.40% | 0.44% | 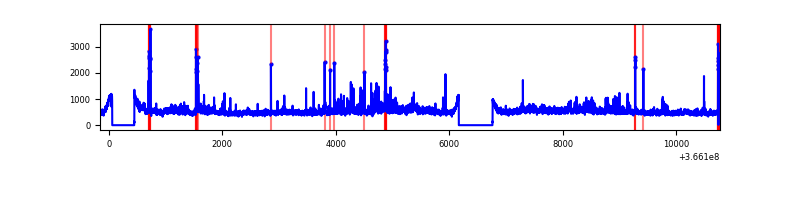 |
Top three noisy pixels from each quadrant. If the there are fewer than three noisy pixels in the level2.evt file, extra rows are filled as -1
| Pixel properties | Quadrant properties | ||||||
|---|---|---|---|---|---|---|---|
| Quadrant | DetID | PixID | Counts | Sigma | Mean | Median | Sigma |
| A | 0 | 13 | 1190531 | 4958.96 | 1190 | 1164 | 239.8 |
| A | 14 | 238 | 22962 | 90.88 | 1190 | 1164 | 239.8 |
| A | 13 | 254 | 18126 | 70.72 | 1190 | 1164 | 239.8 |
| B | 6 | 159 | 2673514 | 11743.69 | 1179 | 1147 | 227.6 |
| B | 5 | 172 | 157861 | 688.68 | 1179 | 1147 | 227.6 |
| B | 4 | 80 | 117807 | 512.66 | 1179 | 1147 | 227.6 |
| C | 0 | 10 | 251427 | 923.79 | 1141 | 1147 | 270.9 |
| C | 10 | 22 | 207922 | 763.21 | 1141 | 1147 | 270.9 |
| C | 14 | 238 | 182900 | 670.86 | 1141 | 1147 | 270.9 |
| D | 8 | 195 | 721679 | 2619.14 | 1154 | 1123 | 275.1 |
| D | 1 | 52 | 216457 | 782.71 | 1154 | 1123 | 275.1 |
| D | 13 | 249 | 101095 | 363.39 | 1154 | 1123 | 275.1 |
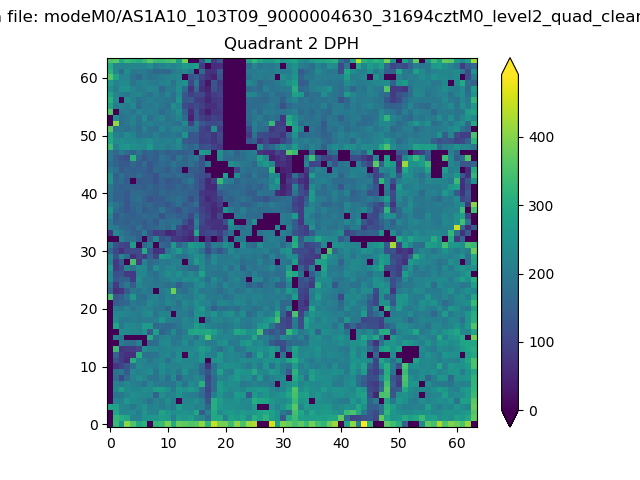
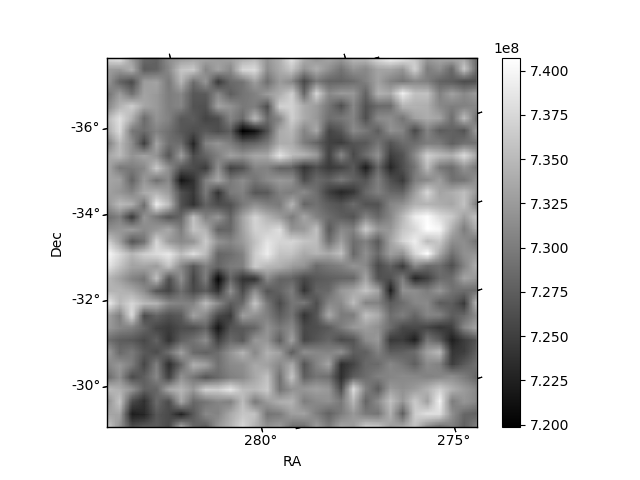
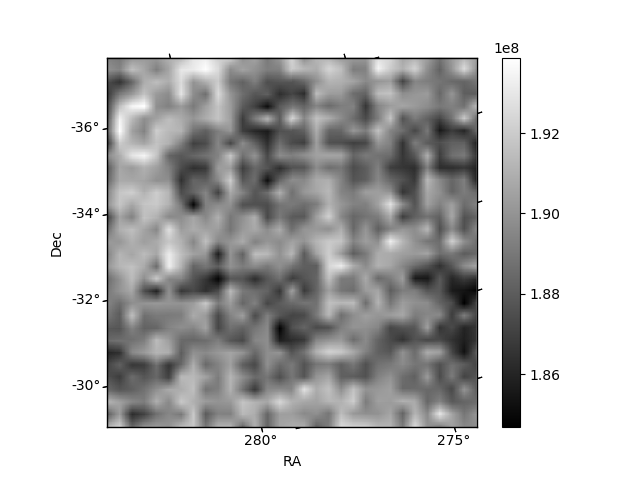
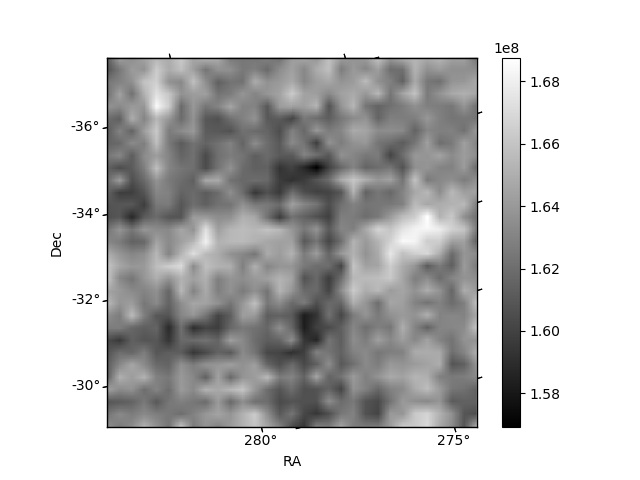
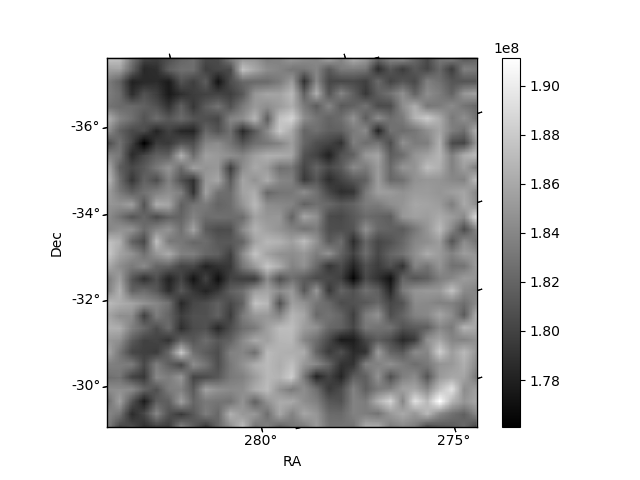
Histogram calculated using DETX and DETY for each event in the final _common_clean file
| Quadrant A | 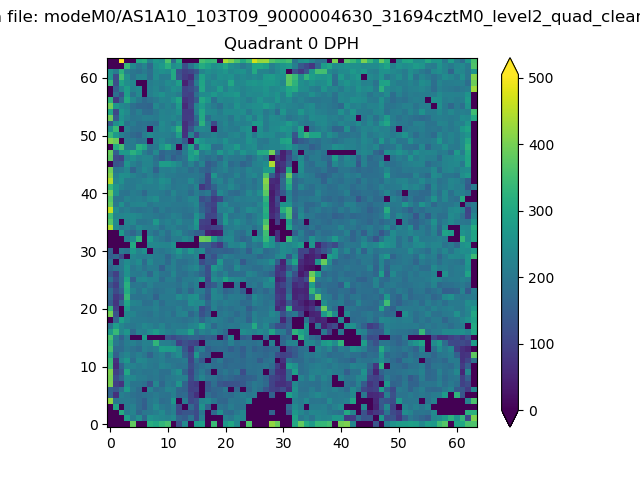 |
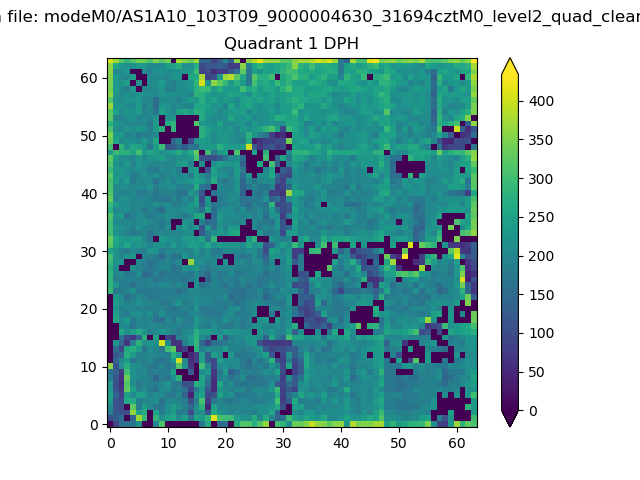 |
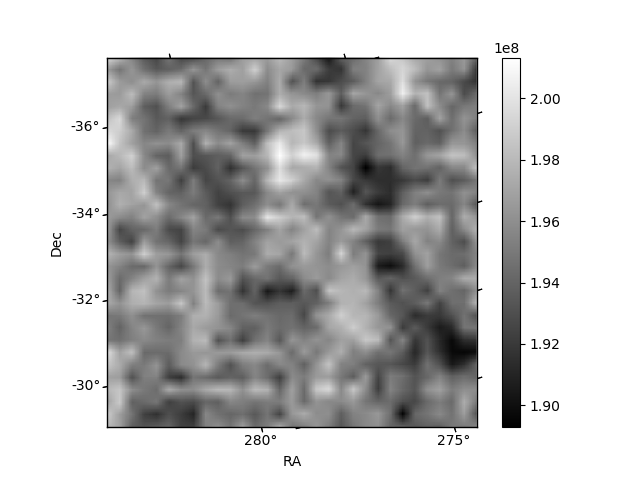
Quadrant B |
|---|---|---|---|
| Quadrant D | 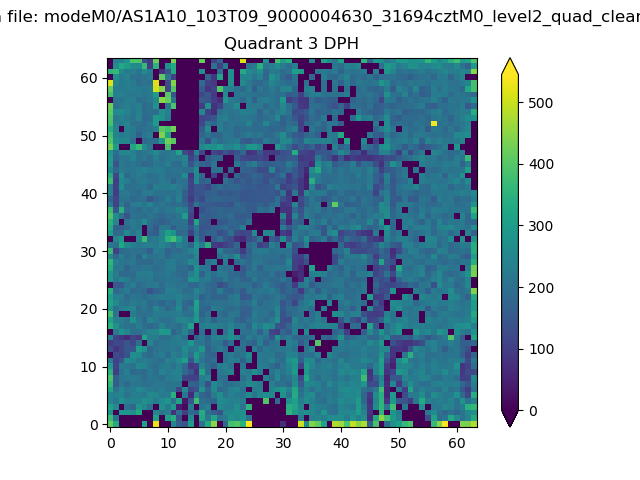 |
 |
Quadrant C |
| Plot type | Count rate plots | Images |
|---|---|---|
| Comparison with Poisson distribution Blue bars denote a histogram of data divided into 1 sec bins. Red curve is a Poisson curve with rate = median count rate of data. |
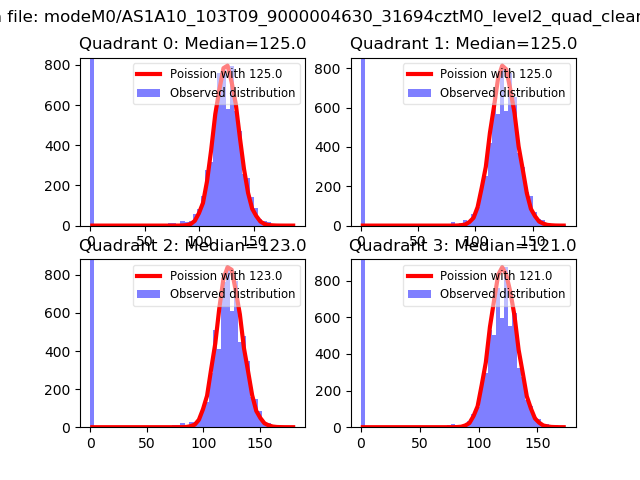 |
 |
| Quadrant-wise count rates Data is divided into 100 sec bins |
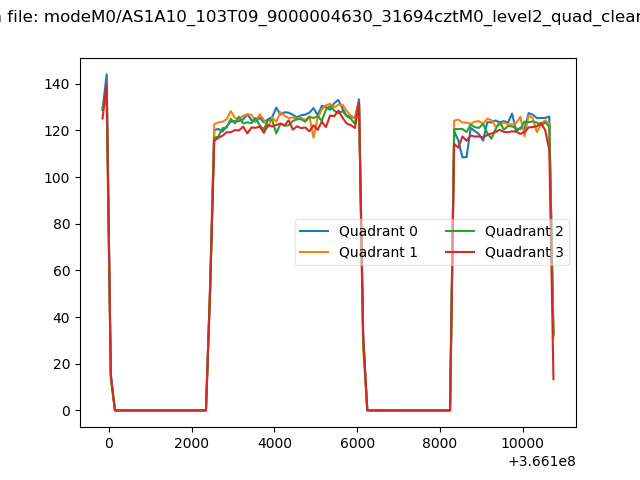 |
|
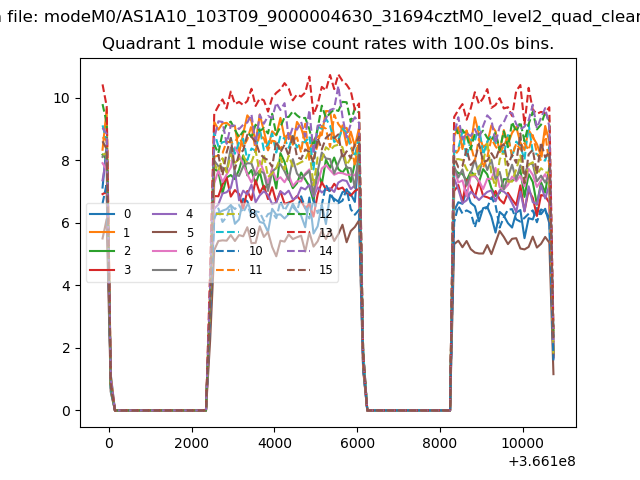
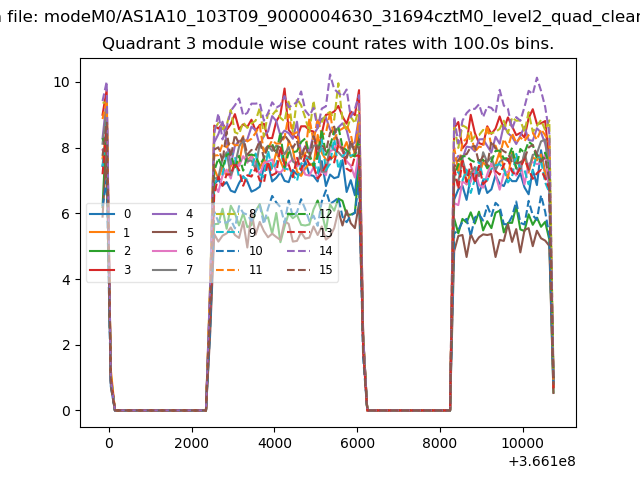
| Module-wise count rates for Quadrant A Data is divided into 100 sec bins |
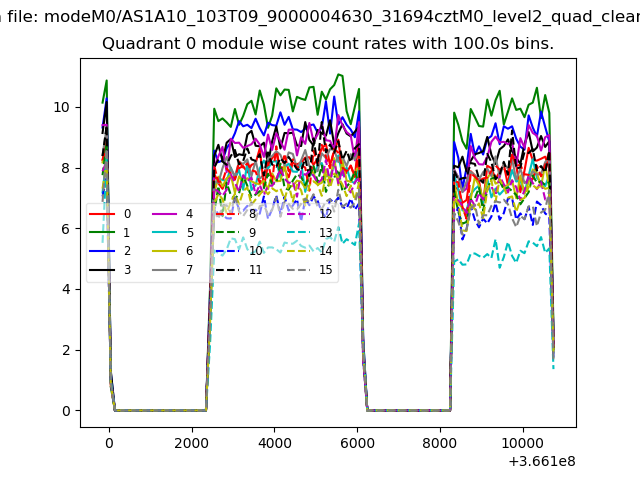 |
 |
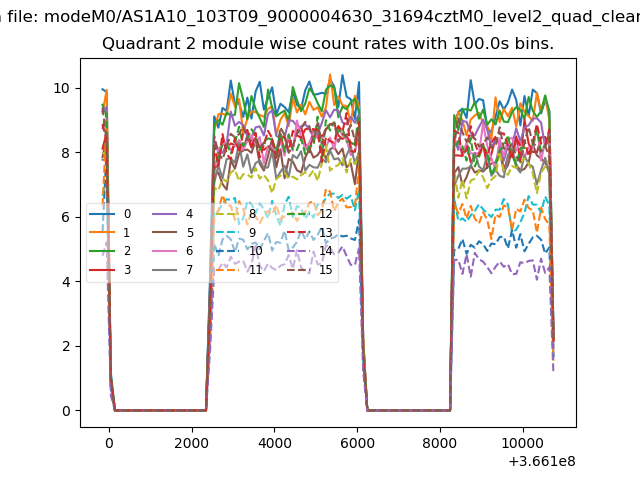
| Module-wise count rates for Quadrant B Data is divided into 100 sec bins |
 |
 |
| Module-wise count rates for Quadrant C Data is divided into 100 sec bins |
 |
 |
| Module-wise count rates for Quadrant D Data is divided into 100 sec bins |
 |
 |
| Parameter | Plot |
|---|---|
| CZT HV Monitor | 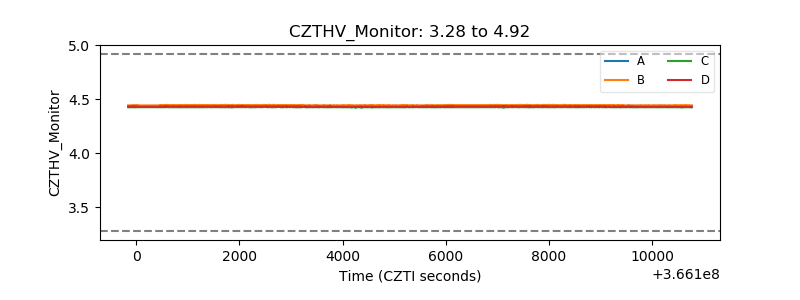 |
| D_VDD |  |
| Temperature 1 | 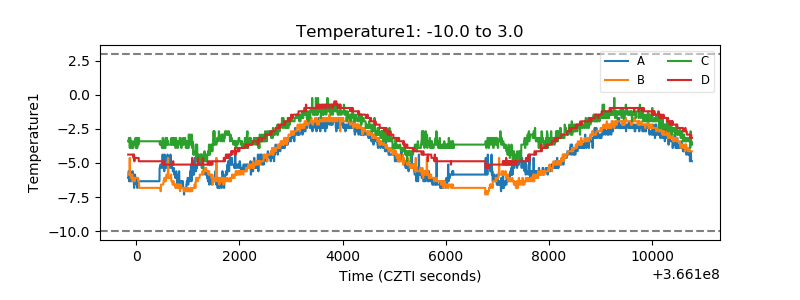 |
| Veto HV Monitor |  |
| Veto LLD | 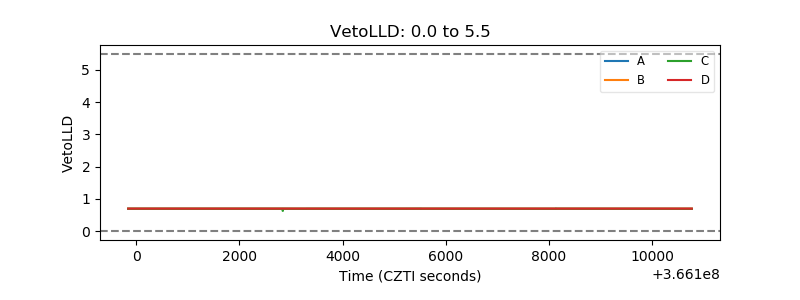 |
| Alpha Counter | 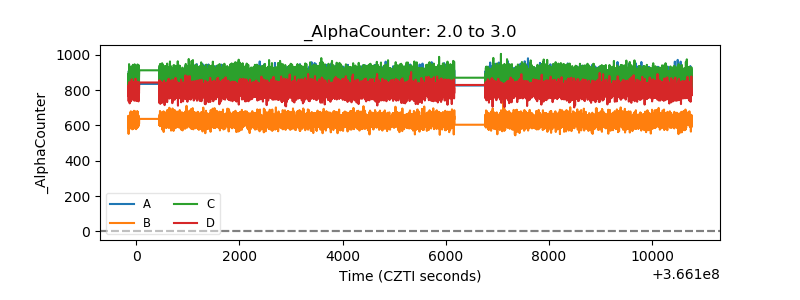 |
| _CPM_Rate | 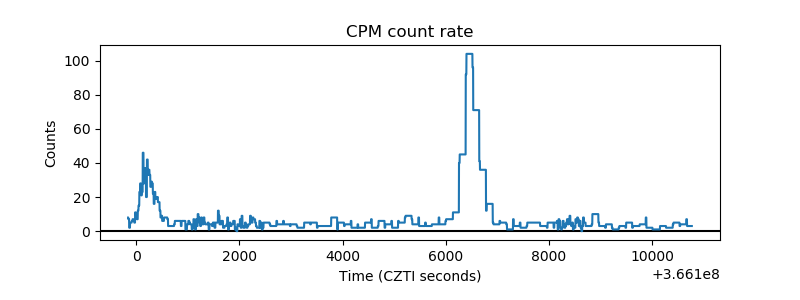 |
| CZT Counter | 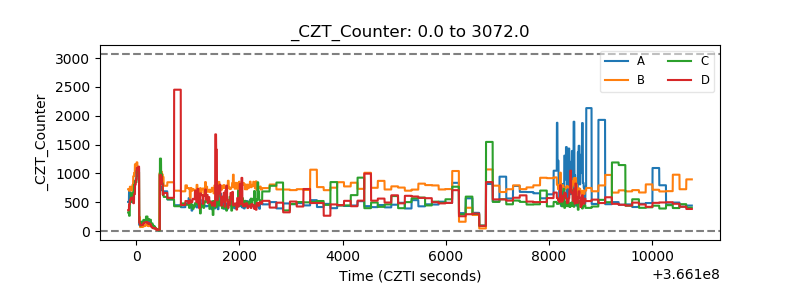 |
| +2.5 Volts monitor |  |
| +5 Volts monitor |  |
| _ROLL_ROT | 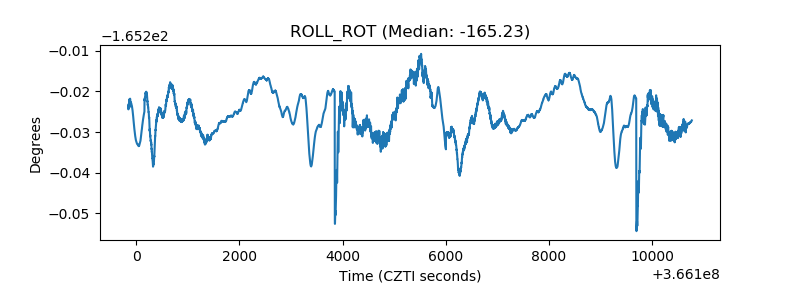 |
| _Roll_DEC | 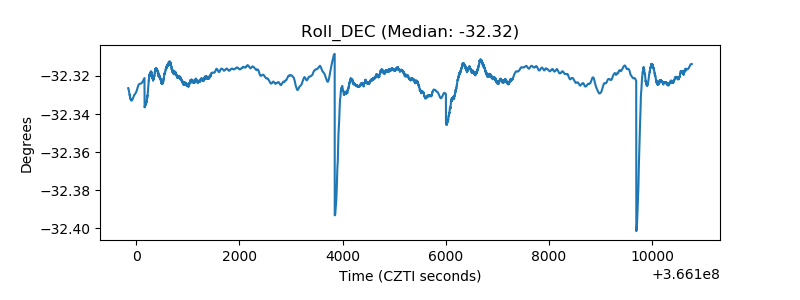 |
| _Roll_RA |  |
| Veto Counter | 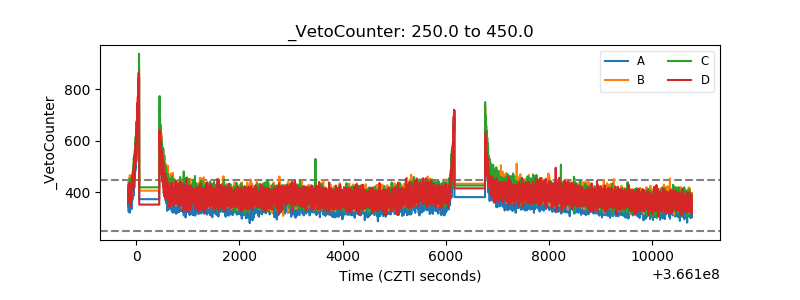 |