| Param | Original file | Final file |
|---|---|---|
| Filename | modeM0/AS1T04_034T01_9000004632cztM0_level2.fits | modeM0/AS1T04_034T01_9000004632cztM0_level2_quad_clean.evt |
| Size (bytes) | 1,173,231,360 | 848,269,440 |
| Size | 1.1 GB | 809.0 MB |
| Events in quadrant A | 7,327,924 | 4,651,851 |
| Events in quadrant B | 6,814,946 | 4,630,823 |
| Events in quadrant C | 7,219,028 | 4,480,494 |
| Events in quadrant D | 6,432,346 | 4,191,258 |
| Mode M9 | |||
|---|---|---|---|
| Quadrant | BADHDUFLAG | Total packets | Discarded packets |
| A | 0 | 211 | 0 |
| B | 0 | 212 | 0 |
| C | 0 | 212 | 0 |
| D | 0 | 212 | 0 |
| Mode SS | |||
|---|---|---|---|
| Quadrant | BADHDUFLAG | Total packets | Discarded packets |
| A | 0 | 2304 | 0 |
| B | 0 | 2302 | 0 |
| C | 0 | 2298 | 0 |
| D | 0 | 2298 | 0 |
| Mode M0 | |||
|---|---|---|---|
| Quadrant | BADHDUFLAG | Total packets | Discarded packets |
| A | 0 | 289910 | 0 |
| B | 0 | 376521 | 0 |
| C | 0 | 286719 | 0 |
| D | 0 | 298902 | 0 |
| Quadrant | Total seconds | Saturated seconds | Saturation percentage |
|---|---|---|---|
| A | 112880 | 5553 | 4.919383% |
| B | 112807 | 7264 | 6.439317% |
| C | 112832 | 4950 | 4.387053% |
| D | 112759 | 3364 | 2.983354% |
Noise dominated data is calculated using 1-second bins in cleaned event files. If a bin has >2000 counts, and if more than 50% of those come from <1% of pixels, then it is considered to be noise-dominated and hence unusable.
| Quadrant | # 1 sec bins | Bins with >0 counts | Bins with >2000 counts | High rate bins dominated by noise | Noise dominated (total time) | Noise dominated (detector-on time) | Marked lightcurve |
|---|---|---|---|---|---|---|---|
| A | 338395 | 110131 | 0 | 0 | 0.00% | 0.00% | 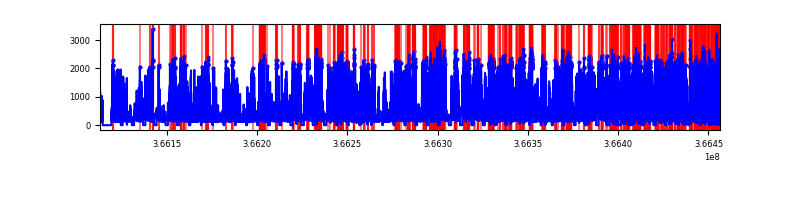 |
| B | 338395 | 109636 | 0 | 0 | 0.00% | 0.00% |  |
| C | 338395 | 110084 | 0 | 0 | 0.00% | 0.00% | 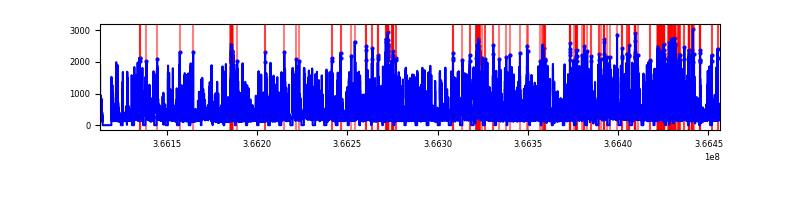 |
| D | 338395 | 109936 | 0 | 0 | 0.00% | 0.00% |  |
Top three noisy pixels from each quadrant. If the there are fewer than three noisy pixels in the level2.evt file, extra rows are filled as -1
| Pixel properties | Quadrant properties | ||||||
|---|---|---|---|---|---|---|---|
| Quadrant | DetID | PixID | Counts | Sigma | Mean | Median | Sigma |
| A | 0 | 29 | 5968 | 9.13 | 1912 | 1799 | 456.4 |
| A | 7 | 110 | 5746 | 8.65 | 1912 | 1799 | 456.4 |
| A | 9 | 19 | 5429 | 7.95 | 1912 | 1799 | 456.4 |
| B | 2 | 9 | 5528 | 10.72 | 1808 | 1733 | 353.9 |
| B | 3 | 80 | 4676 | 8.32 | 1808 | 1733 | 353.9 |
| B | 5 | 128 | 4603 | 8.11 | 1808 | 1733 | 353.9 |
| C | 1 | 81 | 5666 | 8.09 | 1913 | 1807 | 477.2 |
| C | 1 | 80 | 5588 | 7.92 | 1913 | 1807 | 477.2 |
| C | 3 | 187 | 4956 | 6.6 | 1913 | 1807 | 477.2 |
| D | 10 | 189 | 4554 | 5.99 | 1842 | 1692 | 477.4 |
| D | 7 | 3 | 4482 | 5.84 | 1842 | 1692 | 477.4 |
| D | 6 | 231 | 4444 | 5.76 | 1842 | 1692 | 477.4 |
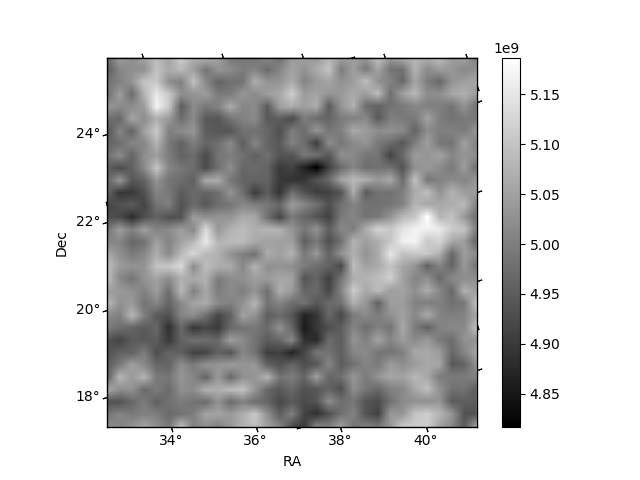
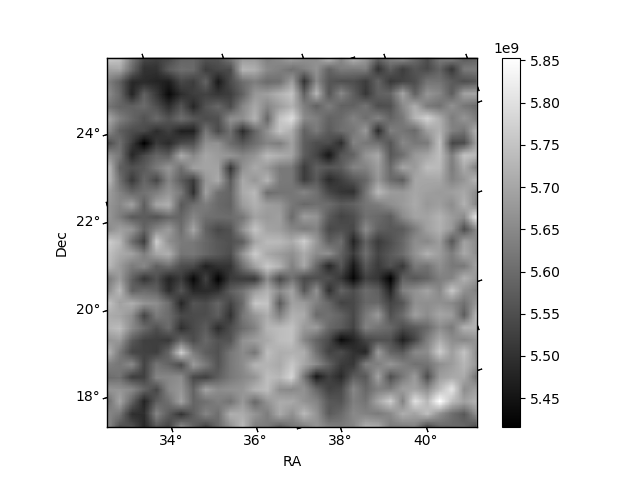
Histogram calculated using DETX and DETY for each event in the final _common_clean file
| Quadrant A |  |
 |
Quadrant B |
|---|---|---|---|
| Quadrant D |  |
 |
Quadrant C |
| Plot type | Count rate plots | Images |
|---|---|---|
| Comparison with Poisson distribution Blue bars denote a histogram of data divided into 1 sec bins. Red curve is a Poisson curve with rate = median count rate of data. |
 |
 |
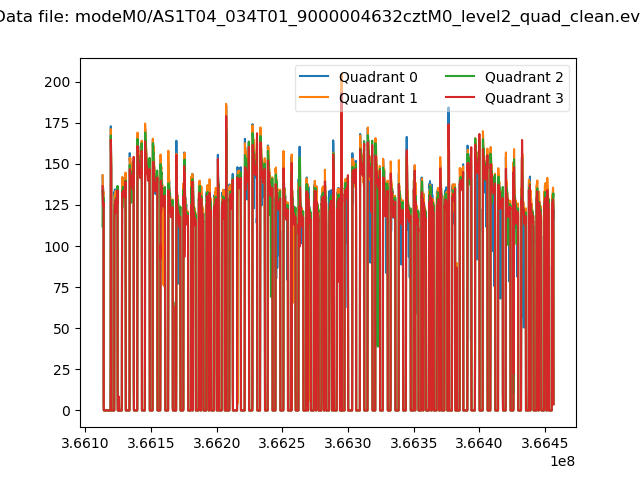
| Quadrant-wise count rates Data is divided into 100 sec bins |
 |
|
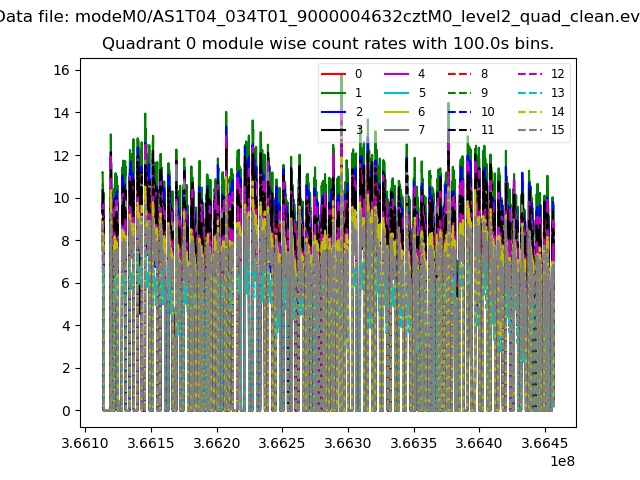
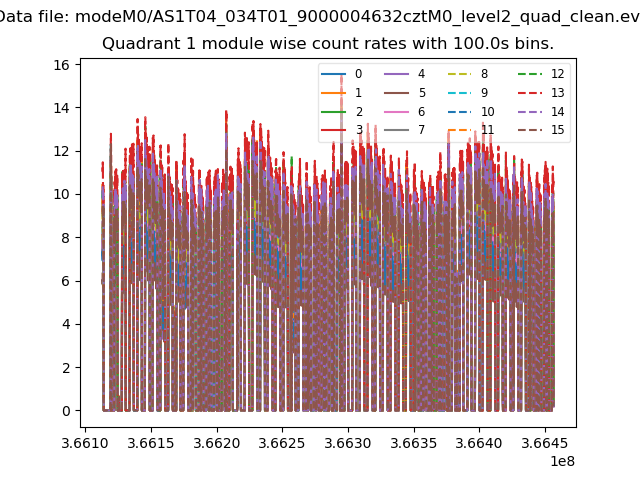
| Module-wise count rates for Quadrant A Data is divided into 100 sec bins |
 |
 |
| Module-wise count rates for Quadrant B Data is divided into 100 sec bins |
 |
 |
| Module-wise count rates for Quadrant C Data is divided into 100 sec bins |
 |
 |
| Module-wise count rates for Quadrant D Data is divided into 100 sec bins |
 |
 |
| Parameter | Plot |
|---|---|
| CZT HV Monitor | 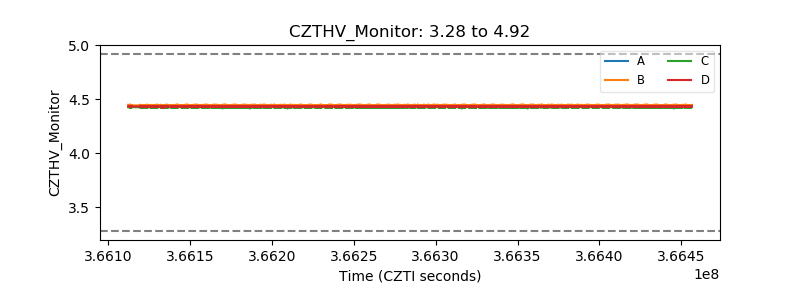 |
| D_VDD |  |
| Temperature 1 |  |
| Veto HV Monitor |  |
| Veto LLD |  |
| Alpha Counter |  |
| _CPM_Rate |  |
| CZT Counter | 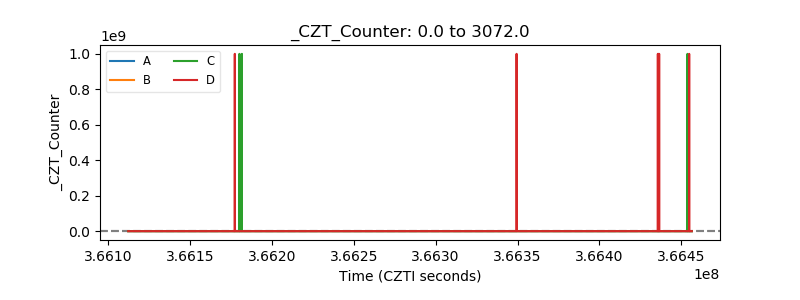 |
| +2.5 Volts monitor |  |
| +5 Volts monitor |  |
| _ROLL_ROT | 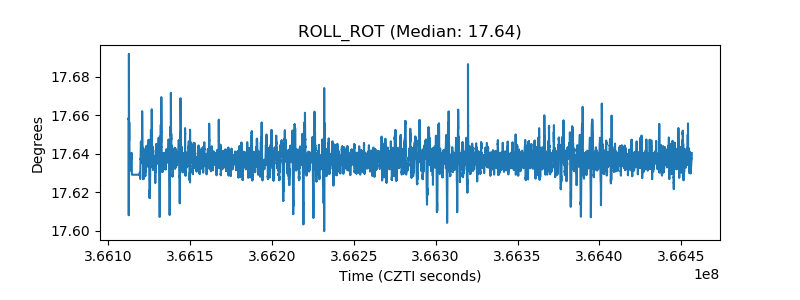 |
| _Roll_DEC |  |
| _Roll_RA |  |
| Veto Counter | 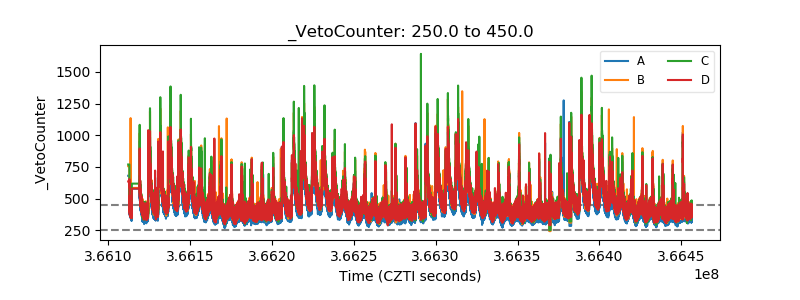 |