| Param | Original file | Final file |
|---|---|---|
| Filename | modeM0/AS1T04_034T01_9000004632_31694cztM0_level2.evt | modeM0/AS1T04_034T01_9000004632_31694cztM0_level2_quad_clean.evt |
| Size (bytes) | 121,164,480 | 19,247,040 |
| Size | 115.6 MB | 18.4 MB |
| Events in quadrant A | 749,203 | 120,916 |
| Events in quadrant B | 1,106,656 | 122,155 |
| Events in quadrant C | 915,329 | 114,938 |
| Events in quadrant D | 797,138 | 116,586 |
| Mode M9 | |||
|---|---|---|---|
| Quadrant | BADHDUFLAG | Total packets | Discarded packets |
| A | 0 | 8 | 0 |
| B | 0 | 8 | 0 |
| C | 0 | 8 | 0 |
| D | 0 | 8 | 0 |
| Mode SS | |||
|---|---|---|---|
| Quadrant | BADHDUFLAG | Total packets | Discarded packets |
| A | 0 | 30 | 0 |
| B | 0 | 30 | 0 |
| C | 0 | 30 | 0 |
| D | 0 | 30 | 0 |
| Mode M0 | |||
|---|---|---|---|
| Quadrant | BADHDUFLAG | Total packets | Discarded packets |
| A | 0 | 3053 | 1 |
| B | 0 | 4375 | 1 |
| C | 0 | 3673 | 1 |
| D | 0 | 3253 | 1 |
| Quadrant | Total seconds | Saturated seconds | Saturation percentage |
|---|---|---|---|
| A | 1454 | 10 | 0.687758% |
| B | 1454 | 11 | 0.756534% |
| C | 1453 | 47 | 3.234687% |
| D | 1453 | 1 | 0.068823% |
Noise dominated data is calculated using 1-second bins in cleaned event files. If a bin has >2000 counts, and if more than 50% of those come from <1% of pixels, then it is considered to be noise-dominated and hence unusable.
| Quadrant | # 1 sec bins | Bins with >0 counts | Bins with >2000 counts | High rate bins dominated by noise | Noise dominated (total time) | Noise dominated (detector-on time) | Marked lightcurve |
|---|---|---|---|---|---|---|---|
| A | 1454 | 1454 | 0 | 0 | 0.00% | 0.00% | 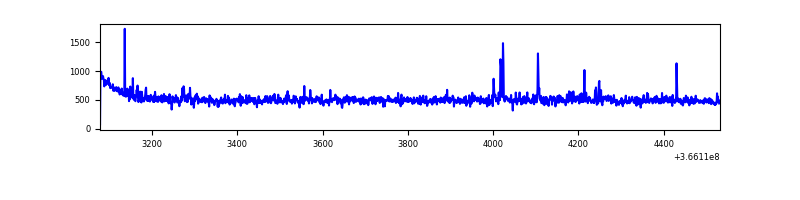 |
| B | 1454 | 1454 | 0 | 0 | 0.00% | 0.00% | 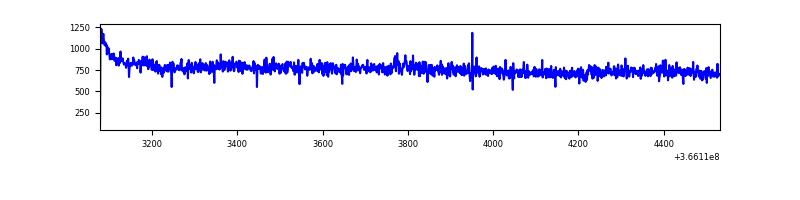 |
| C | 1453 | 1453 | 21 | 21 | 1.45% | 1.45% | 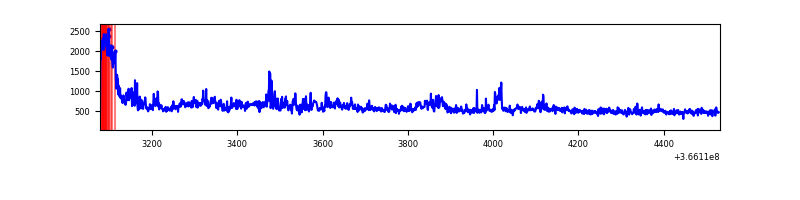 |
| D | 1453 | 1453 | 0 | 0 | 0.00% | 0.00% | 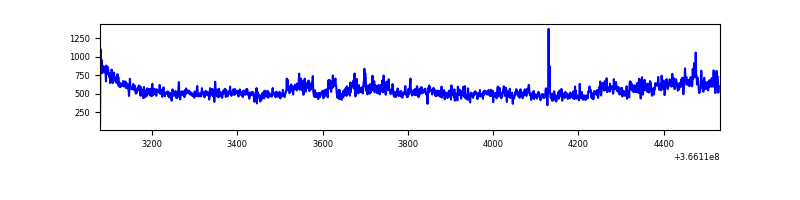 |
Top three noisy pixels from each quadrant. If the there are fewer than three noisy pixels in the level2.evt file, extra rows are filled as -1
| Pixel properties | Quadrant properties | ||||||
|---|---|---|---|---|---|---|---|
| Quadrant | DetID | PixID | Counts | Sigma | Mean | Median | Sigma |
| A | 0 | 13 | 23271 | 585.09 | 186 | 182 | 39.5 |
| A | 14 | 238 | 6140 | 150.98 | 186 | 182 | 39.5 |
| A | 13 | 254 | 2595 | 61.15 | 186 | 182 | 39.5 |
| B | 6 | 159 | 385323 | 10364.67 | 181 | 177 | 37.2 |
| B | 12 | 111 | 4512 | 116.66 | 181 | 177 | 37.2 |
| B | 11 | 111 | 4258 | 109.82 | 181 | 177 | 37.2 |
| C | 3 | 233 | 138125 | 3295.14 | 170 | 170 | 41.9 |
| C | 0 | 10 | 68015 | 1620.52 | 170 | 170 | 41.9 |
| C | 14 | 238 | 27121 | 643.74 | 170 | 170 | 41.9 |
| D | 8 | 195 | 108785 | 2471.64 | 177 | 172 | 43.9 |
| D | 10 | 203 | 6685 | 148.21 | 177 | 172 | 43.9 |
| D | 2 | 234 | 4843 | 106.3 | 177 | 172 | 43.9 |
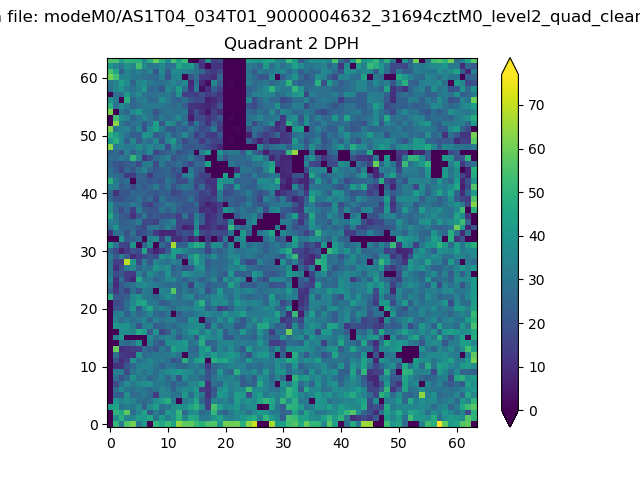
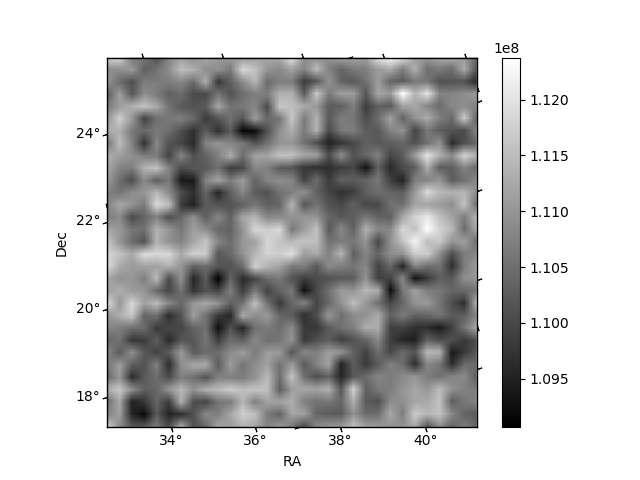
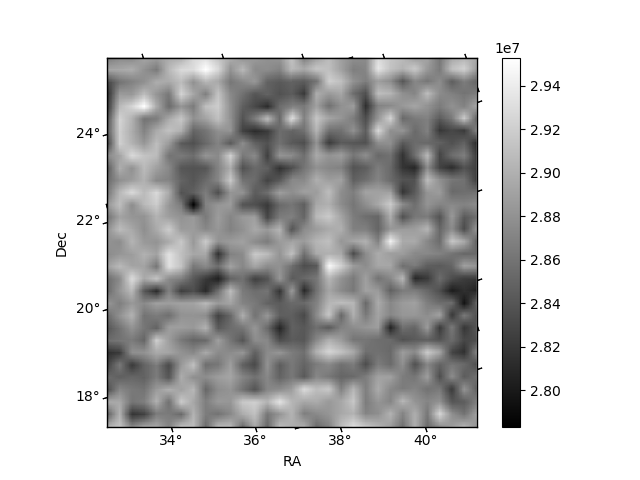
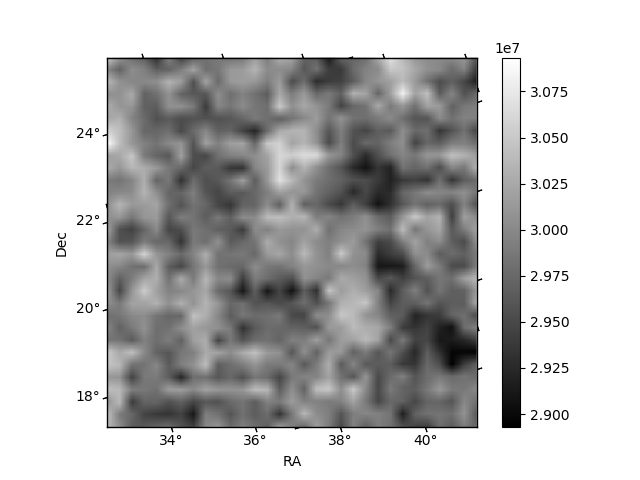
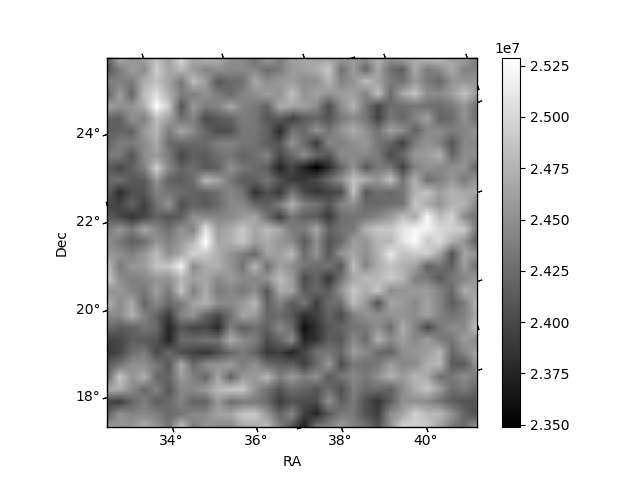
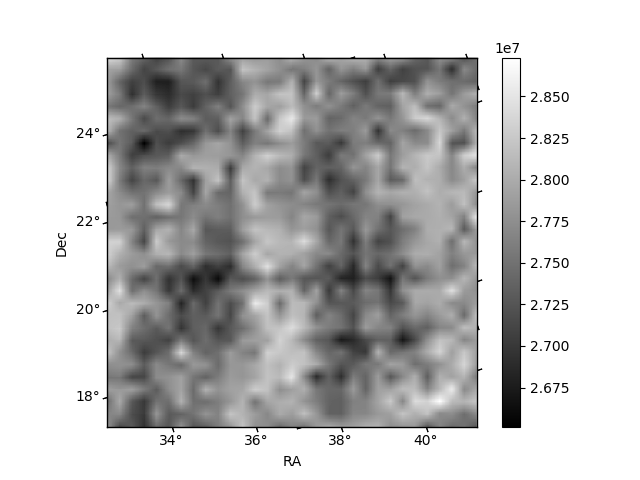
Histogram calculated using DETX and DETY for each event in the final _common_clean file
| Quadrant A | 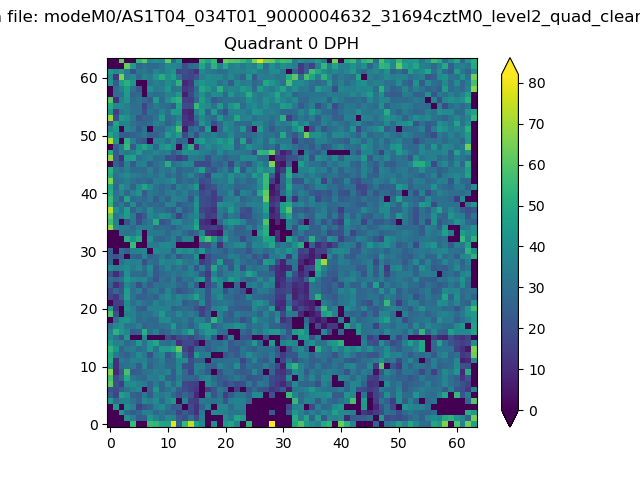 |
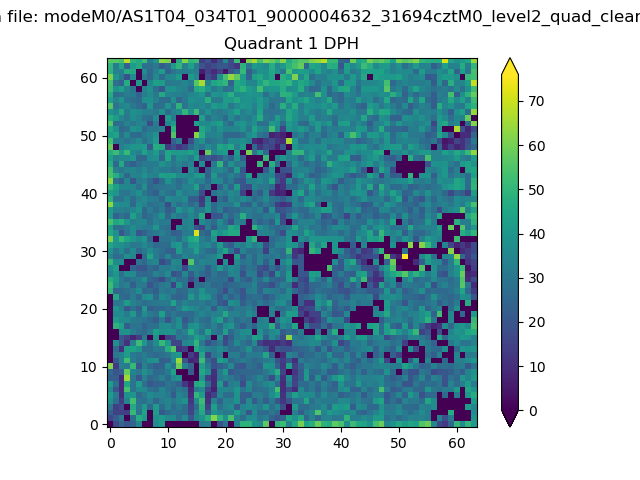 |
Quadrant B |
|---|---|---|---|
| Quadrant D | 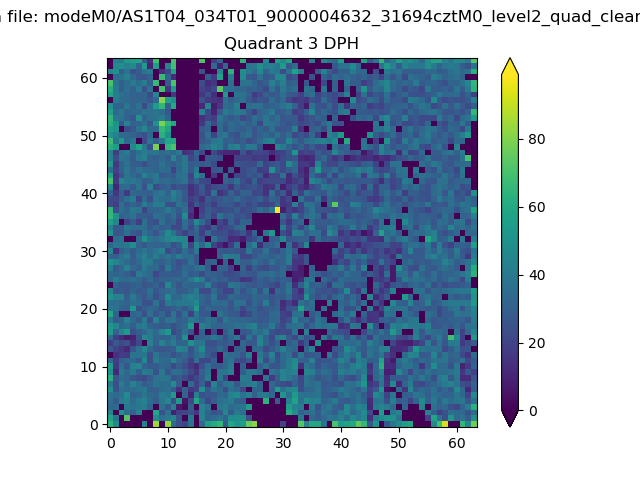 |
 |
Quadrant C |
| Plot type | Count rate plots | Images |
|---|---|---|
| Comparison with Poisson distribution Blue bars denote a histogram of data divided into 1 sec bins. Red curve is a Poisson curve with rate = median count rate of data. |
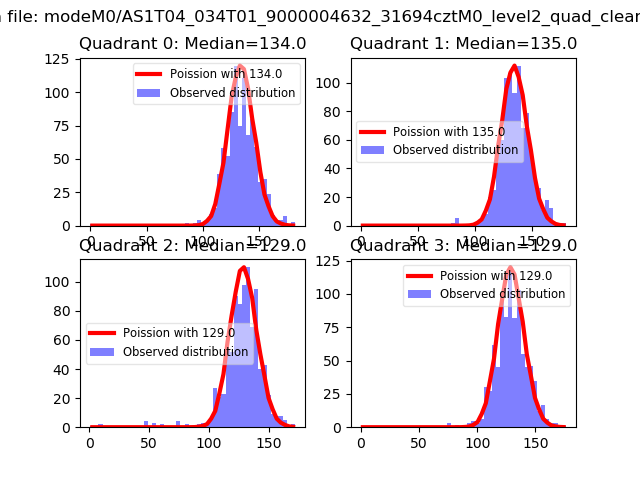 |
 |
| Quadrant-wise count rates Data is divided into 100 sec bins |
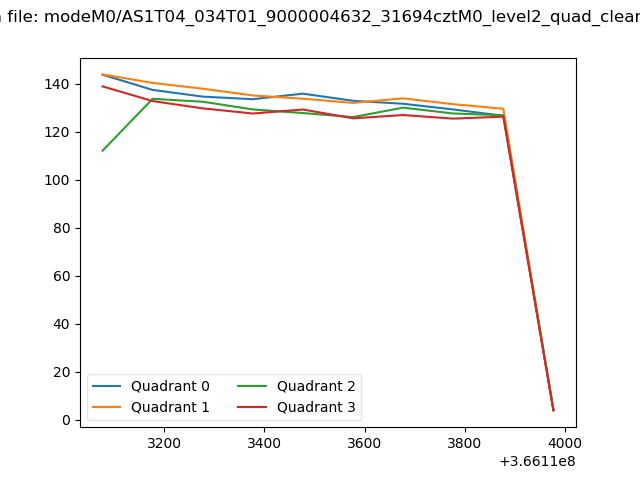 |
|
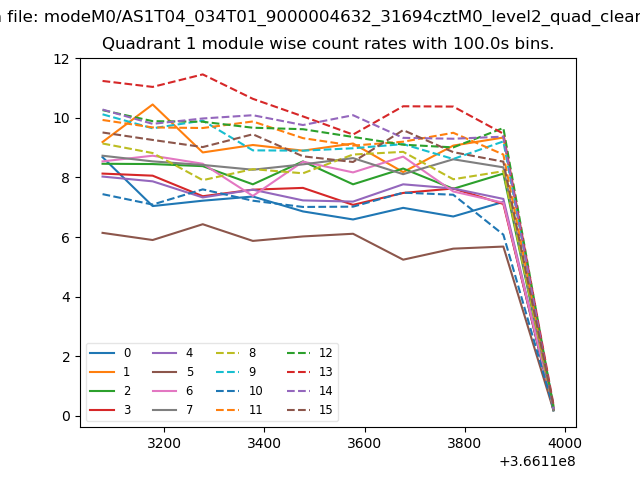
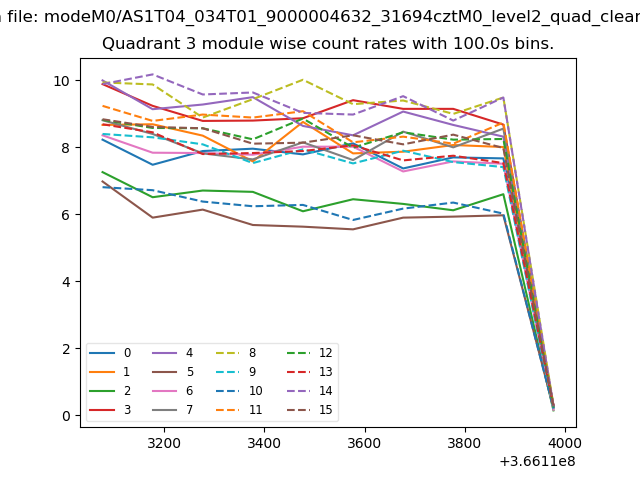
| Module-wise count rates for Quadrant A Data is divided into 100 sec bins |
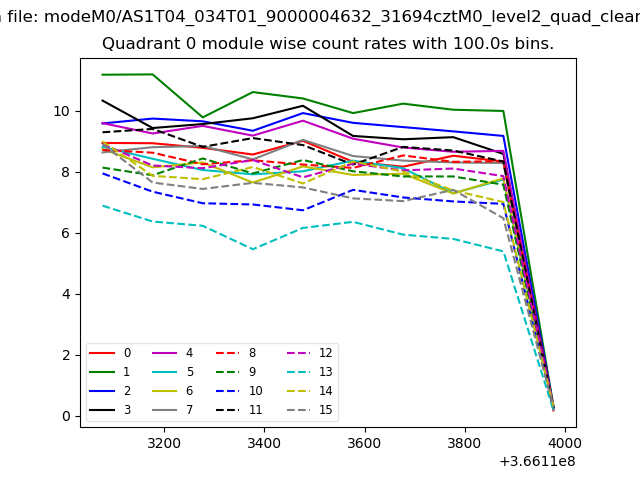 |
 |
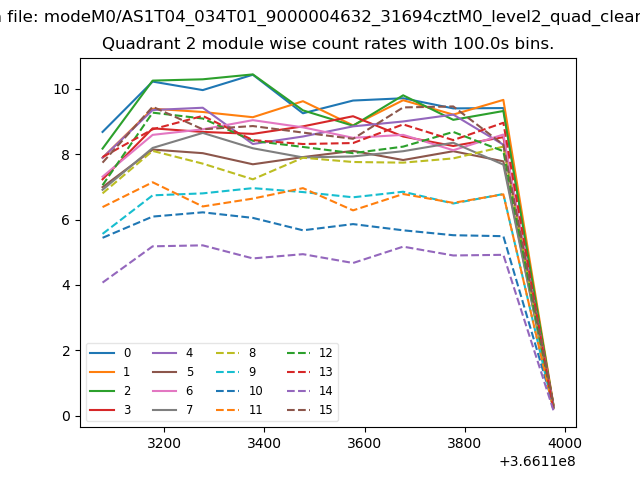
| Module-wise count rates for Quadrant B Data is divided into 100 sec bins |
 |
 |
| Module-wise count rates for Quadrant C Data is divided into 100 sec bins |
 |
 |
| Module-wise count rates for Quadrant D Data is divided into 100 sec bins |
 |
 |
| Parameter | Plot |
|---|---|
| CZT HV Monitor |  |
| D_VDD | 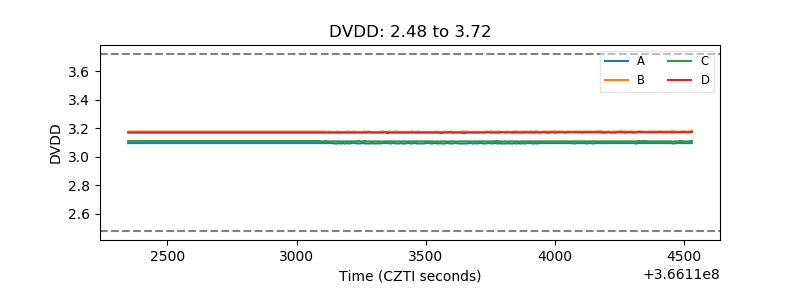 |
| Temperature 1 | 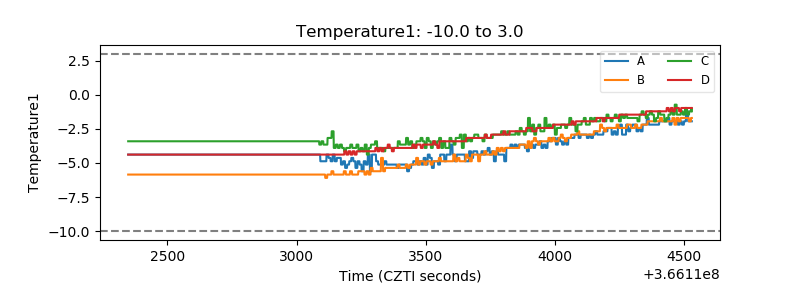 |
| Veto HV Monitor | 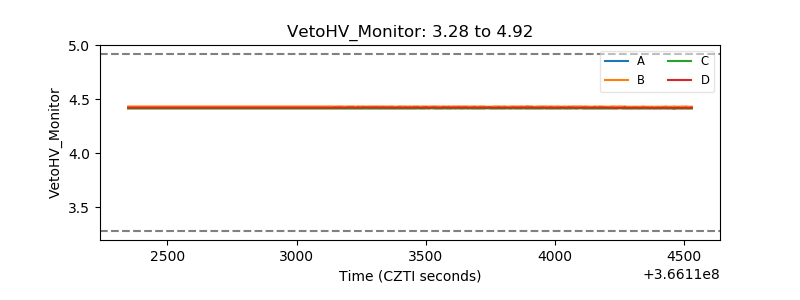 |
| Veto LLD | 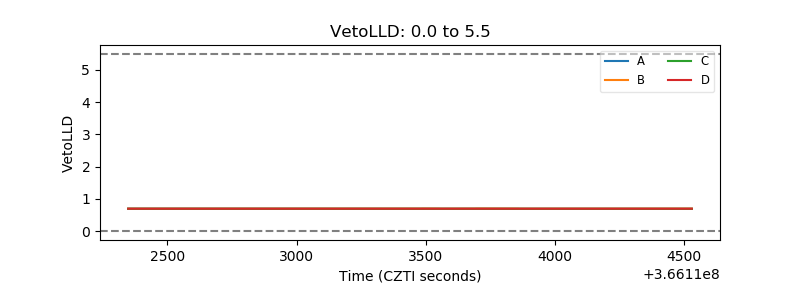 |
| Alpha Counter | 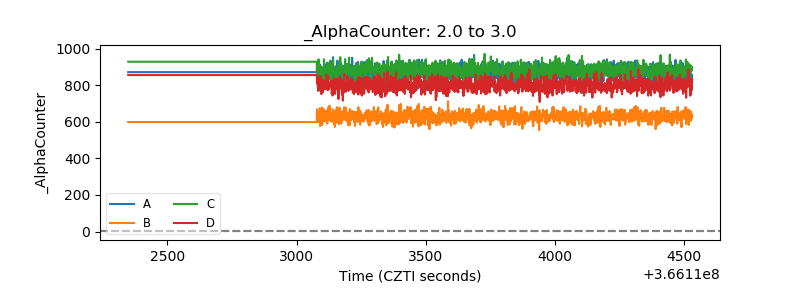 |
| _CPM_Rate | 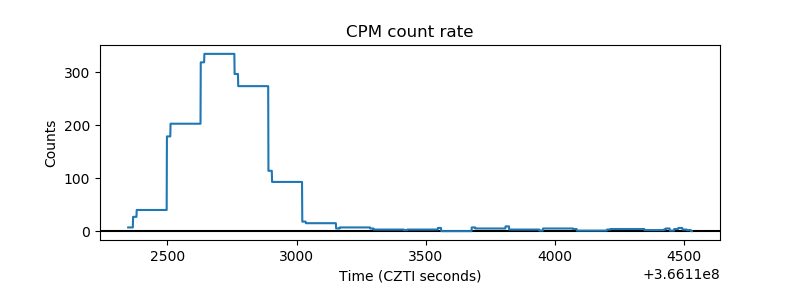 |
| CZT Counter | 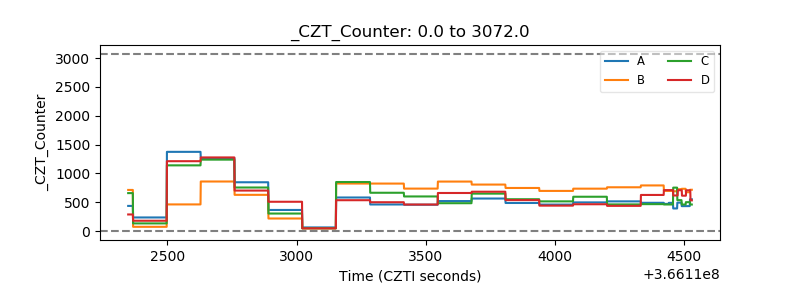 |
| +2.5 Volts monitor |  |
| +5 Volts monitor |  |
| _ROLL_ROT | 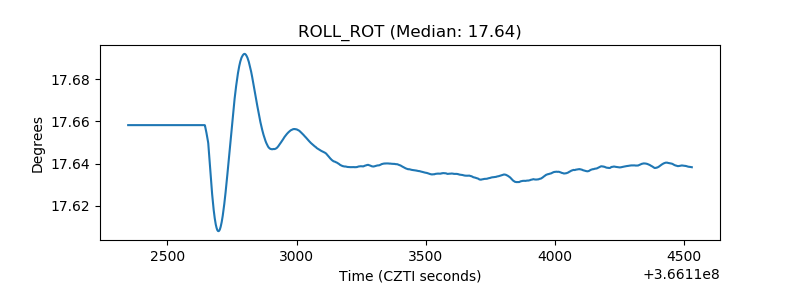 |
| _Roll_DEC | 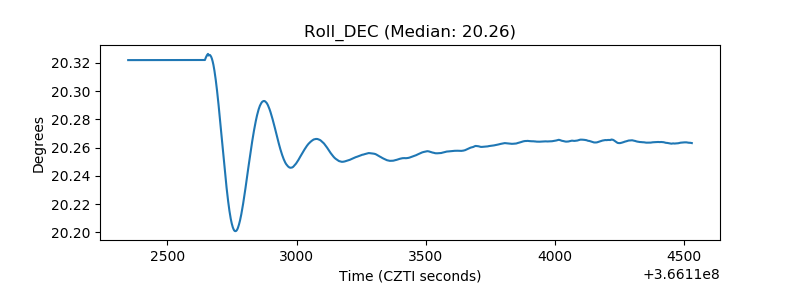 |
| _Roll_RA | 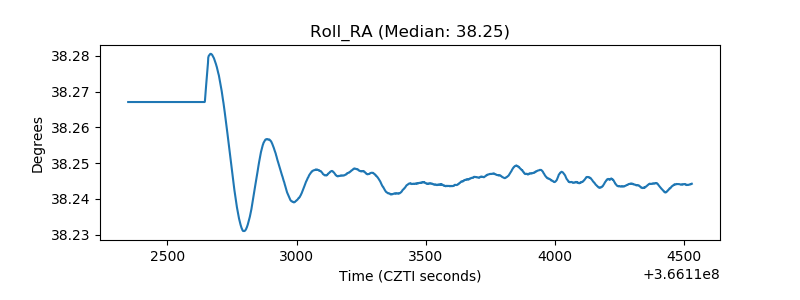 |
| Veto Counter | 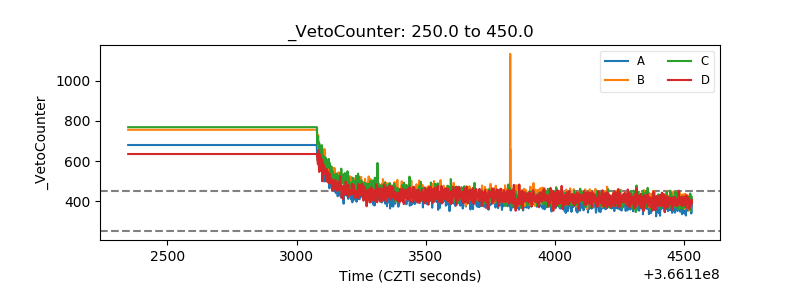 |