| Param | Original file | Final file |
|---|---|---|
| Filename | modeM0/AS1T04_034T01_9000004632_31696cztM0_level2.evt | modeM0/AS1T04_034T01_9000004632_31696cztM0_level2_quad_clean.evt |
| Size (bytes) | 636,606,720 | 67,648,320 |
| Size | 607.1 MB | 64.5 MB |
| Events in quadrant A | 4,083,476 | 405,163 |
| Events in quadrant B | 5,470,117 | 405,237 |
| Events in quadrant C | 4,117,226 | 388,926 |
| Events in quadrant D | 5,157,502 | 382,991 |
| Mode M9 | |||
|---|---|---|---|
| Quadrant | BADHDUFLAG | Total packets | Discarded packets |
| A | 0 | 11 | 0 |
| B | 0 | 12 | 0 |
| C | 0 | 12 | 0 |
| D | 0 | 12 | 0 |
| Mode SS | |||
|---|---|---|---|
| Quadrant | BADHDUFLAG | Total packets | Discarded packets |
| A | 0 | 134 | 0 |
| B | 0 | 134 | 0 |
| C | 0 | 134 | 0 |
| D | 0 | 134 | 0 |
| Mode M0 | |||
|---|---|---|---|
| Quadrant | BADHDUFLAG | Total packets | Discarded packets |
| A | 0 | 16333 | 2 |
| B | 0 | 20780 | 2 |
| C | 0 | 16421 | 2 |
| D | 0 | 20071 | 2 |
| Quadrant | Total seconds | Saturated seconds | Saturation percentage |
|---|---|---|---|
| A | 6687 | 261 | 3.903096% |
| B | 6687 | 161 | 2.407657% |
| C | 6687 | 242 | 3.618962% |
| D | 6687 | 188 | 2.811425% |
Noise dominated data is calculated using 1-second bins in cleaned event files. If a bin has >2000 counts, and if more than 50% of those come from <1% of pixels, then it is considered to be noise-dominated and hence unusable.
| Quadrant | # 1 sec bins | Bins with >0 counts | Bins with >2000 counts | High rate bins dominated by noise | Noise dominated (total time) | Noise dominated (detector-on time) | Marked lightcurve |
|---|---|---|---|---|---|---|---|
| A | 7757 | 6688 | 78 | 78 | 1.01% | 1.17% | 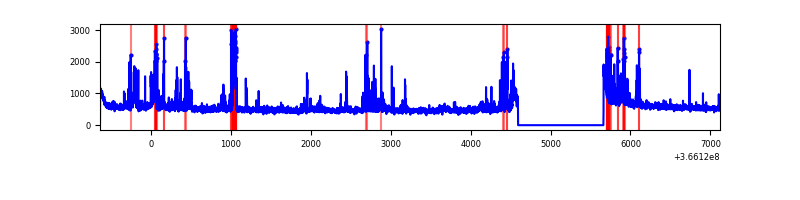 |
| B | 7757 | 6688 | 9 | 9 | 0.12% | 0.13% | 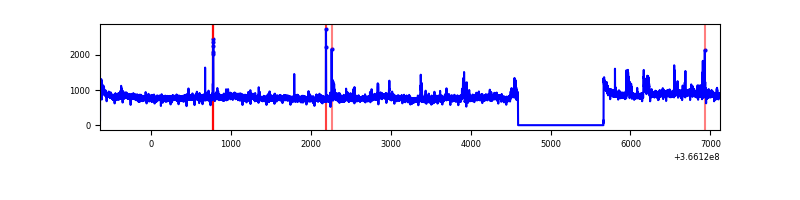 |
| C | 7757 | 6688 | 50 | 50 | 0.64% | 0.75% | 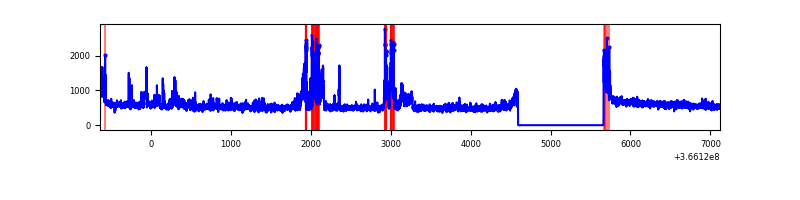 |
| D | 7757 | 6688 | 88 | 88 | 1.13% | 1.32% | 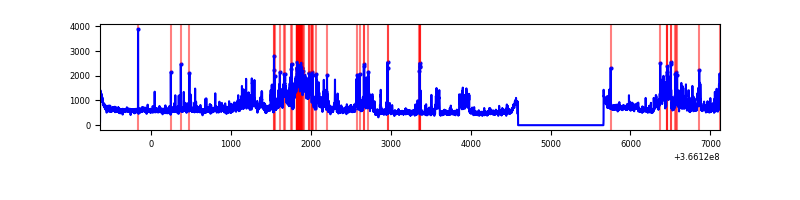 |
Top three noisy pixels from each quadrant. If the there are fewer than three noisy pixels in the level2.evt file, extra rows are filled as -1
| Pixel properties | Quadrant properties | ||||||
|---|---|---|---|---|---|---|---|
| Quadrant | DetID | PixID | Counts | Sigma | Mean | Median | Sigma |
| A | 0 | 13 | 660092 | 3752.12 | 879 | 863 | 175.7 |
| A | 14 | 238 | 23306 | 127.74 | 879 | 863 | 175.7 |
| A | 13 | 254 | 12694 | 67.34 | 879 | 863 | 175.7 |
| B | 6 | 159 | 1779646 | 10663.59 | 871 | 851 | 166.8 |
| B | 4 | 80 | 94094 | 558.98 | 871 | 851 | 166.8 |
| B | 0 | 190 | 65346 | 386.64 | 871 | 851 | 166.8 |
| C | 10 | 22 | 446347 | 2262.09 | 842 | 849 | 196.9 |
| C | 14 | 238 | 138150 | 697.17 | 842 | 849 | 196.9 |
| C | 3 | 233 | 110848 | 558.54 | 842 | 849 | 196.9 |
| D | 12 | 227 | 1017178 | 5025.5 | 856 | 836 | 202.2 |
| D | 8 | 195 | 637482 | 3148.02 | 856 | 836 | 202.2 |
| D | 2 | 250 | 89746 | 439.63 | 856 | 836 | 202.2 |
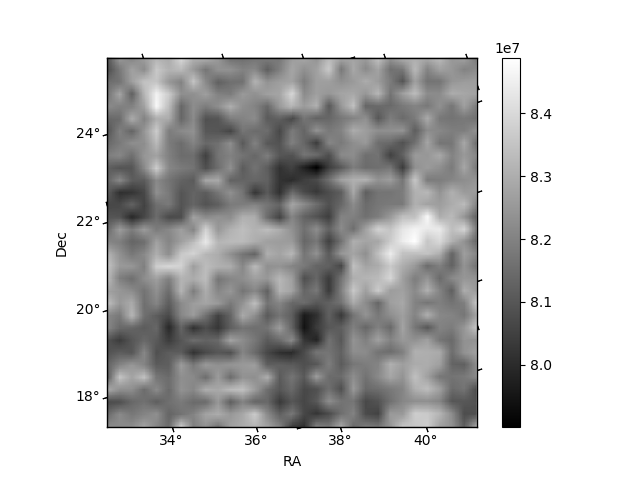
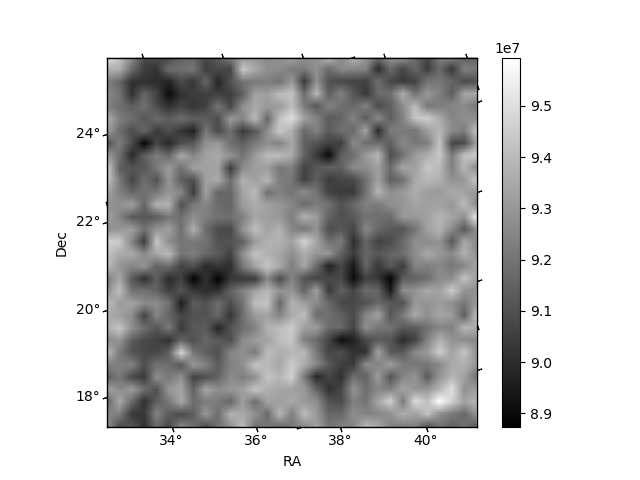
Histogram calculated using DETX and DETY for each event in the final _common_clean file
| Quadrant A | 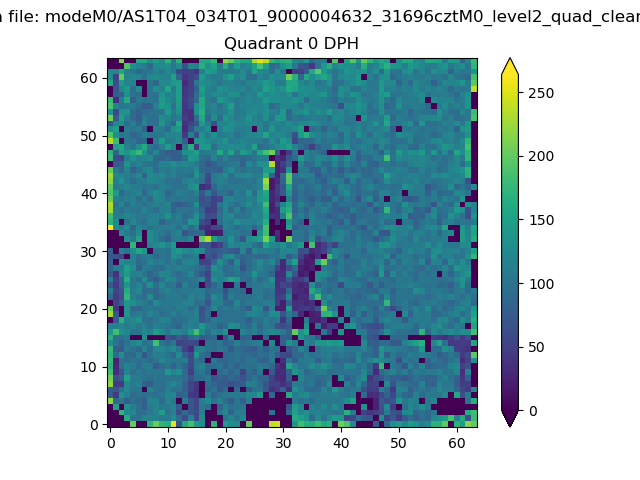 |
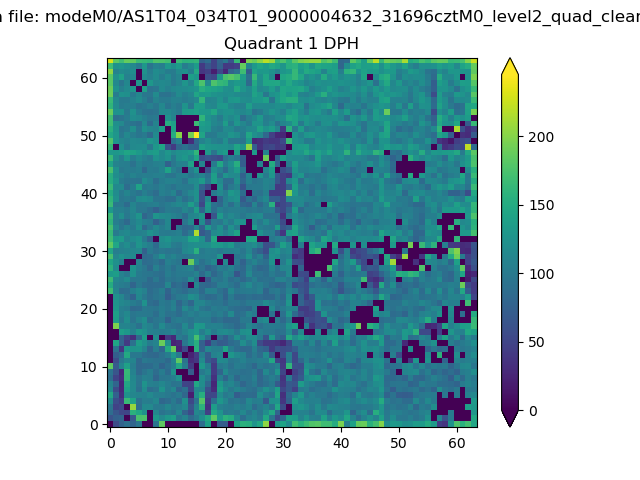 |
Quadrant B |
|---|---|---|---|
| Quadrant D | 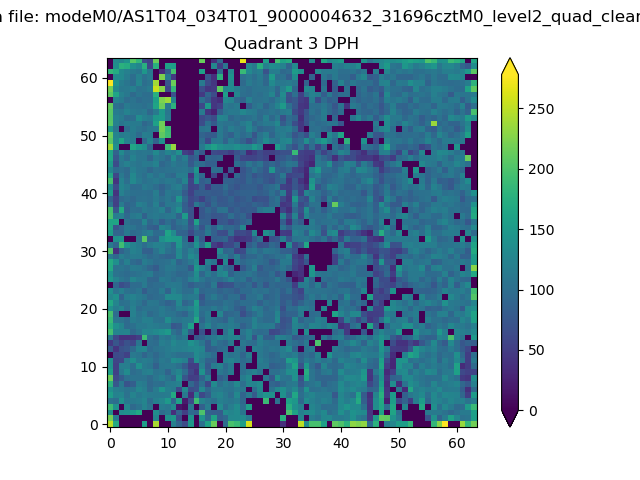 |
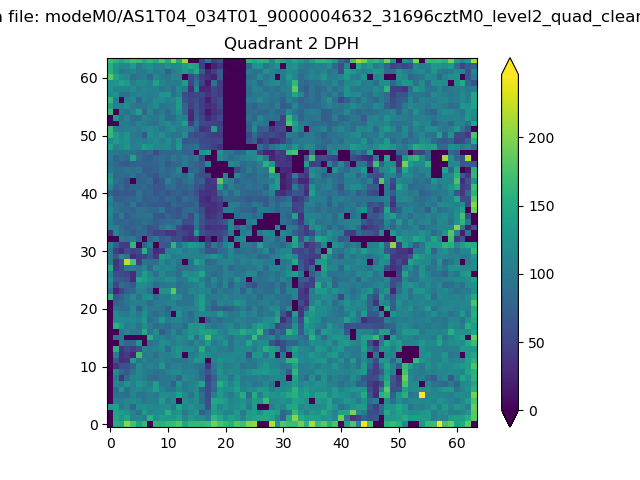 |
Quadrant C |
| Plot type | Count rate plots | Images |
|---|---|---|
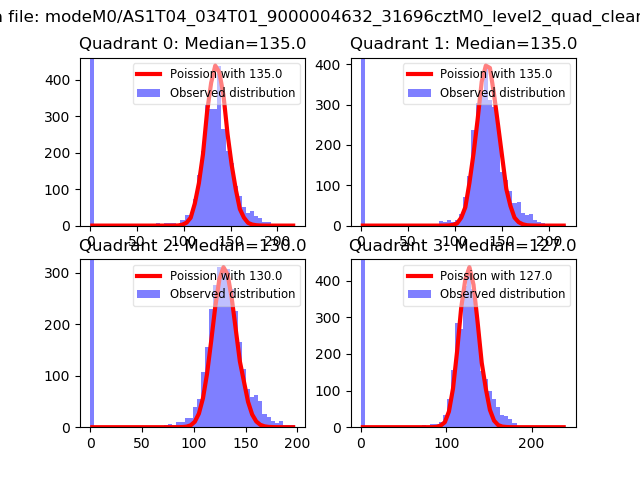
| Comparison with Poisson distribution Blue bars denote a histogram of data divided into 1 sec bins. Red curve is a Poisson curve with rate = median count rate of data. |
 |
 |
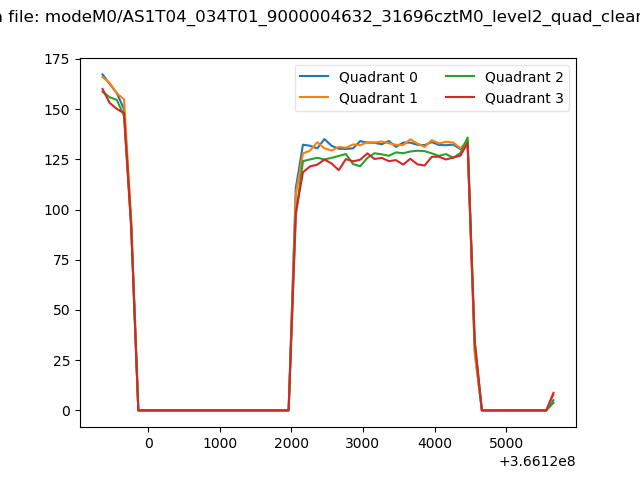
| Quadrant-wise count rates Data is divided into 100 sec bins |
 |
|
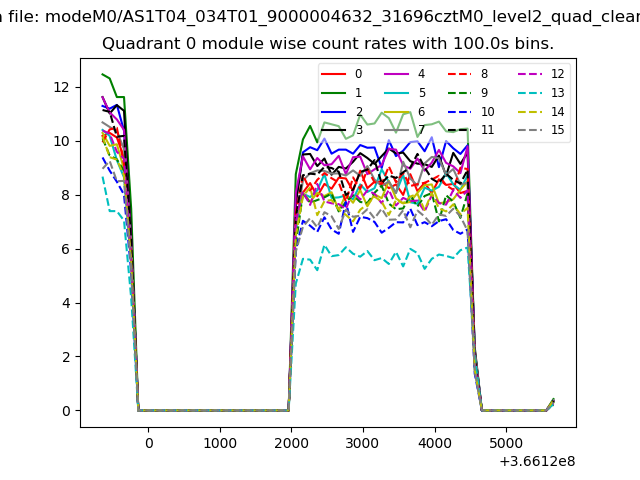
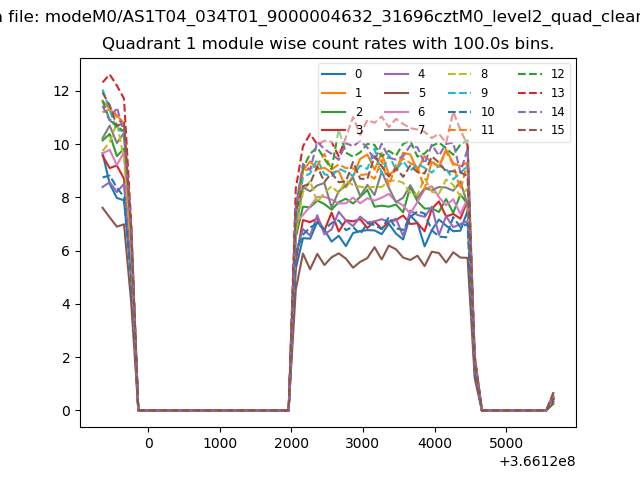
| Module-wise count rates for Quadrant A Data is divided into 100 sec bins |
 |
 |
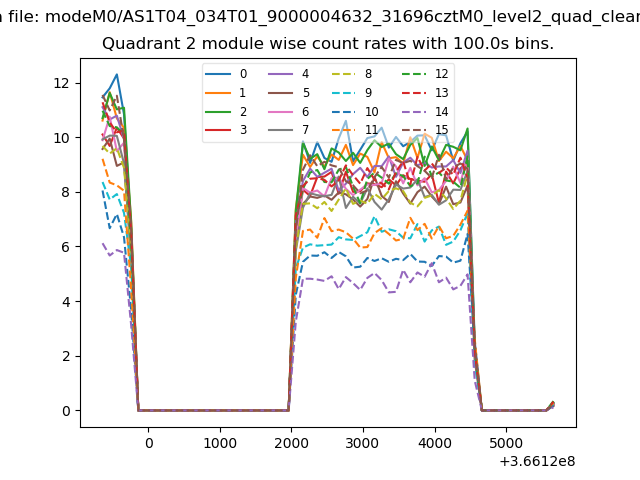
| Module-wise count rates for Quadrant B Data is divided into 100 sec bins |
 |
 |
| Module-wise count rates for Quadrant C Data is divided into 100 sec bins |
 |
 |
| Module-wise count rates for Quadrant D Data is divided into 100 sec bins |
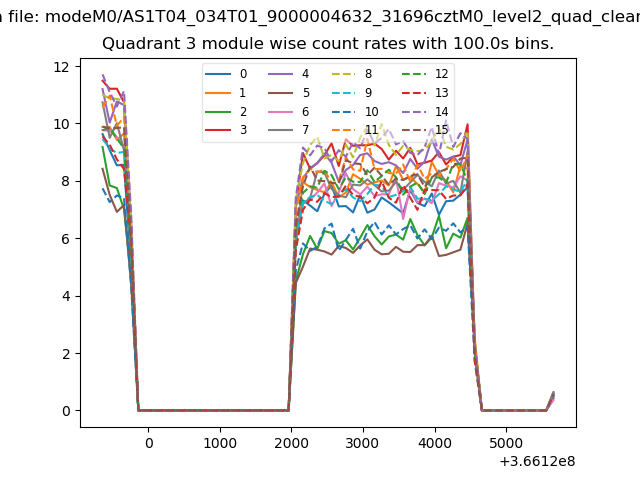 |
 |
| Parameter | Plot |
|---|---|
| CZT HV Monitor | 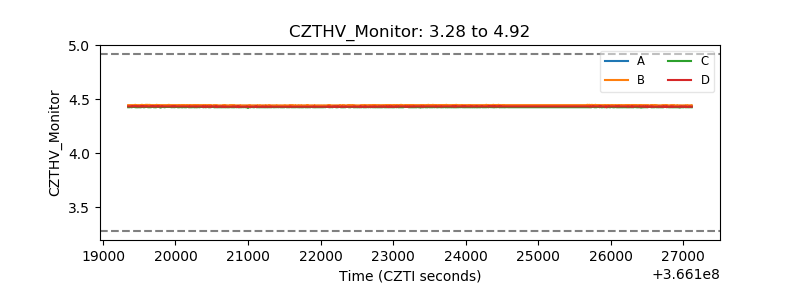 |
| D_VDD | 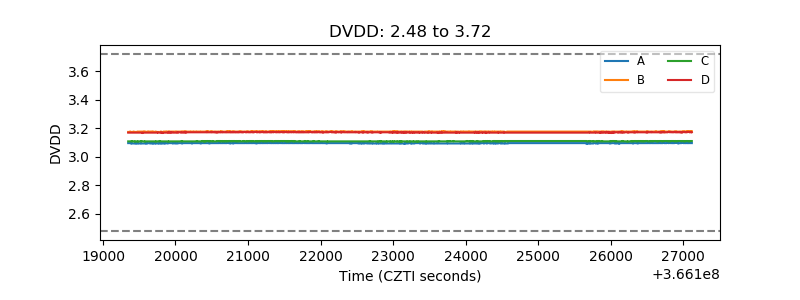 |
| Temperature 1 | 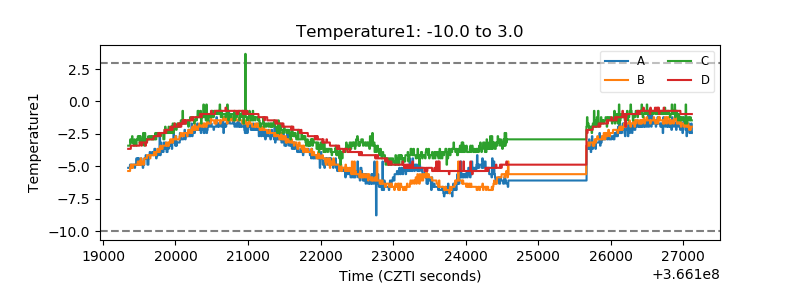 |
| Veto HV Monitor |  |
| Veto LLD | 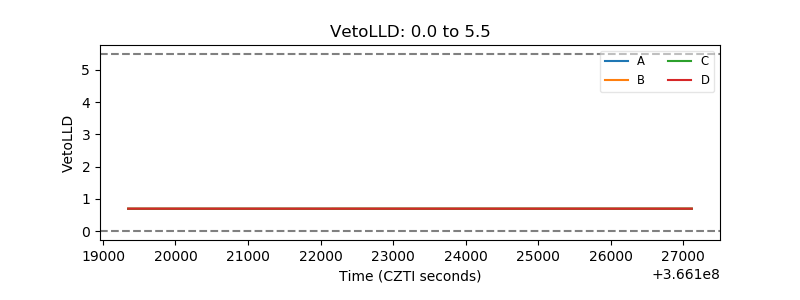 |
| Alpha Counter | 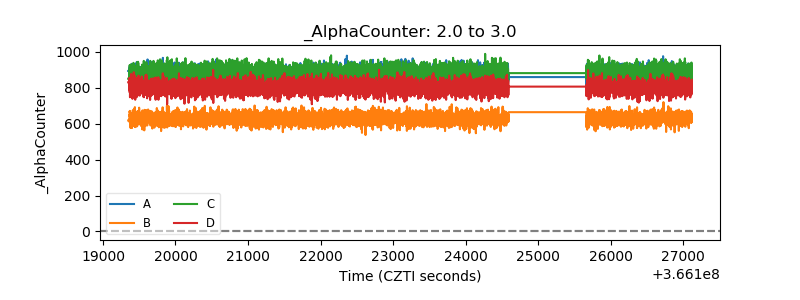 |
| _CPM_Rate | 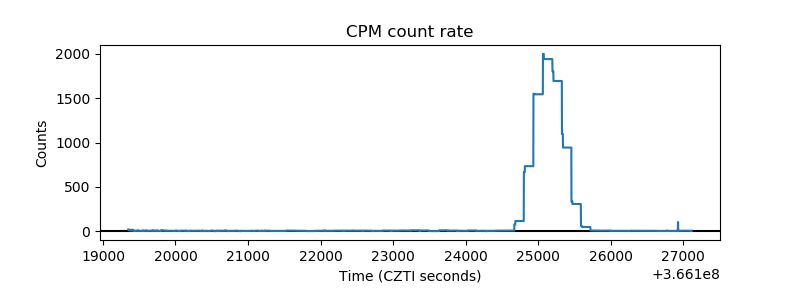 |
| CZT Counter | 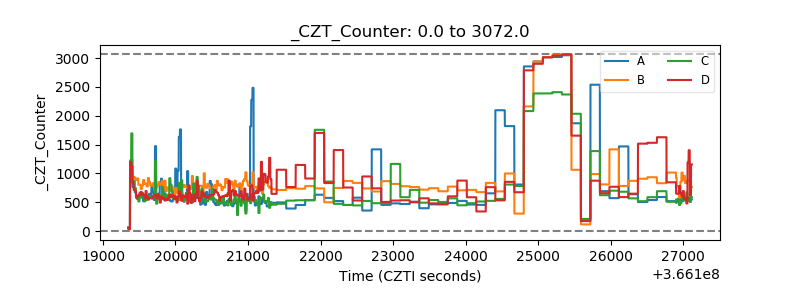 |
| +2.5 Volts monitor |  |
| +5 Volts monitor |  |
| _ROLL_ROT | 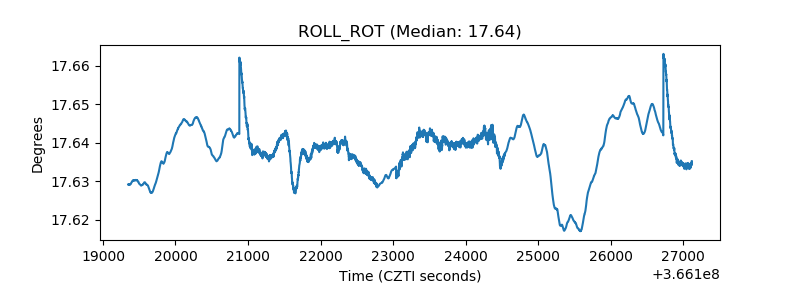 |
| _Roll_DEC | 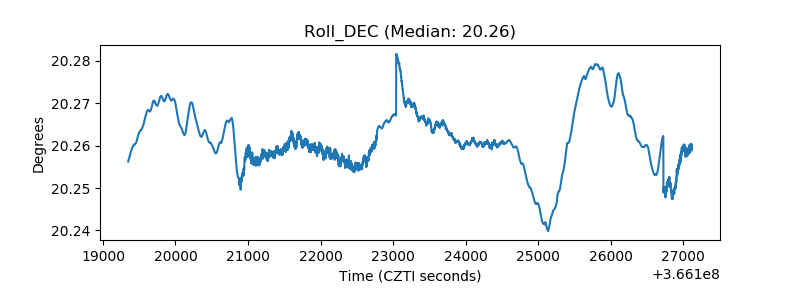 |
| _Roll_RA | 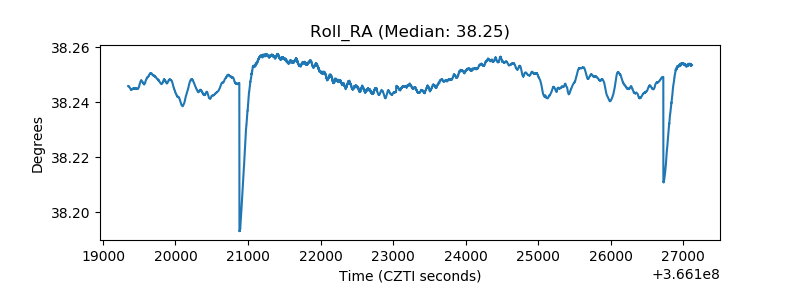 |
| Veto Counter | 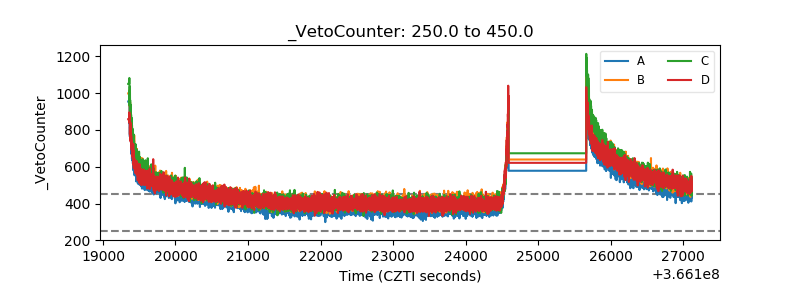 |