| Param | Original file | Final file |
|---|---|---|
| Filename | modeM0/AS1T04_034T01_9000004632_31698cztM0_level2.evt | modeM0/AS1T04_034T01_9000004632_31698cztM0_level2_quad_clean.evt |
| Size (bytes) | 616,602,240 | 65,387,520 |
| Size | 588.0 MB | 62.4 MB |
| Events in quadrant A | 3,722,411 | 391,779 |
| Events in quadrant B | 5,708,008 | 386,570 |
| Events in quadrant C | 4,009,042 | 375,040 |
| Events in quadrant D | 4,796,005 | 373,936 |
| Mode M9 | |||
|---|---|---|---|
| Quadrant | BADHDUFLAG | Total packets | Discarded packets |
| A | 0 | 18 | 0 |
| B | 0 | 19 | 0 |
| C | 0 | 19 | 0 |
| D | 0 | 19 | 0 |
| Mode SS | |||
|---|---|---|---|
| Quadrant | BADHDUFLAG | Total packets | Discarded packets |
| A | 0 | 130 | 0 |
| B | 0 | 130 | 0 |
| C | 0 | 130 | 0 |
| D | 0 | 130 | 0 |
| Mode M0 | |||
|---|---|---|---|
| Quadrant | BADHDUFLAG | Total packets | Discarded packets |
| A | 0 | 15310 | 2 |
| B | 0 | 21311 | 2 |
| C | 0 | 16052 | 2 |
| D | 0 | 18636 | 3 |
| Quadrant | Total seconds | Saturated seconds | Saturation percentage |
|---|---|---|---|
| A | 6490 | 153 | 2.357473% |
| B | 6490 | 216 | 3.328197% |
| C | 6490 | 248 | 3.821263% |
| D | 6489 | 343 | 5.285868% |
Noise dominated data is calculated using 1-second bins in cleaned event files. If a bin has >2000 counts, and if more than 50% of those come from <1% of pixels, then it is considered to be noise-dominated and hence unusable.
| Quadrant | # 1 sec bins | Bins with >0 counts | Bins with >2000 counts | High rate bins dominated by noise | Noise dominated (total time) | Noise dominated (detector-on time) | Marked lightcurve |
|---|---|---|---|---|---|---|---|
| A | 7706 | 6492 | 27 | 27 | 0.35% | 0.42% | 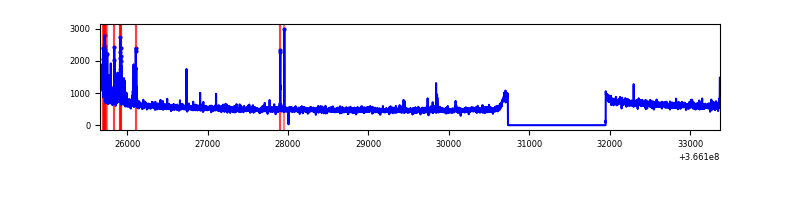 |
| B | 7706 | 6492 | 36 | 36 | 0.47% | 0.55% | 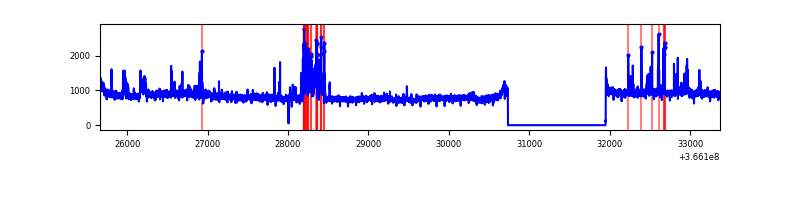 |
| C | 7706 | 6492 | 37 | 37 | 0.48% | 0.57% | 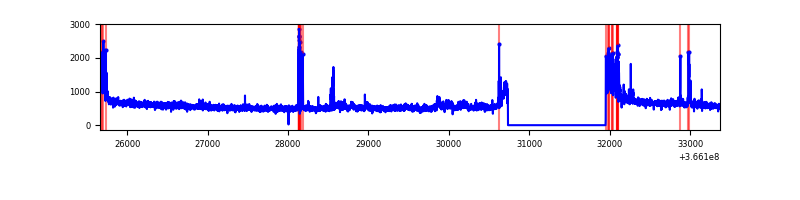 |
| D | 7705 | 6491 | 214 | 214 | 2.78% | 3.30% | 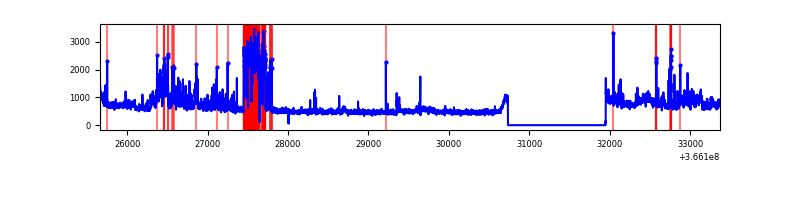 |
Top three noisy pixels from each quadrant. If the there are fewer than three noisy pixels in the level2.evt file, extra rows are filled as -1
| Pixel properties | Quadrant properties | ||||||
|---|---|---|---|---|---|---|---|
| Quadrant | DetID | PixID | Counts | Sigma | Mean | Median | Sigma |
| A | 0 | 13 | 202534 | 1118.24 | 907 | 893 | 180.3 |
| A | 14 | 238 | 18530 | 97.81 | 907 | 893 | 180.3 |
| A | 13 | 254 | 12078 | 62.03 | 907 | 893 | 180.3 |
| B | 6 | 159 | 1787864 | 10666.33 | 893 | 874 | 167.5 |
| B | 0 | 190 | 210057 | 1248.59 | 893 | 874 | 167.5 |
| B | 4 | 80 | 87317 | 515.97 | 893 | 874 | 167.5 |
| C | 3 | 233 | 161575 | 804.41 | 867 | 875 | 199.8 |
| C | 10 | 22 | 150681 | 749.88 | 867 | 875 | 199.8 |
| C | 14 | 238 | 142247 | 707.66 | 867 | 875 | 199.8 |
| D | 13 | 249 | 498351 | 2440.91 | 865 | 845 | 203.8 |
| D | 8 | 195 | 441546 | 2162.21 | 865 | 845 | 203.8 |
| D | 12 | 227 | 370960 | 1815.89 | 865 | 845 | 203.8 |
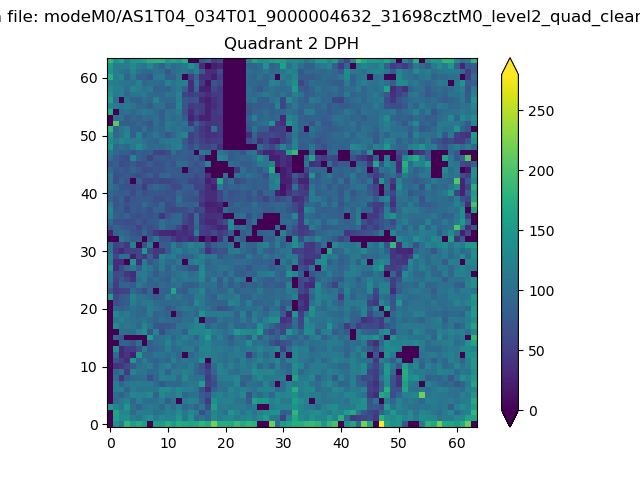
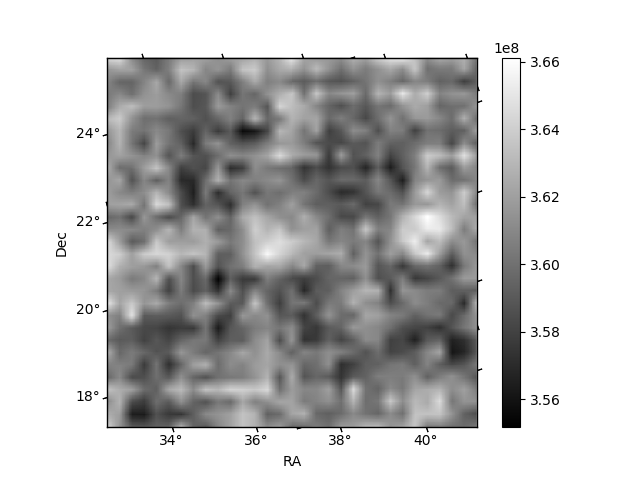
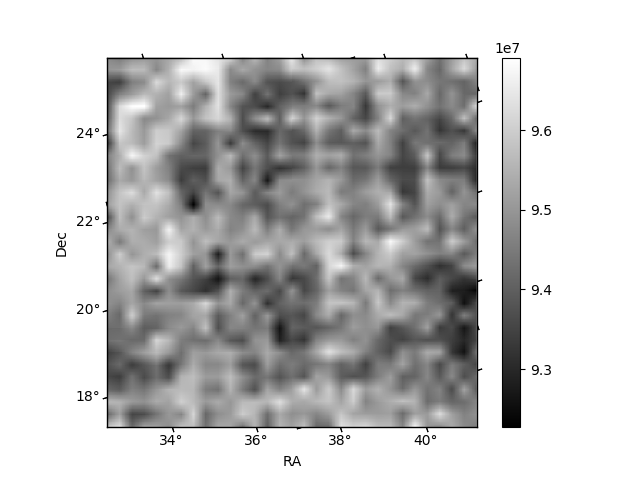
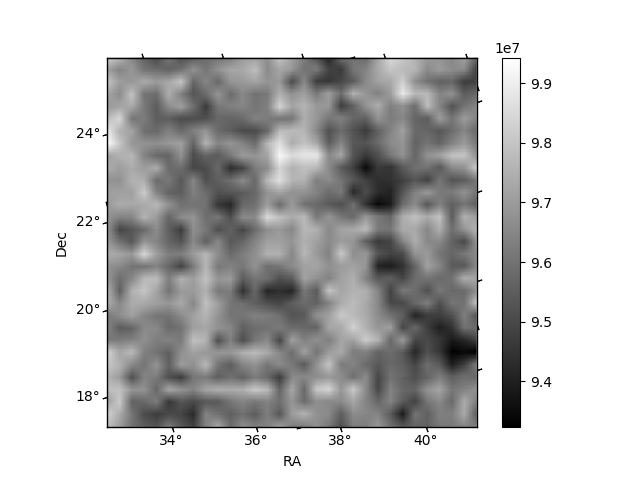
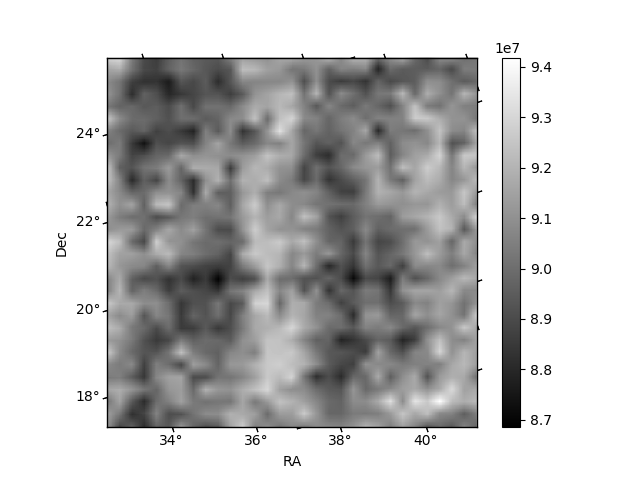
Histogram calculated using DETX and DETY for each event in the final _common_clean file
| Quadrant A | 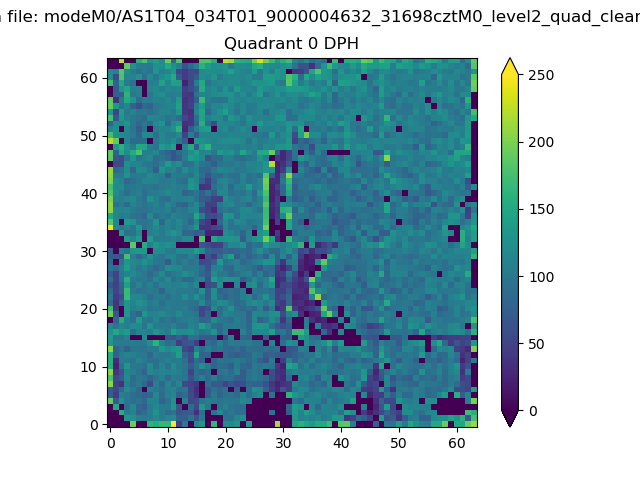 |
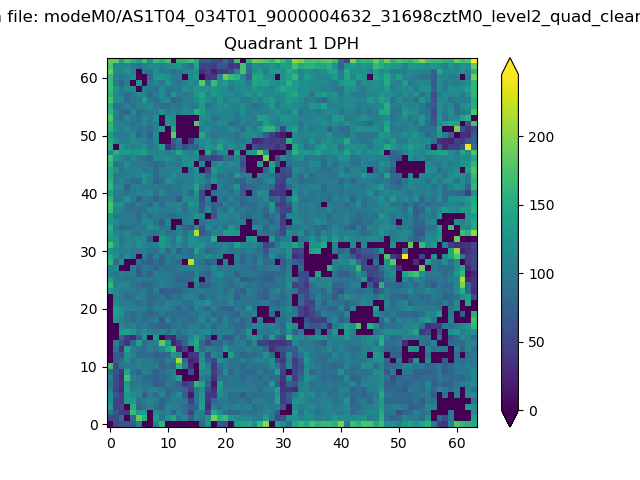 |
Quadrant B |
|---|---|---|---|
| Quadrant D | 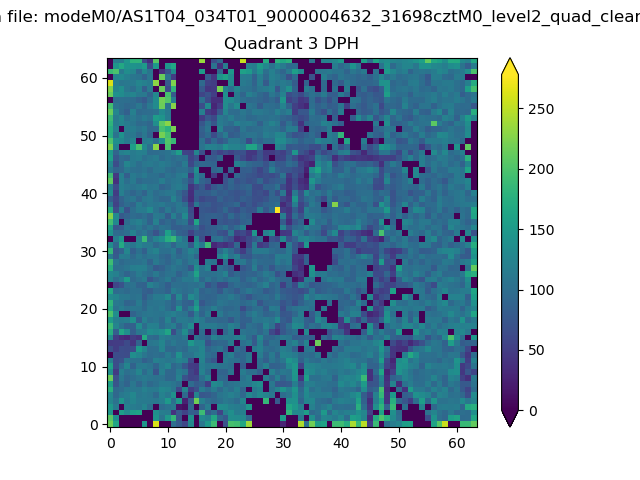 |
 |
Quadrant C |
| Plot type | Count rate plots | Images |
|---|---|---|
| Comparison with Poisson distribution Blue bars denote a histogram of data divided into 1 sec bins. Red curve is a Poisson curve with rate = median count rate of data. |
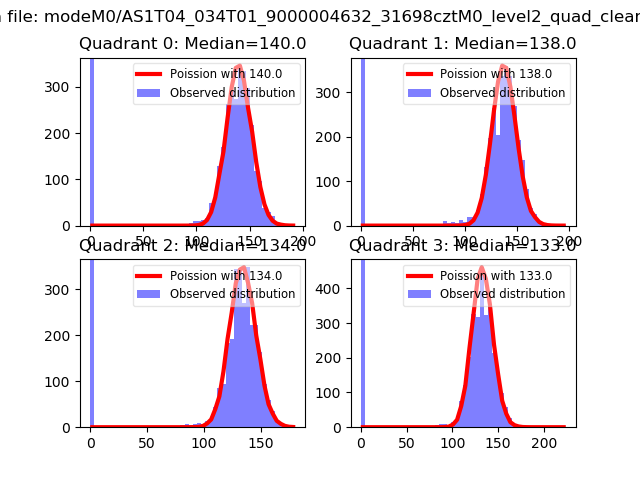 |
 |
| Quadrant-wise count rates Data is divided into 100 sec bins |
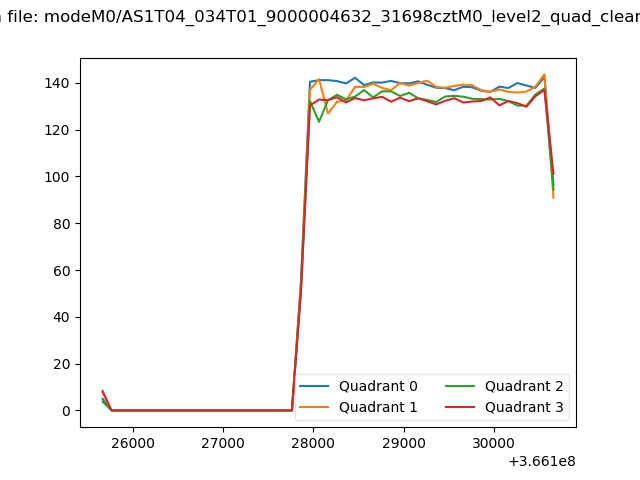 |
|
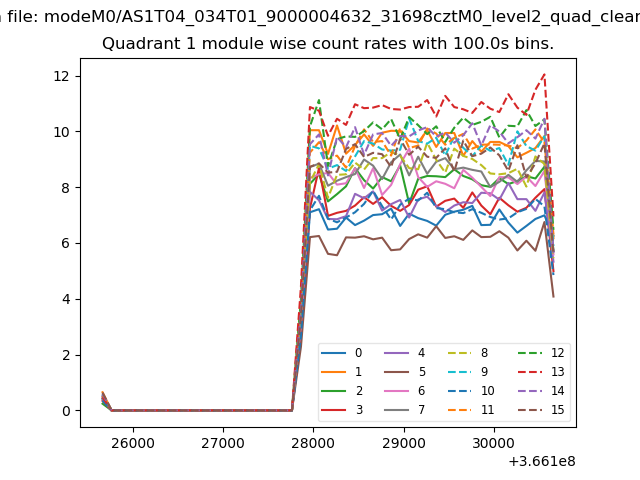
| Module-wise count rates for Quadrant A Data is divided into 100 sec bins |
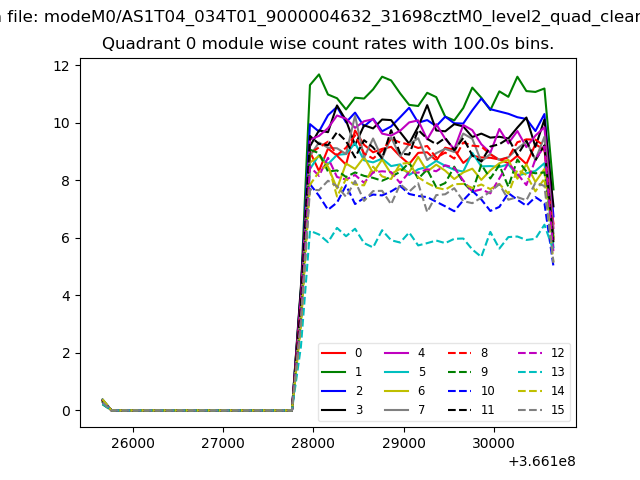 |
 |
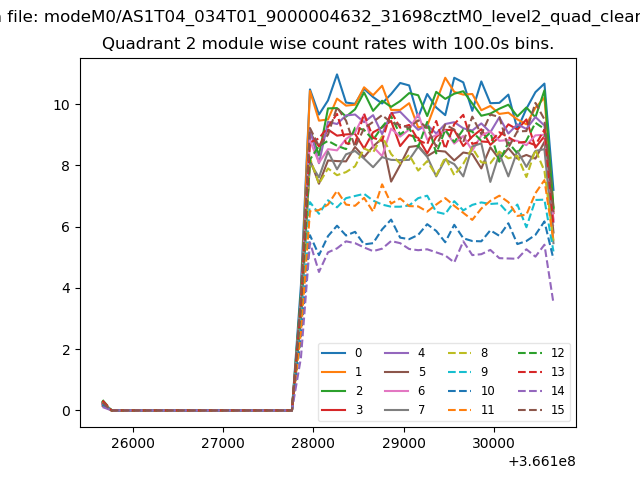
| Module-wise count rates for Quadrant B Data is divided into 100 sec bins |
 |
 |
| Module-wise count rates for Quadrant C Data is divided into 100 sec bins |
 |
 |
| Module-wise count rates for Quadrant D Data is divided into 100 sec bins |
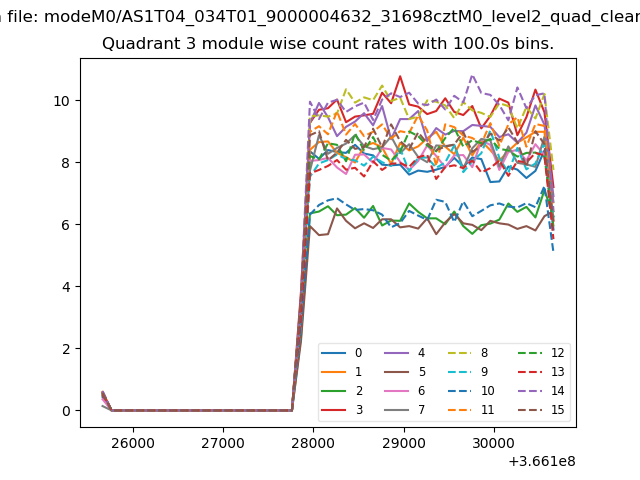 |
 |
| Parameter | Plot |
|---|---|
| CZT HV Monitor | 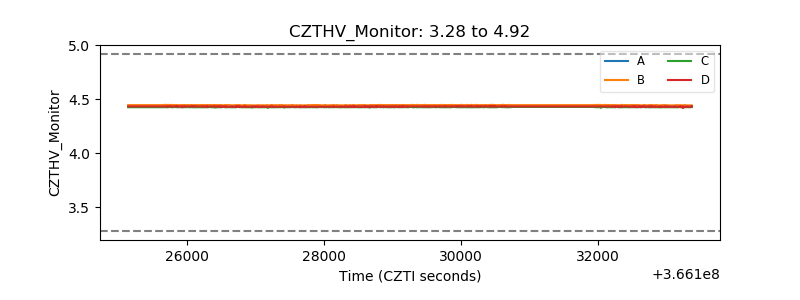 |
| D_VDD | 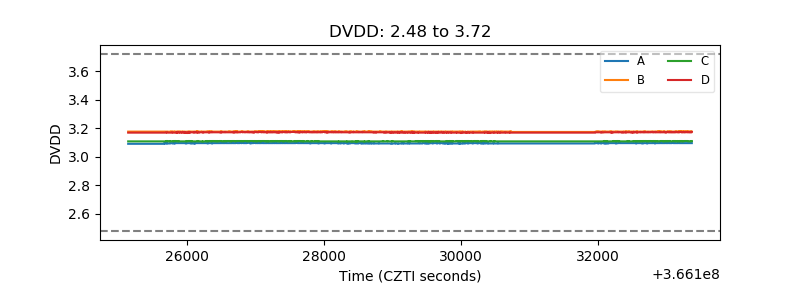 |
| Temperature 1 | 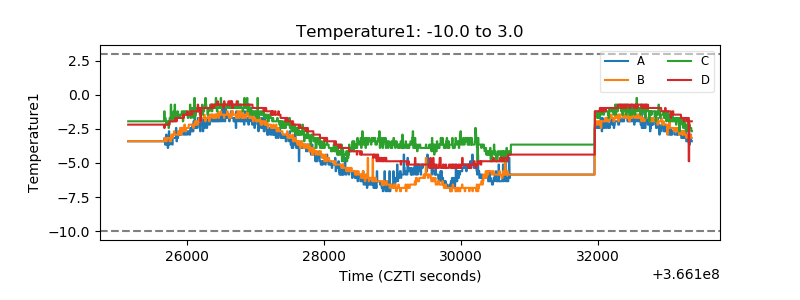 |
| Veto HV Monitor | 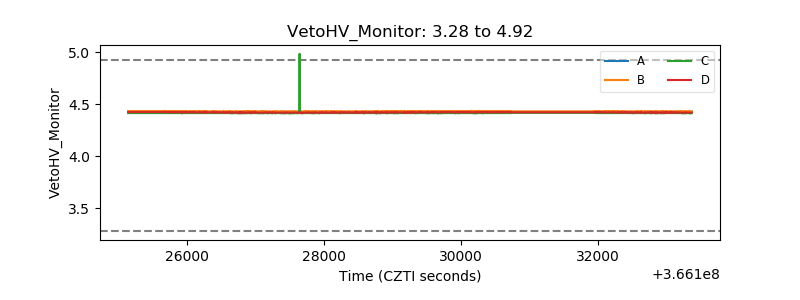 |
| Veto LLD | 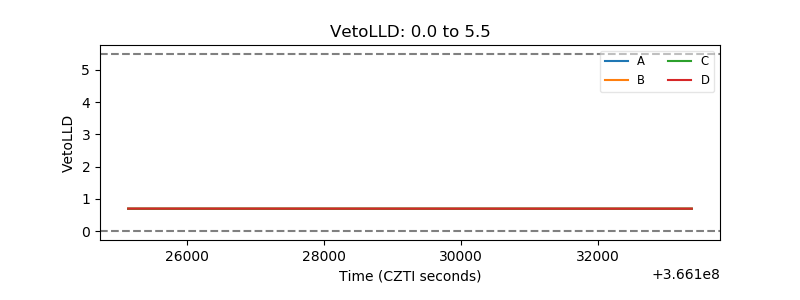 |
| Alpha Counter | 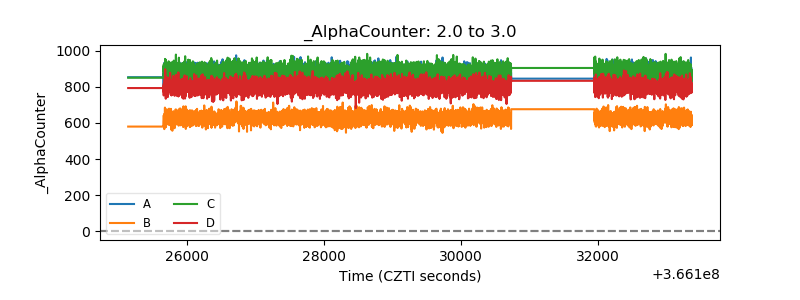 |
| _CPM_Rate | 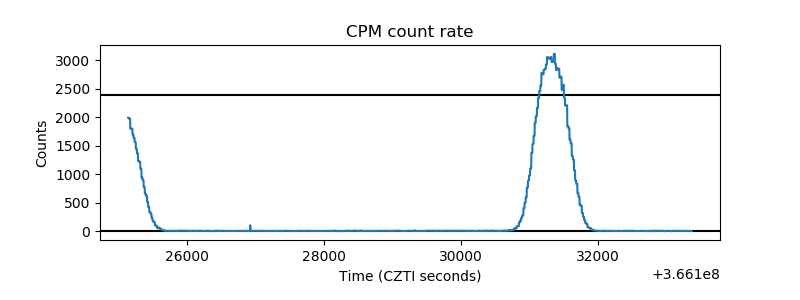 |
| CZT Counter | 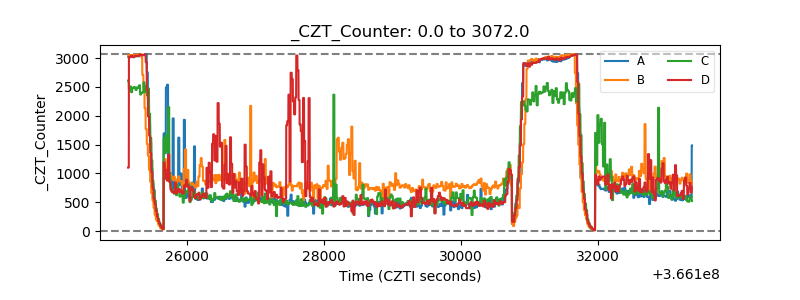 |
| +2.5 Volts monitor |  |
| +5 Volts monitor |  |
| _ROLL_ROT | 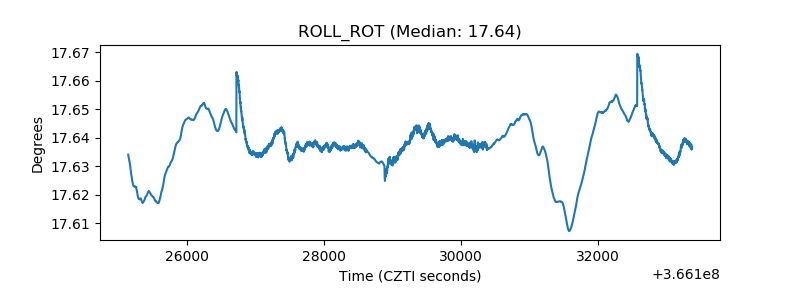 |
| _Roll_DEC | 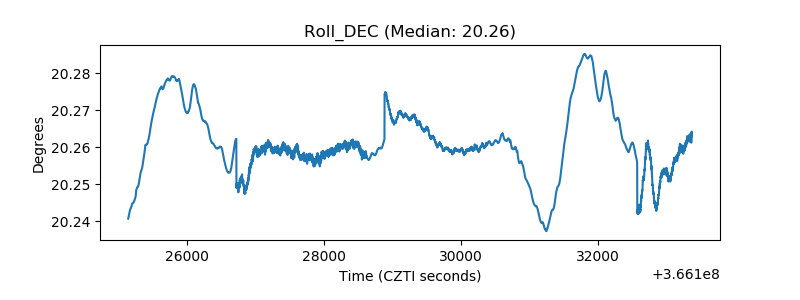 |
| _Roll_RA | 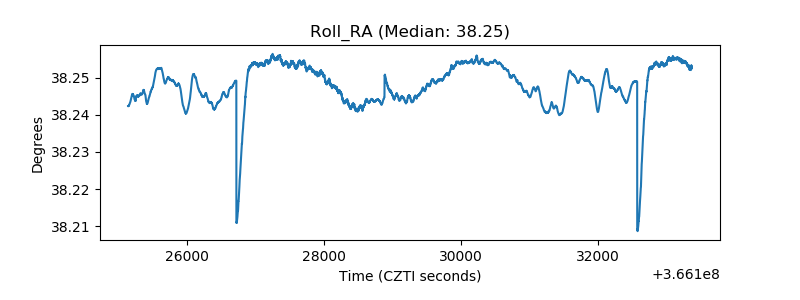 |
| Veto Counter | 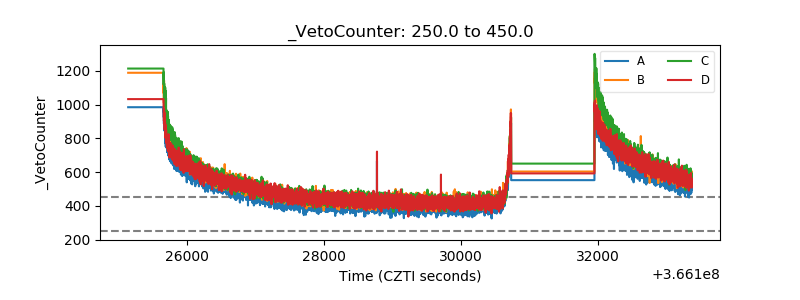 |