| Param | Original file | Final file |
|---|---|---|
| Filename | modeM0/AS1T04_034T01_9000004632_31699cztM0_level2.evt | modeM0/AS1T04_034T01_9000004632_31699cztM0_level2_quad_clean.evt |
| Size (bytes) | 596,468,160 | 72,843,840 |
| Size | 568.8 MB | 69.5 MB |
| Events in quadrant A | 3,516,765 | 458,757 |
| Events in quadrant B | 6,357,170 | 461,442 |
| Events in quadrant C | 3,757,143 | 444,328 |
| Events in quadrant D | 4,045,674 | 440,646 |
| Mode M9 | |||
|---|---|---|---|
| Quadrant | BADHDUFLAG | Total packets | Discarded packets |
| A | 0 | 13 | 0 |
| B | 0 | 13 | 0 |
| C | 0 | 13 | 0 |
| D | 0 | 13 | 0 |
| Mode SS | |||
|---|---|---|---|
| Quadrant | BADHDUFLAG | Total packets | Discarded packets |
| A | 0 | 118 | 0 |
| B | 0 | 116 | 0 |
| C | 0 | 116 | 0 |
| D | 0 | 116 | 0 |
| Mode M0 | |||
|---|---|---|---|
| Quadrant | BADHDUFLAG | Total packets | Discarded packets |
| A | 0 | 14283 | 1 |
| B | 0 | 22806 | 5 |
| C | 0 | 14987 | 1 |
| D | 0 | 16014 | 1 |
| Quadrant | Total seconds | Saturated seconds | Saturation percentage |
|---|---|---|---|
| A | 5728 | 142 | 2.479050% |
| B | 5728 | 1116 | 19.483240% |
| C | 5728 | 227 | 3.962989% |
| D | 5728 | 88 | 1.536313% |
Noise dominated data is calculated using 1-second bins in cleaned event files. If a bin has >2000 counts, and if more than 50% of those come from <1% of pixels, then it is considered to be noise-dominated and hence unusable.
| Quadrant | # 1 sec bins | Bins with >0 counts | Bins with >2000 counts | High rate bins dominated by noise | Noise dominated (total time) | Noise dominated (detector-on time) | Marked lightcurve |
|---|---|---|---|---|---|---|---|
| A | 7033 | 5729 | 36 | 36 | 0.51% | 0.63% | 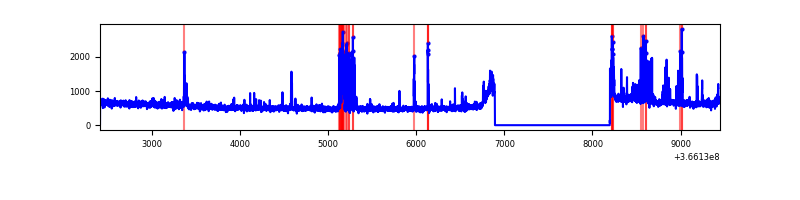 |
| B | 7033 | 5729 | 866 | 866 | 12.31% | 15.12% | 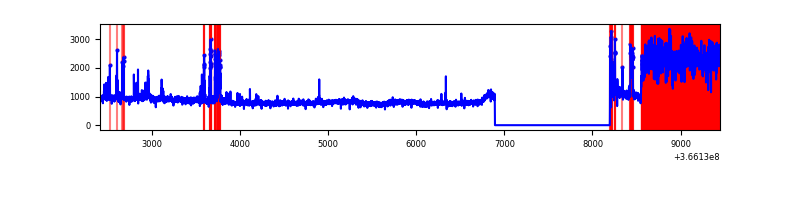 |
| C | 7033 | 5729 | 62 | 62 | 0.88% | 1.08% | 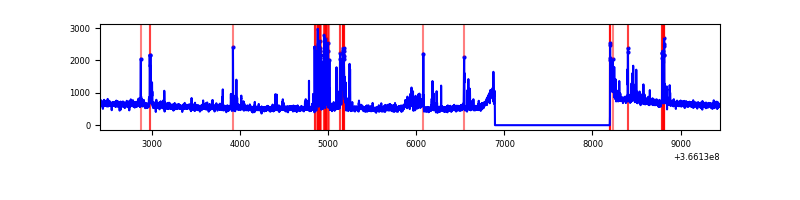 |
| D | 7033 | 5729 | 21 | 21 | 0.30% | 0.37% | 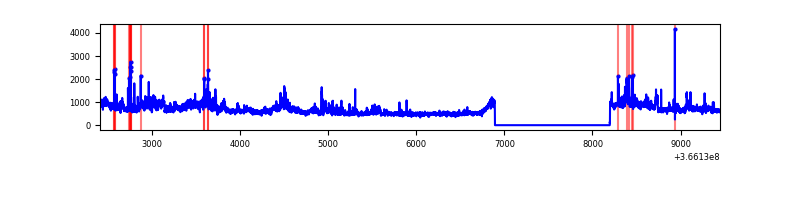 |
Top three noisy pixels from each quadrant. If the there are fewer than three noisy pixels in the level2.evt file, extra rows are filled as -1
| Pixel properties | Quadrant properties | ||||||
|---|---|---|---|---|---|---|---|
| Quadrant | DetID | PixID | Counts | Sigma | Mean | Median | Sigma |
| A | 0 | 13 | 345599 | 2128.66 | 819 | 808 | 162.0 |
| A | 13 | 254 | 10703 | 61.09 | 819 | 808 | 162.0 |
| A | 3 | 137 | 7515 | 41.41 | 819 | 808 | 162.0 |
| B | 4 | 80 | 1840854 | 13905.77 | 709 | 695 | 132.3 |
| B | 6 | 159 | 1450832 | 10958.44 | 709 | 695 | 132.3 |
| B | 5 | 172 | 205840 | 1550.25 | 709 | 695 | 132.3 |
| C | 10 | 22 | 320401 | 1733.98 | 795 | 803 | 184.3 |
| C | 14 | 238 | 129525 | 698.38 | 795 | 803 | 184.3 |
| C | 0 | 207 | 95776 | 515.28 | 795 | 803 | 184.3 |
| D | 8 | 195 | 647233 | 3437.14 | 804 | 787 | 188.1 |
| D | 12 | 227 | 196387 | 1040.0 | 804 | 787 | 188.1 |
| D | 12 | 233 | 63272 | 332.23 | 804 | 787 | 188.1 |
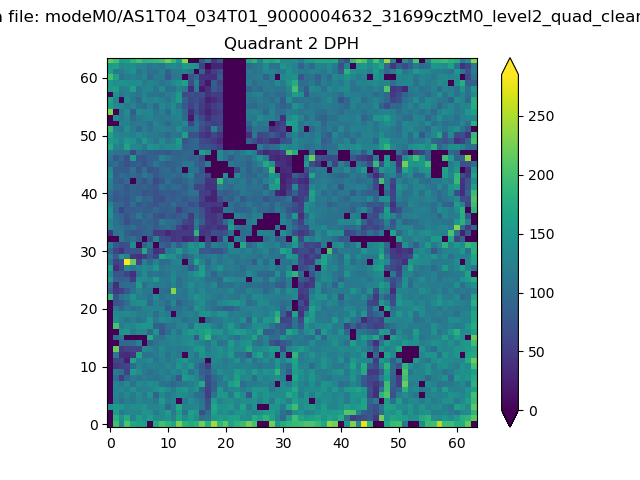
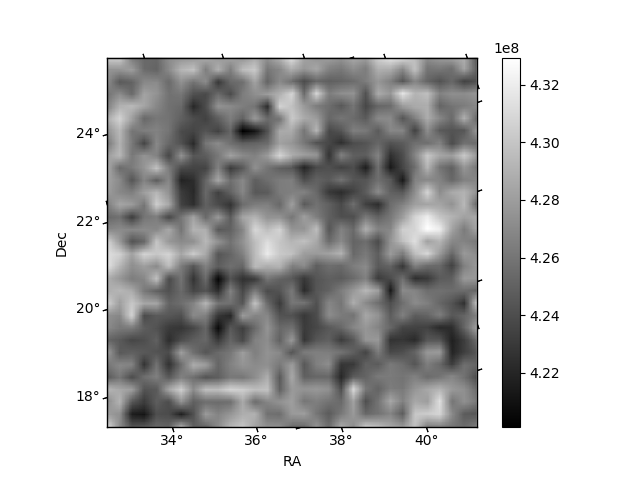
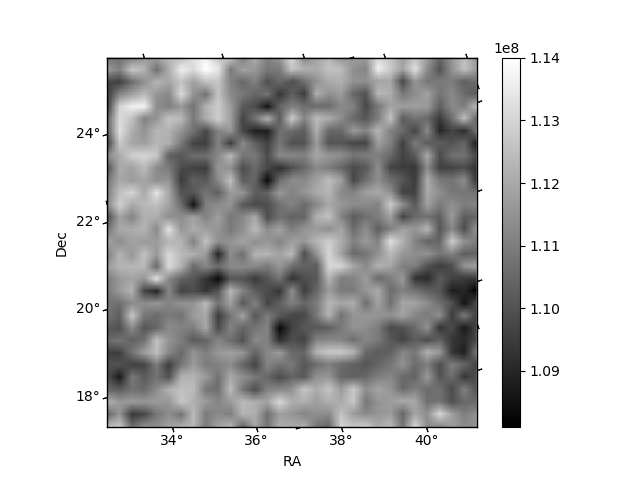
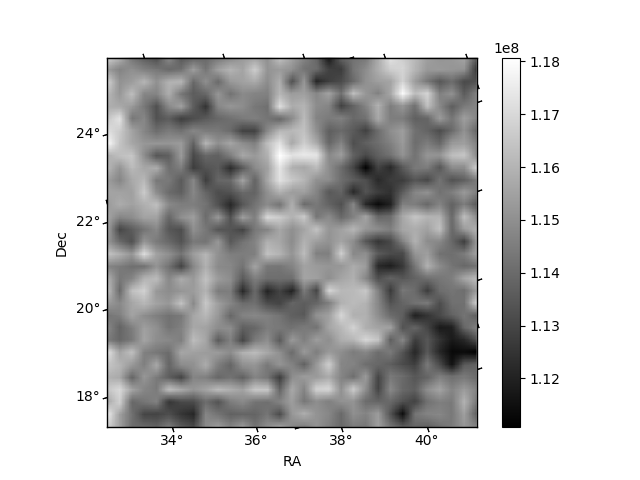
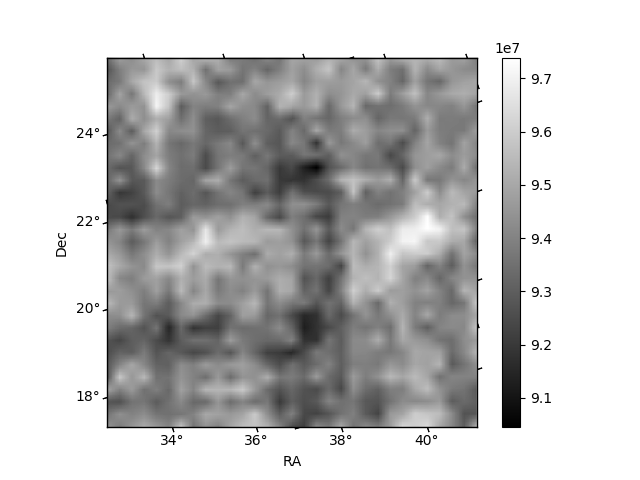
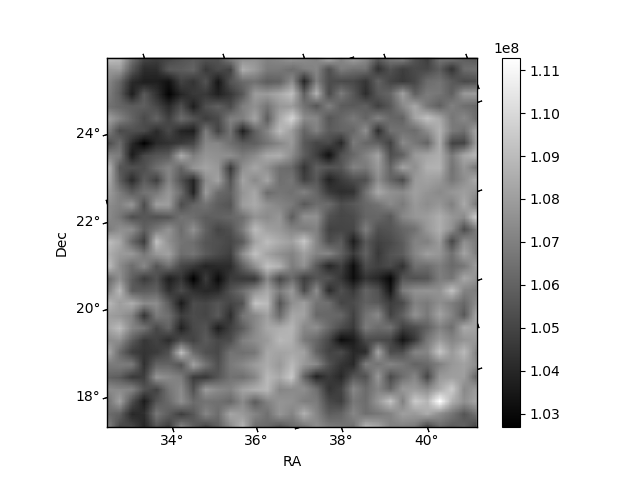
Histogram calculated using DETX and DETY for each event in the final _common_clean file
| Quadrant A | 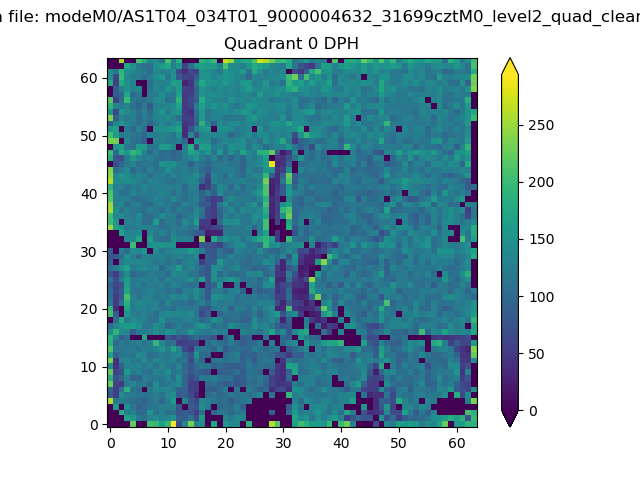 |
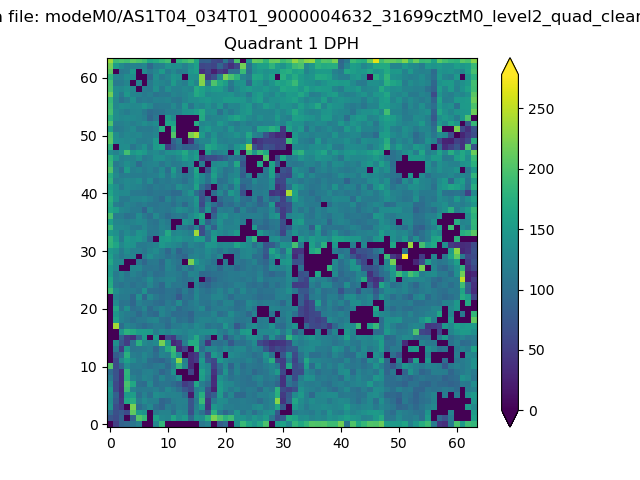 |
Quadrant B |
|---|---|---|---|
| Quadrant D | 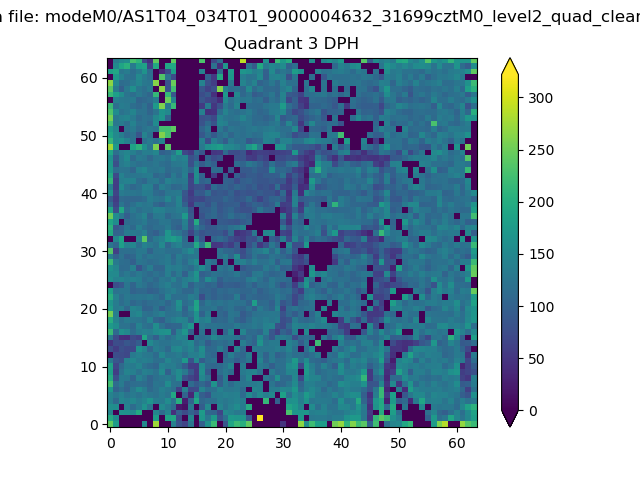 |
 |
Quadrant C |
| Plot type | Count rate plots | Images |
|---|---|---|
| Comparison with Poisson distribution Blue bars denote a histogram of data divided into 1 sec bins. Red curve is a Poisson curve with rate = median count rate of data. |
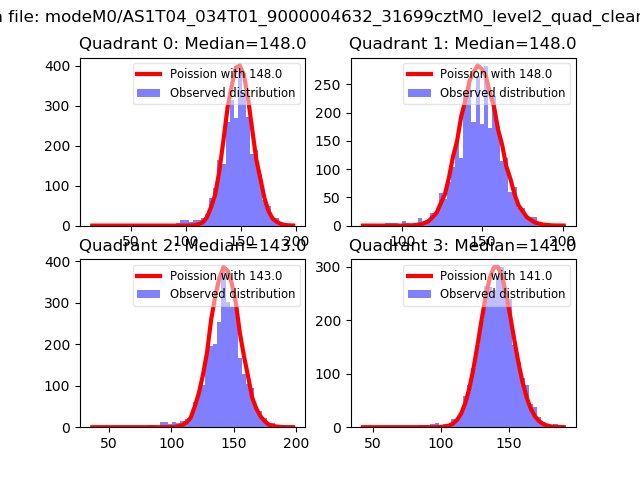 |
 |
| Quadrant-wise count rates Data is divided into 100 sec bins |
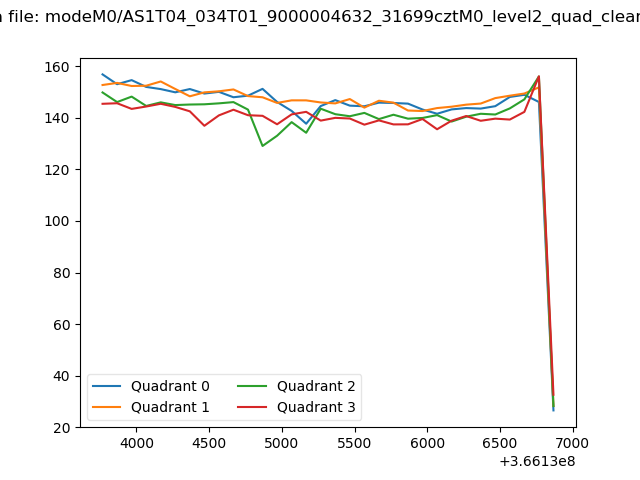 |
|
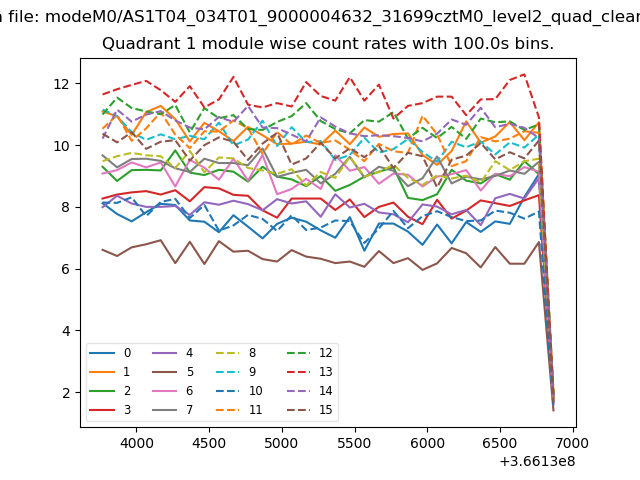
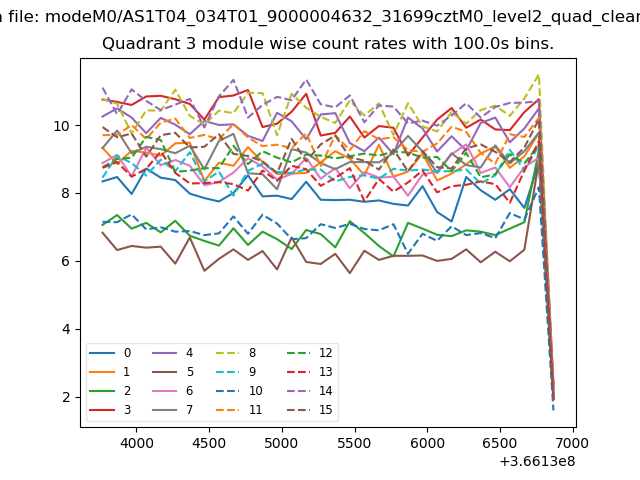
| Module-wise count rates for Quadrant A Data is divided into 100 sec bins |
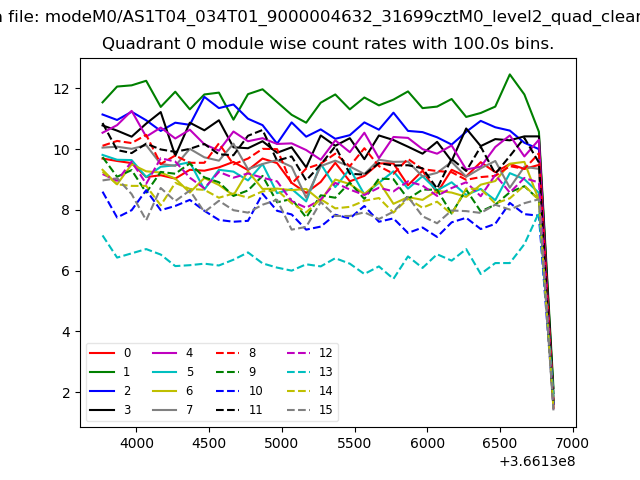 |
 |
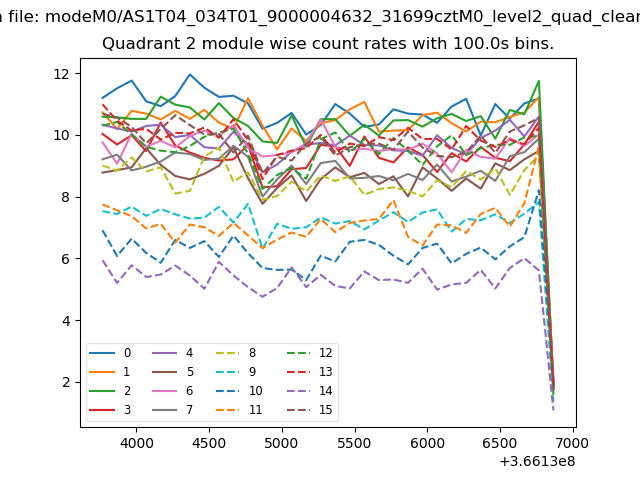
| Module-wise count rates for Quadrant B Data is divided into 100 sec bins |
 |
 |
| Module-wise count rates for Quadrant C Data is divided into 100 sec bins |
 |
 |
| Module-wise count rates for Quadrant D Data is divided into 100 sec bins |
 |
 |
| Parameter | Plot |
|---|---|
| CZT HV Monitor | 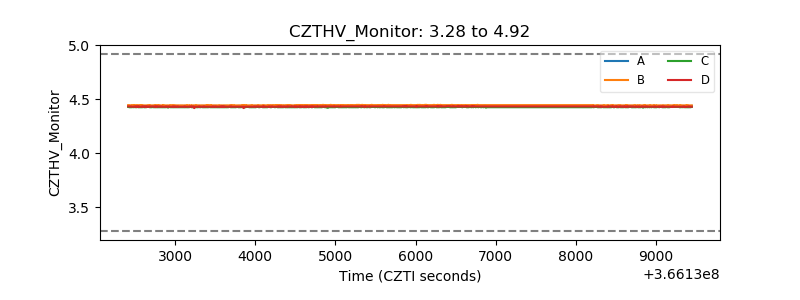 |
| D_VDD | 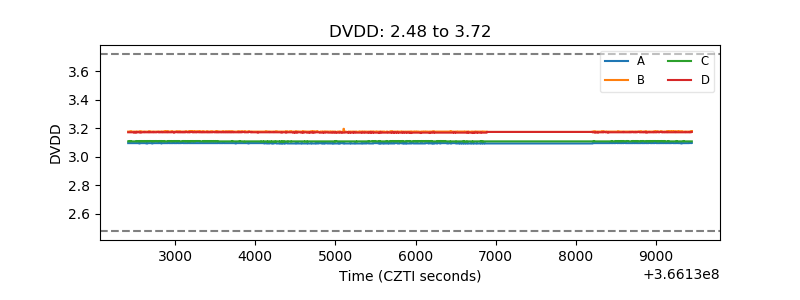 |
| Temperature 1 | 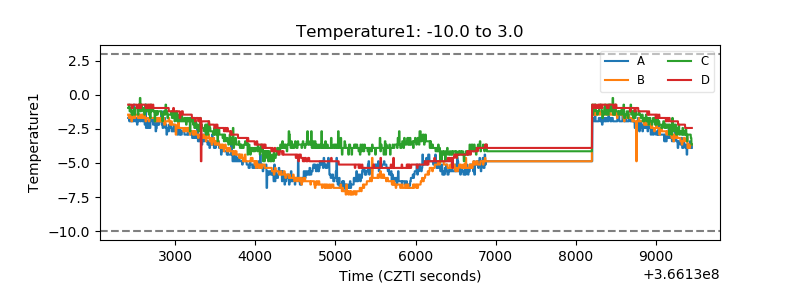 |
| Veto HV Monitor | 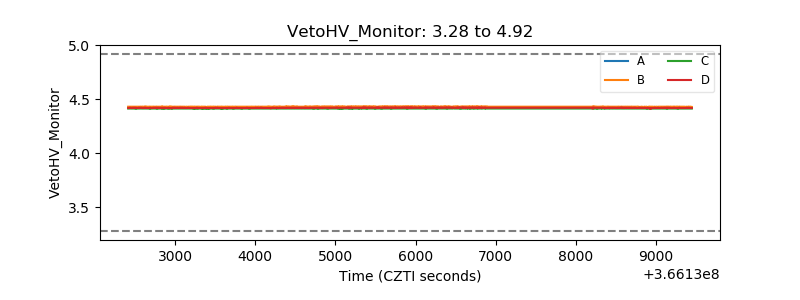 |
| Veto LLD | 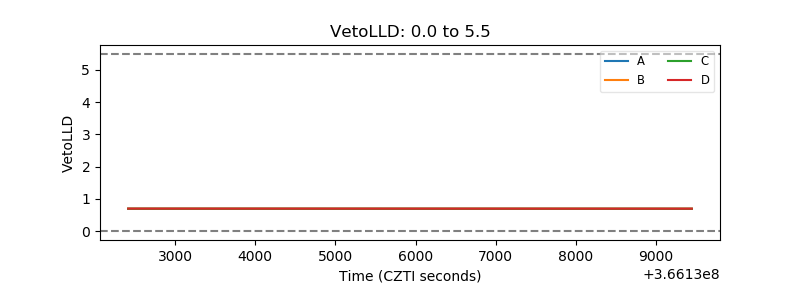 |
| Alpha Counter | 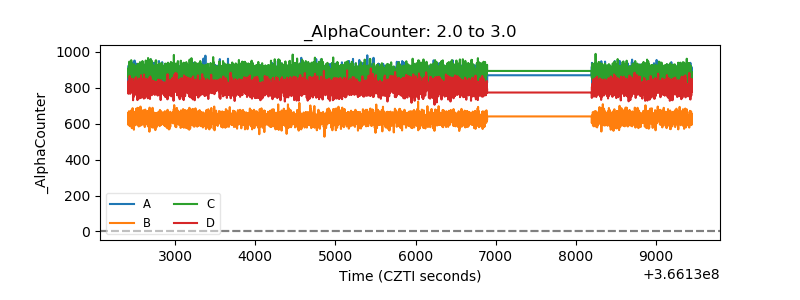 |
| _CPM_Rate | 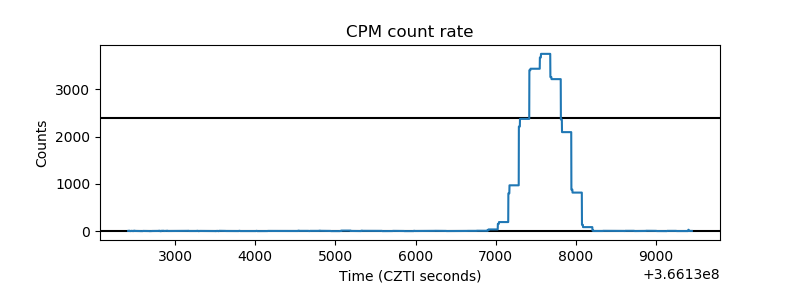 |
| CZT Counter | 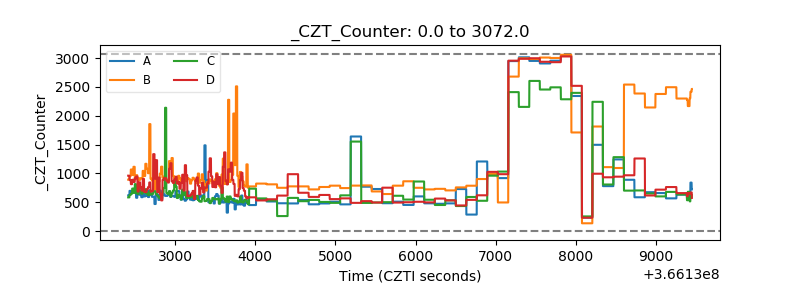 |
| +2.5 Volts monitor |  |
| +5 Volts monitor |  |
| _ROLL_ROT | 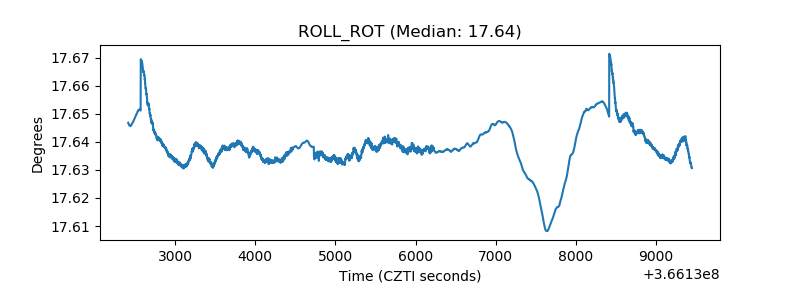 |
| _Roll_DEC | 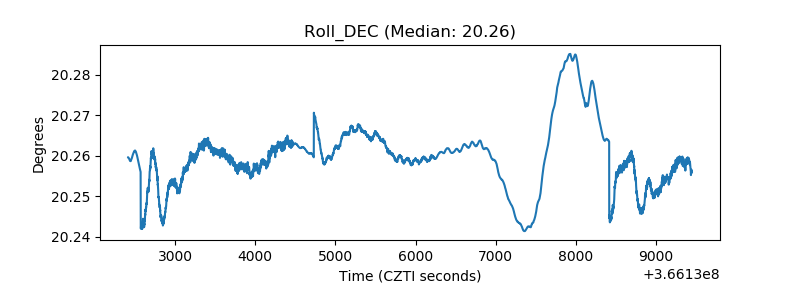 |
| _Roll_RA | 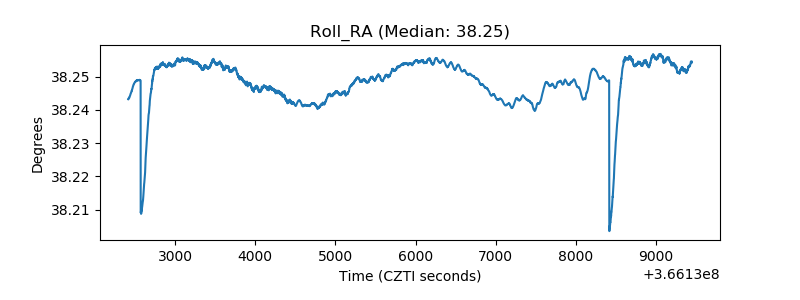 |
| Veto Counter | 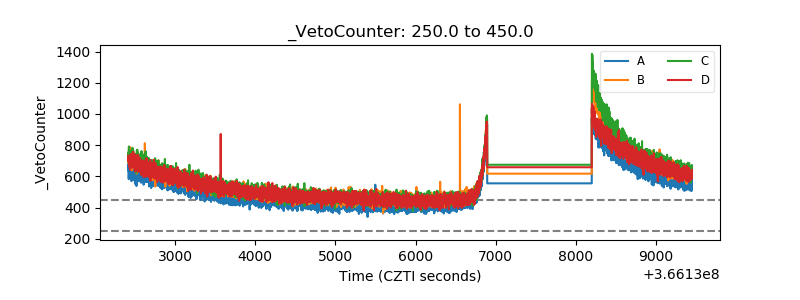 |