| Param | Original file | Final file |
|---|---|---|
| Filename | modeM0/AS1T04_034T01_9000004632_31700cztM0_level2.evt | modeM0/AS1T04_034T01_9000004632_31700cztM0_level2_quad_clean.evt |
| Size (bytes) | 610,784,640 | 87,802,560 |
| Size | 582.5 MB | 83.7 MB |
| Events in quadrant A | 3,690,286 | 566,645 |
| Events in quadrant B | 6,697,842 | 571,920 |
| Events in quadrant C | 3,915,041 | 561,638 |
| Events in quadrant D | 3,801,572 | 552,744 |
| Mode M9 | |||
|---|---|---|---|
| Quadrant | BADHDUFLAG | Total packets | Discarded packets |
| A | 0 | 13 | 0 |
| B | 0 | 13 | 0 |
| C | 0 | 13 | 0 |
| D | 0 | 13 | 0 |
| Mode SS | |||
|---|---|---|---|
| Quadrant | BADHDUFLAG | Total packets | Discarded packets |
| A | 0 | 120 | 0 |
| B | 0 | 120 | 0 |
| C | 0 | 120 | 0 |
| D | 0 | 120 | 0 |
| Mode M0 | |||
|---|---|---|---|
| Quadrant | BADHDUFLAG | Total packets | Discarded packets |
| A | 0 | 15002 | 1 |
| B | 0 | 23828 | 1 |
| C | 0 | 15540 | 1 |
| D | 0 | 15085 | 1 |
| Quadrant | Total seconds | Saturated seconds | Saturation percentage |
|---|---|---|---|
| A | 5803 | 165 | 2.843357% |
| B | 5803 | 1246 | 21.471653% |
| C | 5803 | 322 | 5.548854% |
| D | 5803 | 99 | 1.706014% |
Noise dominated data is calculated using 1-second bins in cleaned event files. If a bin has >2000 counts, and if more than 50% of those come from <1% of pixels, then it is considered to be noise-dominated and hence unusable.
| Quadrant | # 1 sec bins | Bins with >0 counts | Bins with >2000 counts | High rate bins dominated by noise | Noise dominated (total time) | Noise dominated (detector-on time) | Marked lightcurve |
|---|---|---|---|---|---|---|---|
| A | 7148 | 5804 | 84 | 84 | 1.18% | 1.45% | 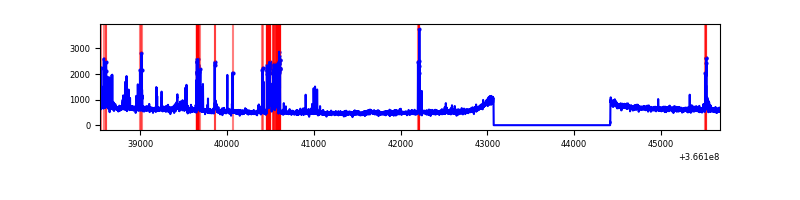 |
| B | 7148 | 5804 | 958 | 958 | 13.40% | 16.51% | 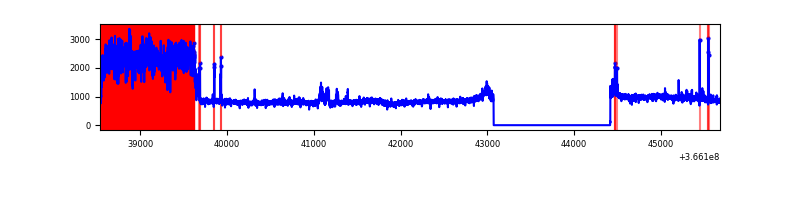 |
| C | 7148 | 5804 | 76 | 76 | 1.06% | 1.31% | 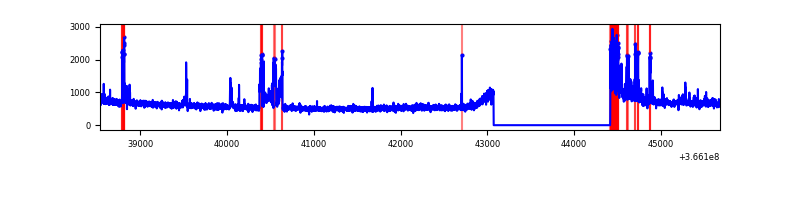 |
| D | 7148 | 5804 | 30 | 30 | 0.42% | 0.52% | 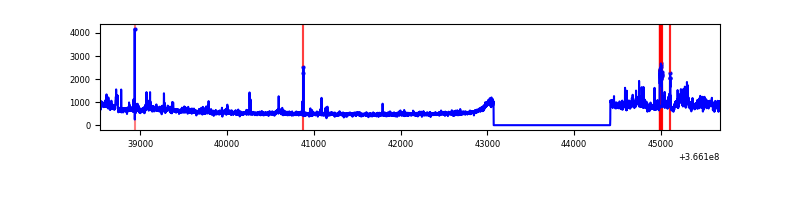 |
Top three noisy pixels from each quadrant. If the there are fewer than three noisy pixels in the level2.evt file, extra rows are filled as -1
| Pixel properties | Quadrant properties | ||||||
|---|---|---|---|---|---|---|---|
| Quadrant | DetID | PixID | Counts | Sigma | Mean | Median | Sigma |
| A | 0 | 13 | 401774 | 2418.6 | 841 | 829 | 165.8 |
| A | 7 | 16 | 22161 | 128.68 | 841 | 829 | 165.8 |
| A | 13 | 254 | 11139 | 62.19 | 841 | 829 | 165.8 |
| B | 4 | 80 | 2203207 | 16181.04 | 726 | 712 | 136.1 |
| B | 6 | 159 | 1492448 | 10959.31 | 726 | 712 | 136.1 |
| B | 5 | 172 | 76561 | 557.24 | 726 | 712 | 136.1 |
| C | 0 | 10 | 207582 | 1102.24 | 817 | 828 | 187.6 |
| C | 3 | 233 | 198204 | 1052.24 | 817 | 828 | 187.6 |
| C | 14 | 238 | 133910 | 709.48 | 817 | 828 | 187.6 |
| D | 8 | 195 | 463819 | 2360.2 | 832 | 816 | 196.2 |
| D | 12 | 227 | 66874 | 336.73 | 832 | 816 | 196.2 |
| D | 12 | 233 | 50307 | 252.28 | 832 | 816 | 196.2 |
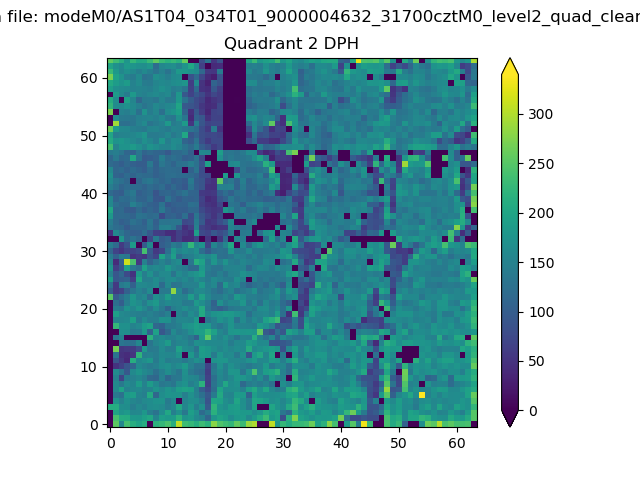
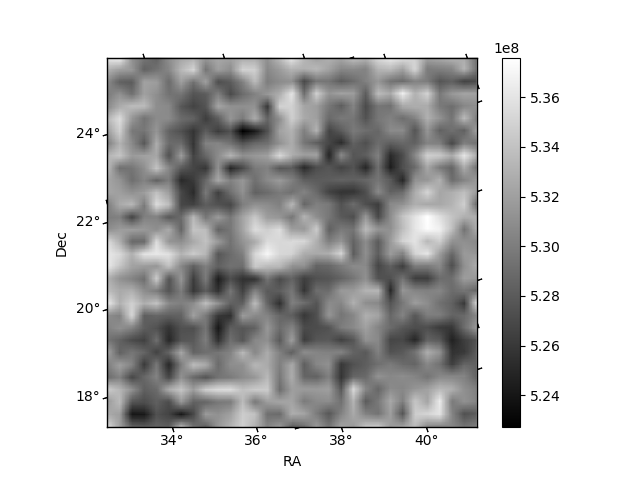
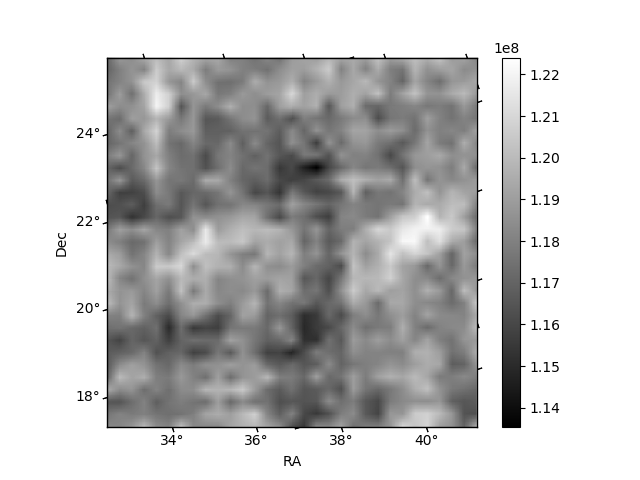
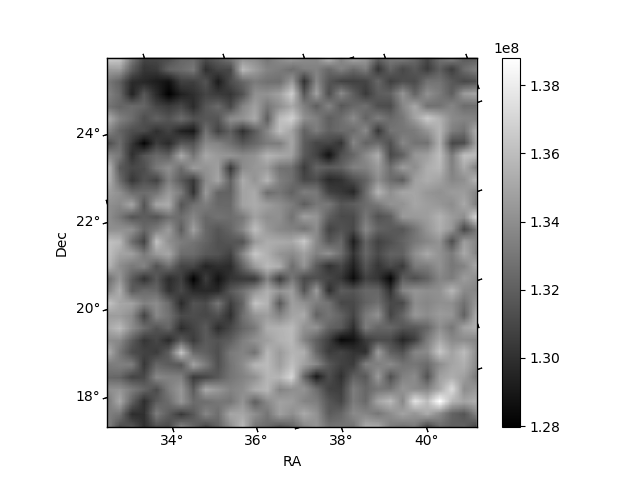
Histogram calculated using DETX and DETY for each event in the final _common_clean file
| Quadrant A | 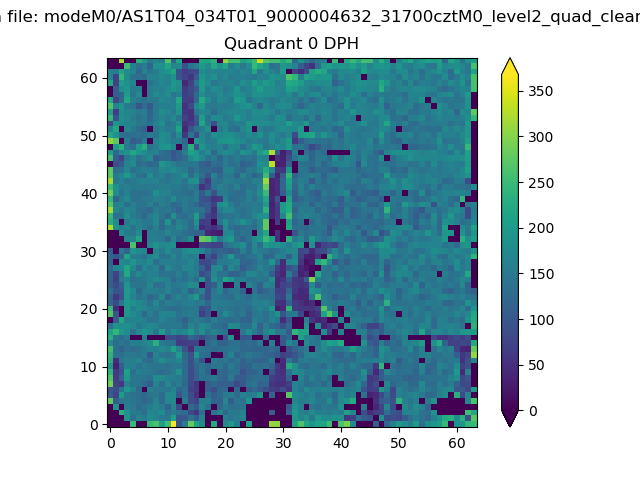 |
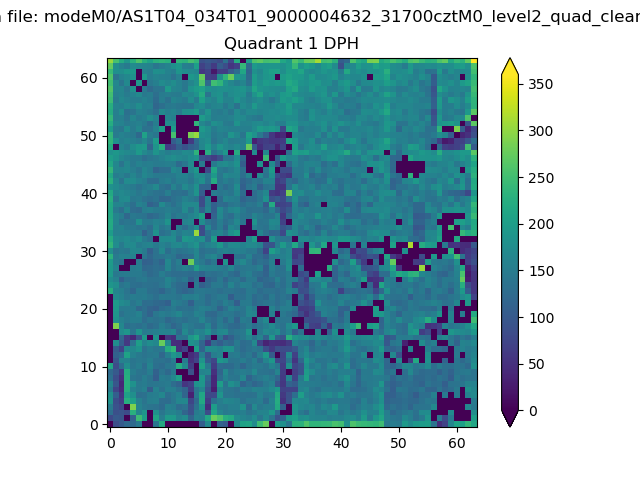 |
Quadrant B |
|---|---|---|---|
| Quadrant D | 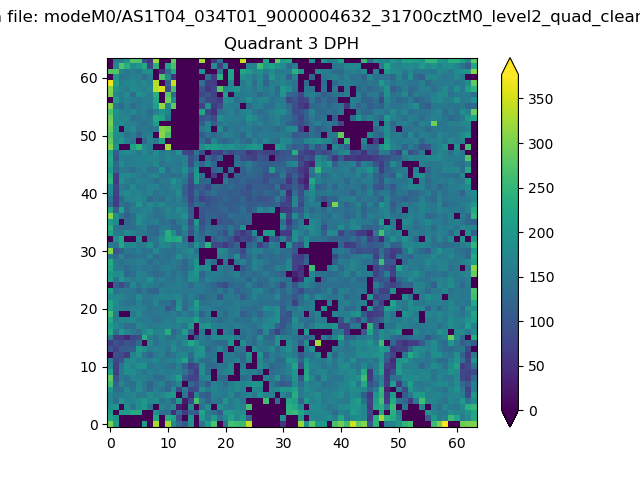 |
 |
Quadrant C |
| Plot type | Count rate plots | Images |
|---|---|---|
| Comparison with Poisson distribution Blue bars denote a histogram of data divided into 1 sec bins. Red curve is a Poisson curve with rate = median count rate of data. |
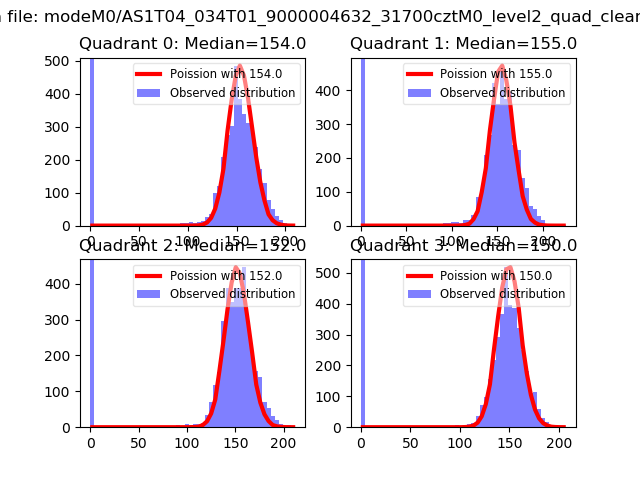 |
 |
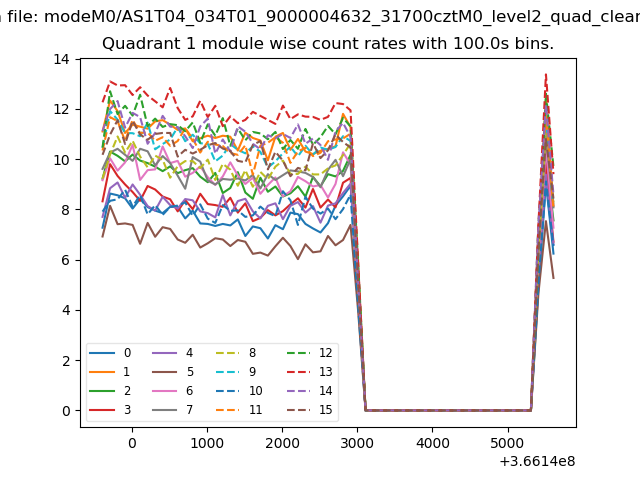
| Quadrant-wise count rates Data is divided into 100 sec bins |
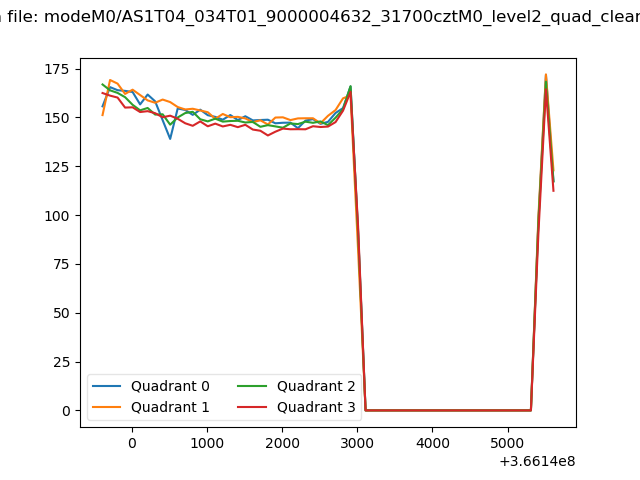 |
|
| Module-wise count rates for Quadrant A Data is divided into 100 sec bins |
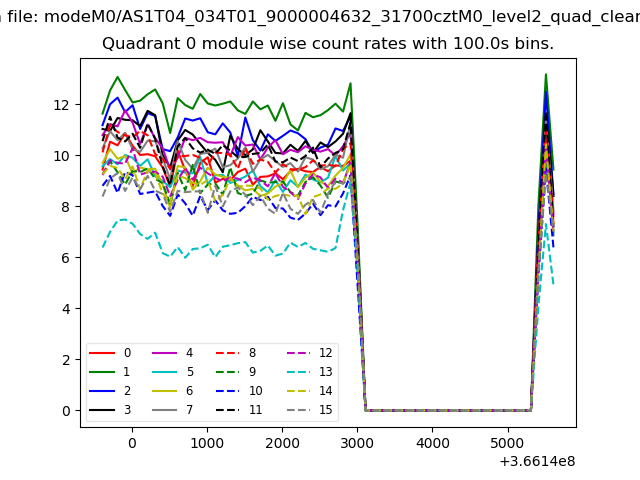 |
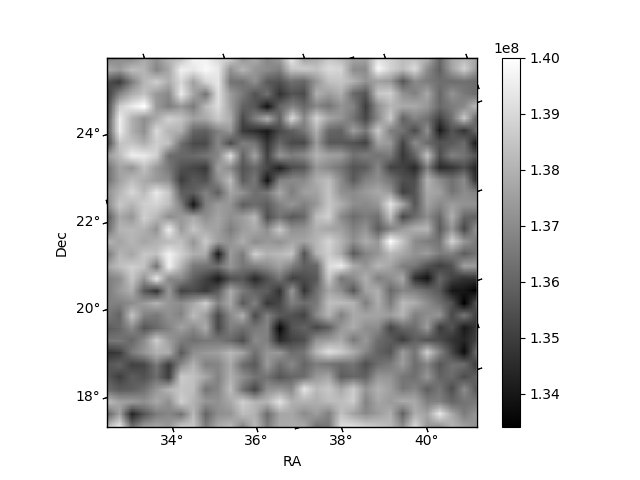 |
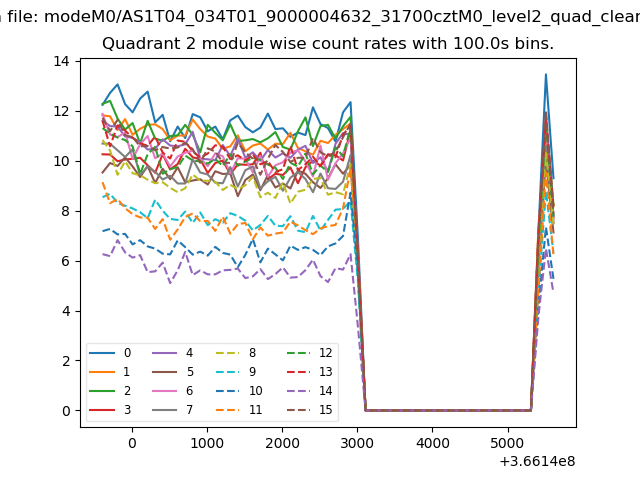
| Module-wise count rates for Quadrant B Data is divided into 100 sec bins |
 |
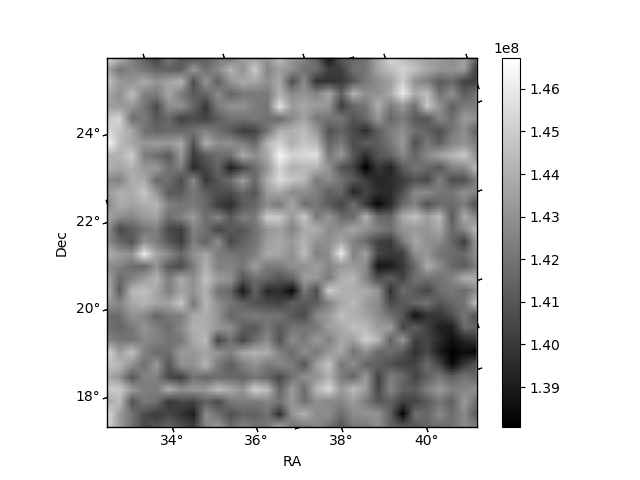 |
| Module-wise count rates for Quadrant C Data is divided into 100 sec bins |
 |
 |
| Module-wise count rates for Quadrant D Data is divided into 100 sec bins |
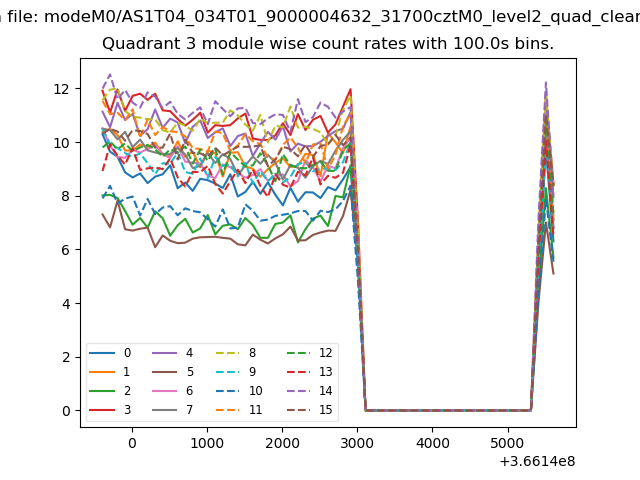 |
 |
| Parameter | Plot |
|---|---|
| CZT HV Monitor | 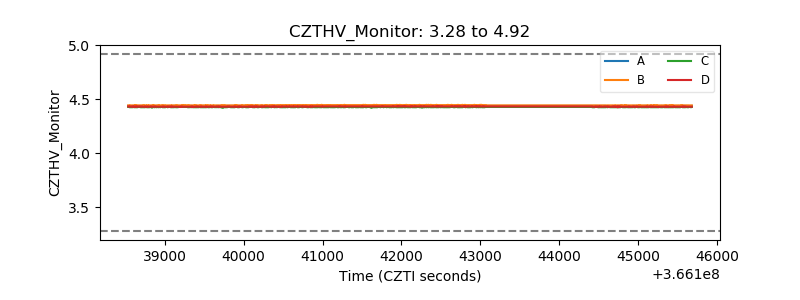 |
| D_VDD | 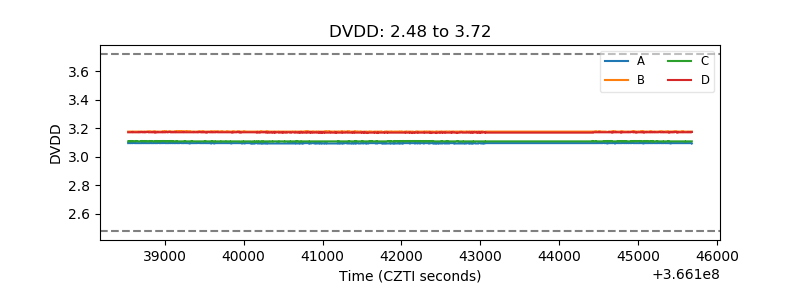 |
| Temperature 1 | 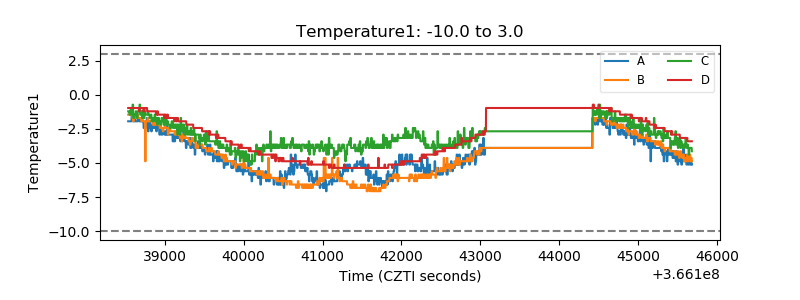 |
| Veto HV Monitor | 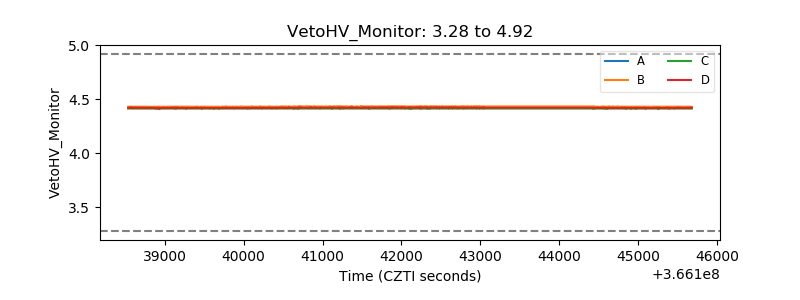 |
| Veto LLD | 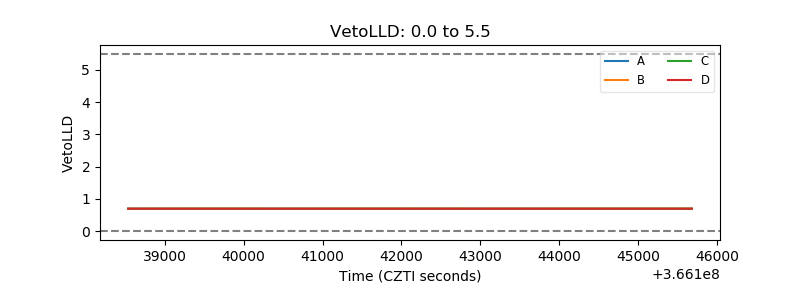 |
| Alpha Counter | 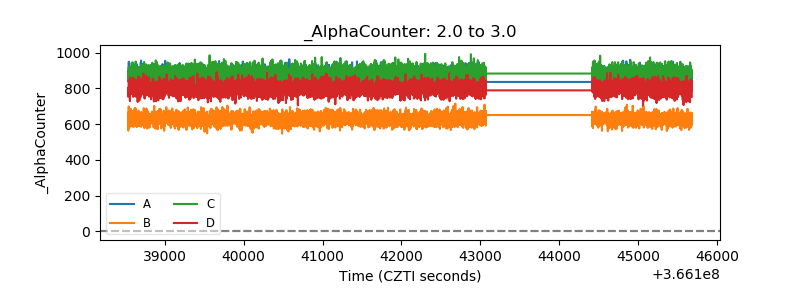 |
| _CPM_Rate | 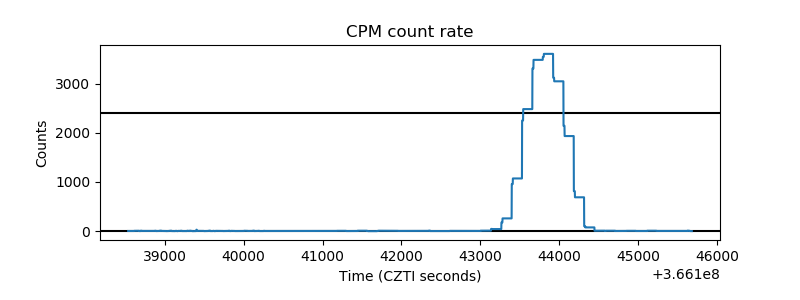 |
| CZT Counter | 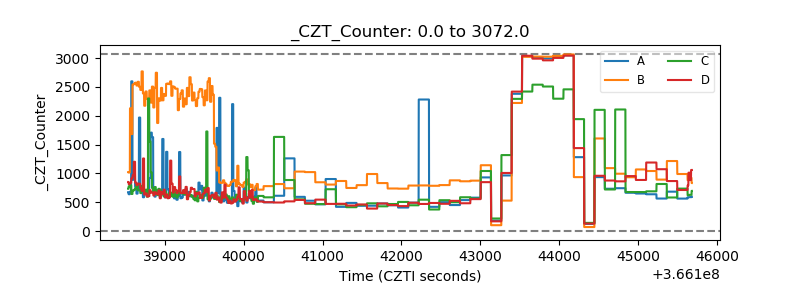 |
| +2.5 Volts monitor |  |
| +5 Volts monitor |  |
| _ROLL_ROT | 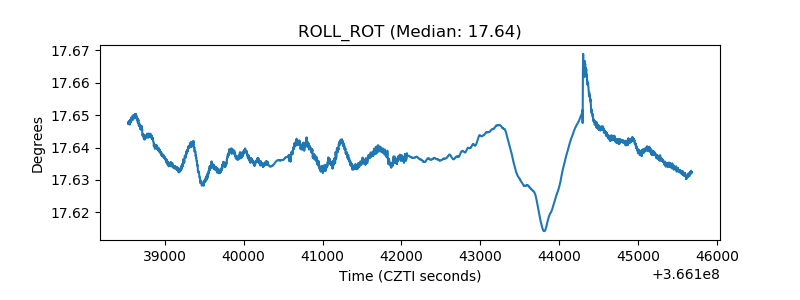 |
| _Roll_DEC | 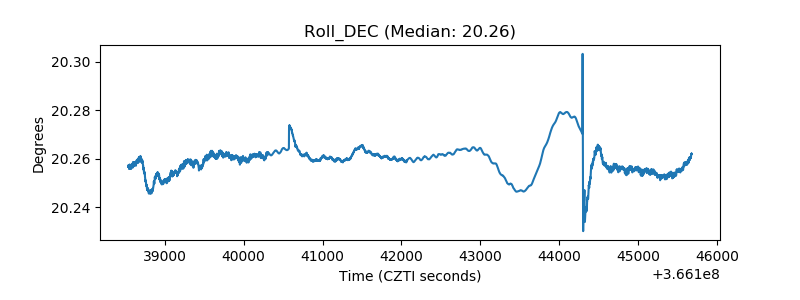 |
| _Roll_RA | 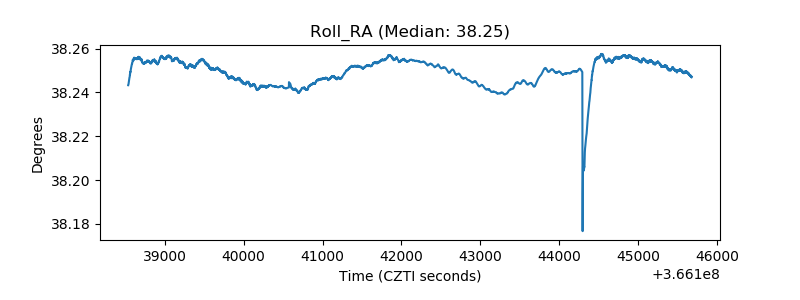 |
| Veto Counter | 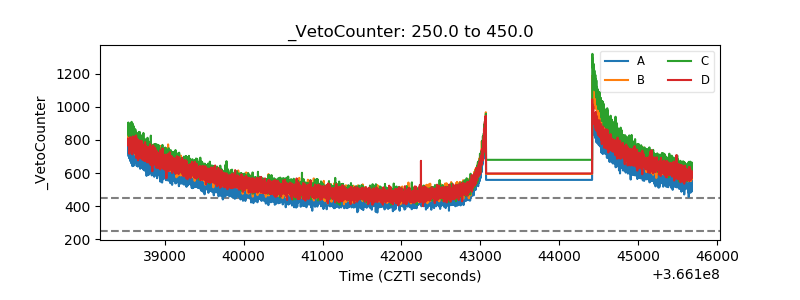 |