| Param | Original file | Final file |
|---|---|---|
| Filename | modeM0/AS1T04_034T01_9000004632_31701cztM0_level2.evt | modeM0/AS1T04_034T01_9000004632_31701cztM0_level2_quad_clean.evt |
| Size (bytes) | 606,467,520 | 99,141,120 |
| Size | 578.4 MB | 94.5 MB |
| Events in quadrant A | 3,590,146 | 646,347 |
| Events in quadrant B | 5,617,292 | 653,676 |
| Events in quadrant C | 4,131,250 | 649,367 |
| Events in quadrant D | 4,612,040 | 623,181 |
| Mode M9 | |||
|---|---|---|---|
| Quadrant | BADHDUFLAG | Total packets | Discarded packets |
| A | 0 | 14 | 0 |
| B | 0 | 14 | 0 |
| C | 0 | 14 | 0 |
| D | 0 | 14 | 0 |
| Mode SS | |||
|---|---|---|---|
| Quadrant | BADHDUFLAG | Total packets | Discarded packets |
| A | 0 | 124 | 0 |
| B | 0 | 124 | 0 |
| C | 0 | 124 | 0 |
| D | 0 | 124 | 0 |
| Mode M0 | |||
|---|---|---|---|
| Quadrant | BADHDUFLAG | Total packets | Discarded packets |
| A | 0 | 14806 | 2 |
| B | 0 | 20876 | 3 |
| C | 0 | 16447 | 2 |
| D | 0 | 17802 | 2 |
| Quadrant | Total seconds | Saturated seconds | Saturation percentage |
|---|---|---|---|
| A | 6162 | 98 | 1.590393% |
| B | 6162 | 348 | 5.647517% |
| C | 6162 | 382 | 6.199286% |
| D | 6162 | 272 | 4.414151% |
Noise dominated data is calculated using 1-second bins in cleaned event files. If a bin has >2000 counts, and if more than 50% of those come from <1% of pixels, then it is considered to be noise-dominated and hence unusable.
| Quadrant | # 1 sec bins | Bins with >0 counts | Bins with >2000 counts | High rate bins dominated by noise | Noise dominated (total time) | Noise dominated (detector-on time) | Marked lightcurve |
|---|---|---|---|---|---|---|---|
| A | 7507 | 6163 | 11 | 11 | 0.15% | 0.18% | 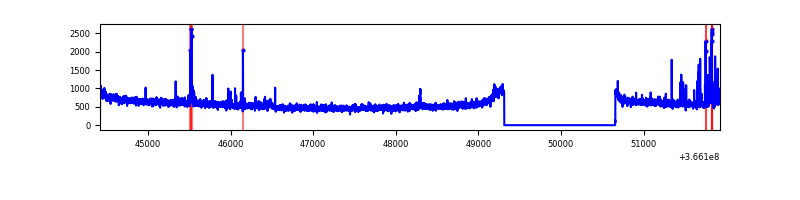 |
| B | 7507 | 6163 | 82 | 82 | 1.09% | 1.33% | 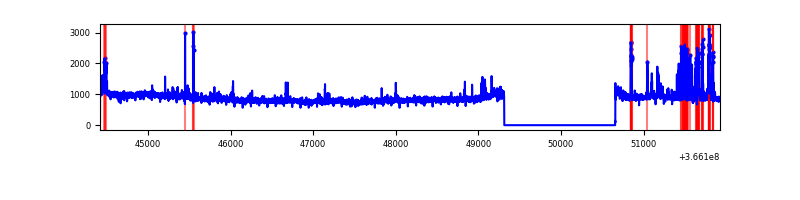 |
| C | 7507 | 6163 | 117 | 117 | 1.56% | 1.90% | 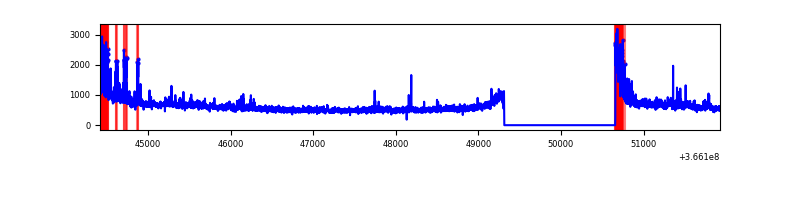 |
| D | 7507 | 6163 | 152 | 152 | 2.02% | 2.47% | 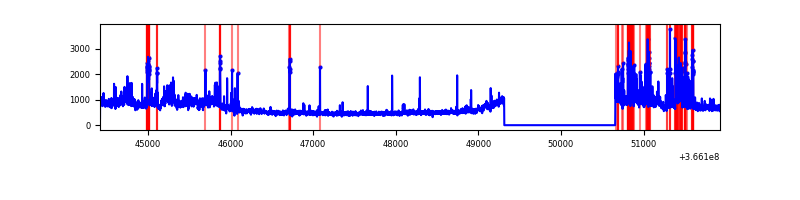 |
Top three noisy pixels from each quadrant. If the there are fewer than three noisy pixels in the level2.evt file, extra rows are filled as -1
| Pixel properties | Quadrant properties | ||||||
|---|---|---|---|---|---|---|---|
| Quadrant | DetID | PixID | Counts | Sigma | Mean | Median | Sigma |
| A | 0 | 13 | 171389 | 979.33 | 882 | 869 | 174.1 |
| A | 14 | 238 | 13872 | 74.68 | 882 | 869 | 174.1 |
| A | 13 | 254 | 11814 | 62.86 | 882 | 869 | 174.1 |
| B | 6 | 159 | 1762695 | 10735.59 | 873 | 855 | 164.1 |
| B | 4 | 80 | 181019 | 1097.81 | 873 | 855 | 164.1 |
| B | 5 | 172 | 127356 | 770.82 | 873 | 855 | 164.1 |
| C | 0 | 10 | 455378 | 2321.09 | 848 | 859 | 195.8 |
| C | 14 | 238 | 139219 | 706.56 | 848 | 859 | 195.8 |
| C | 3 | 233 | 114357 | 579.6 | 848 | 859 | 195.8 |
| D | 8 | 195 | 704600 | 3498.46 | 858 | 841 | 201.2 |
| D | 13 | 249 | 402878 | 1998.57 | 858 | 841 | 201.2 |
| D | 12 | 233 | 111354 | 549.37 | 858 | 841 | 201.2 |
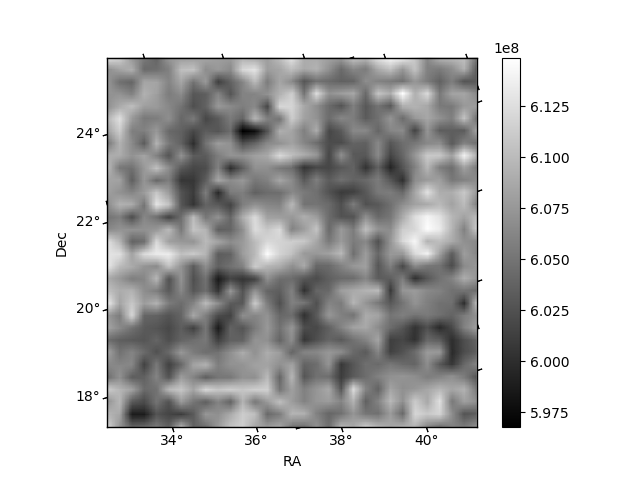
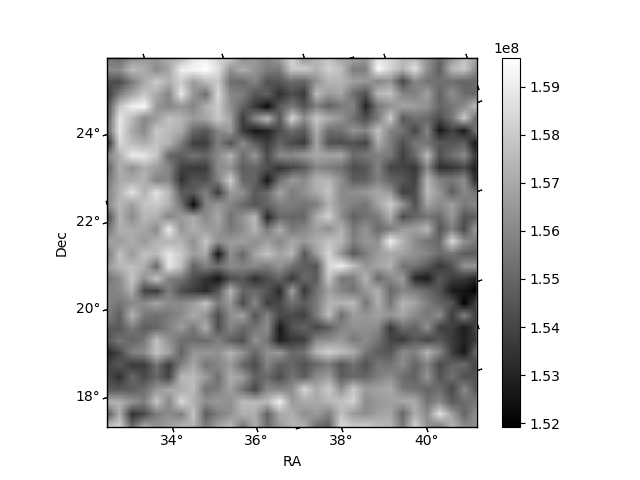
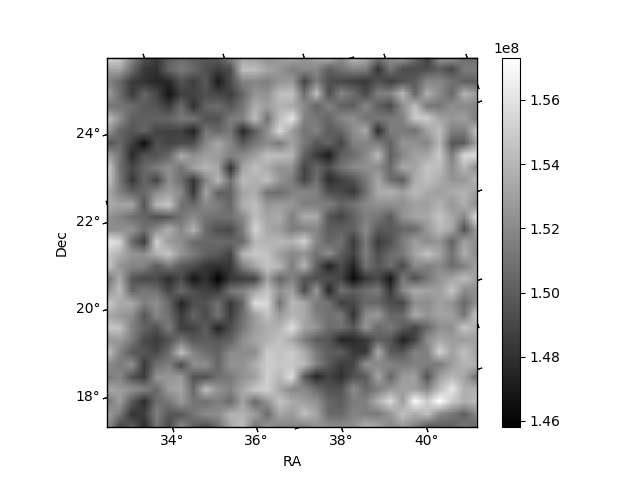
Histogram calculated using DETX and DETY for each event in the final _common_clean file
| Quadrant A | 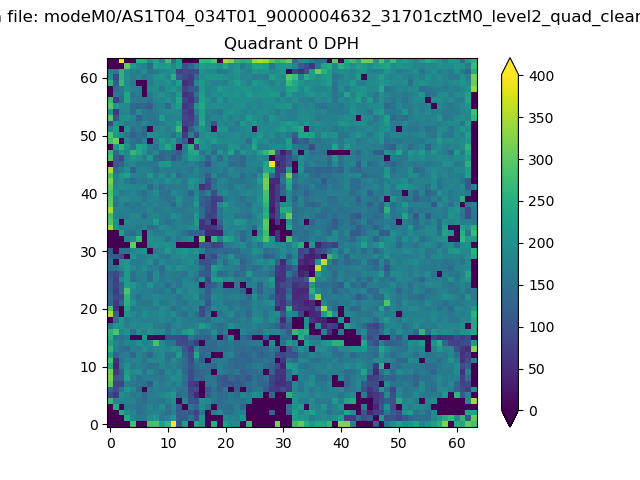 |
 |
Quadrant B |
|---|---|---|---|
| Quadrant D | 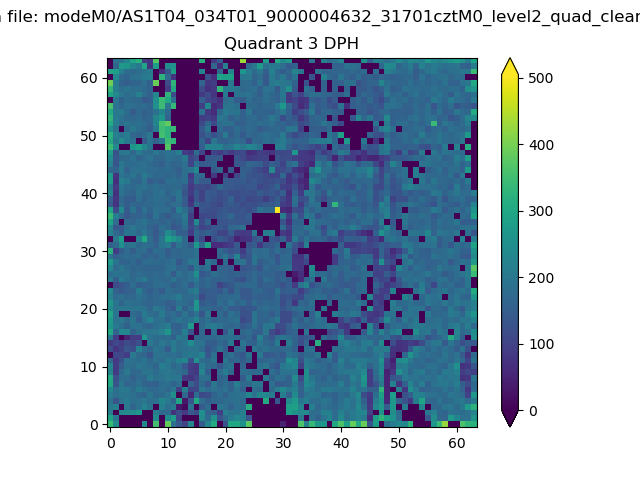 |
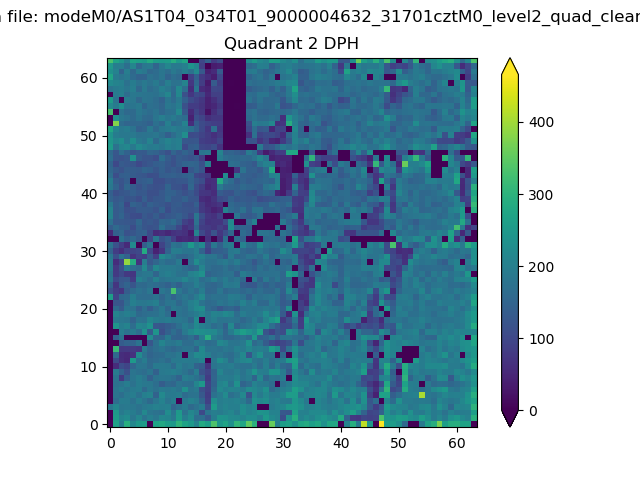 |
Quadrant C |
| Plot type | Count rate plots | Images |
|---|---|---|
| Comparison with Poisson distribution Blue bars denote a histogram of data divided into 1 sec bins. Red curve is a Poisson curve with rate = median count rate of data. |
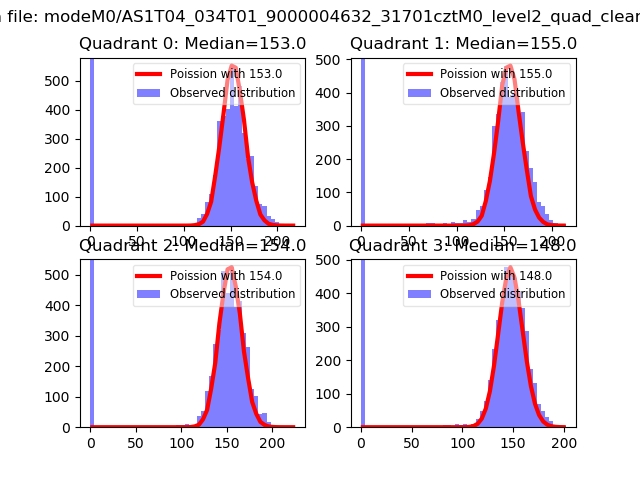 |
 |
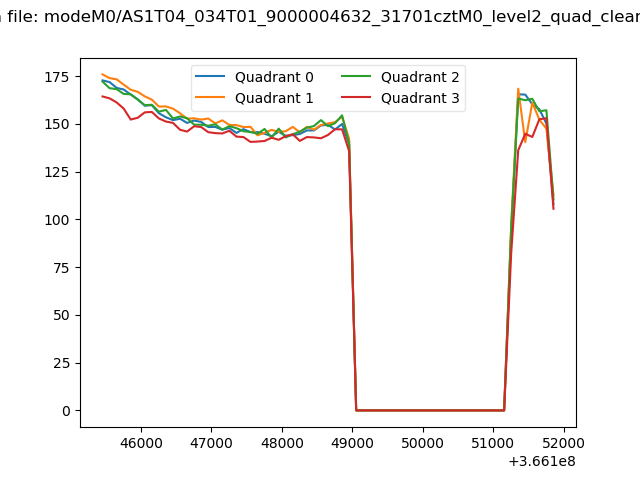
| Quadrant-wise count rates Data is divided into 100 sec bins |
 |
|
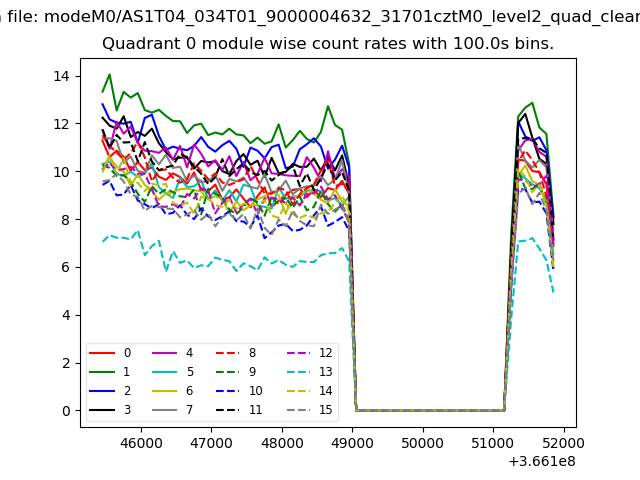
| Module-wise count rates for Quadrant A Data is divided into 100 sec bins |
 |
 |
| Module-wise count rates for Quadrant B Data is divided into 100 sec bins |
 |
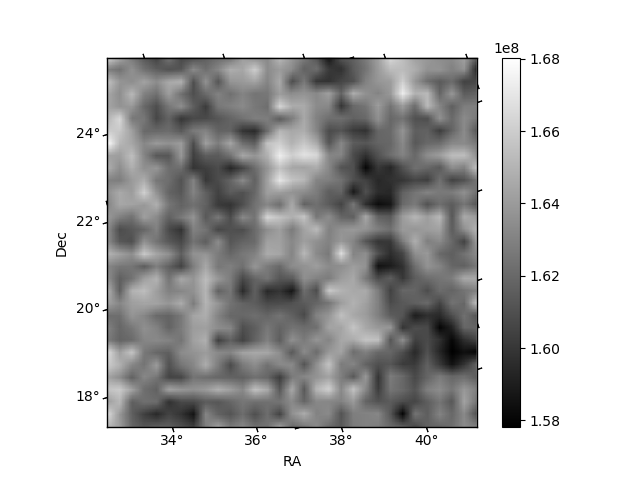 |
| Module-wise count rates for Quadrant C Data is divided into 100 sec bins |
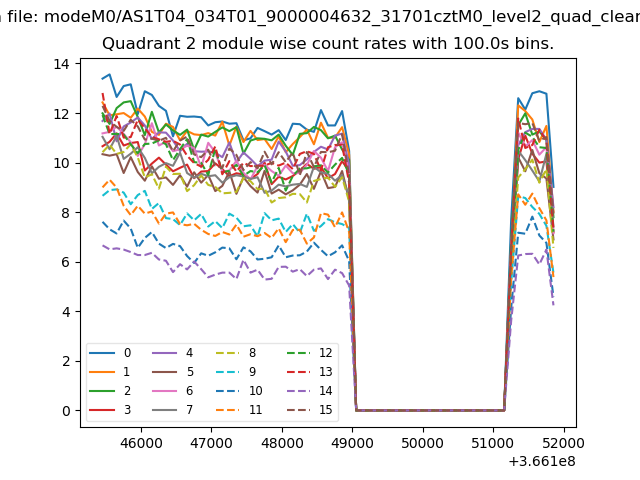 |
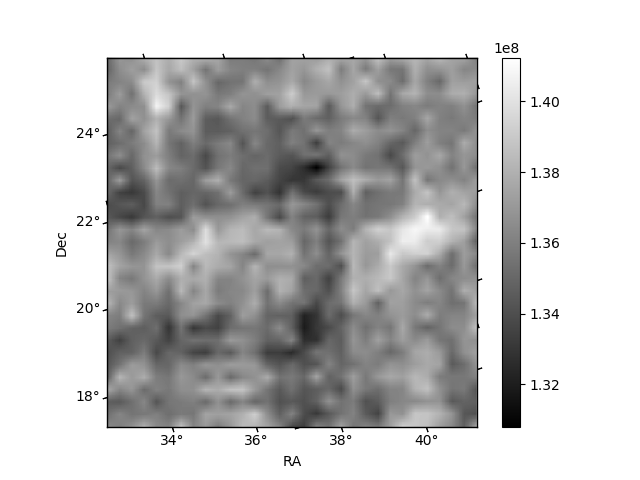 |
| Module-wise count rates for Quadrant D Data is divided into 100 sec bins |
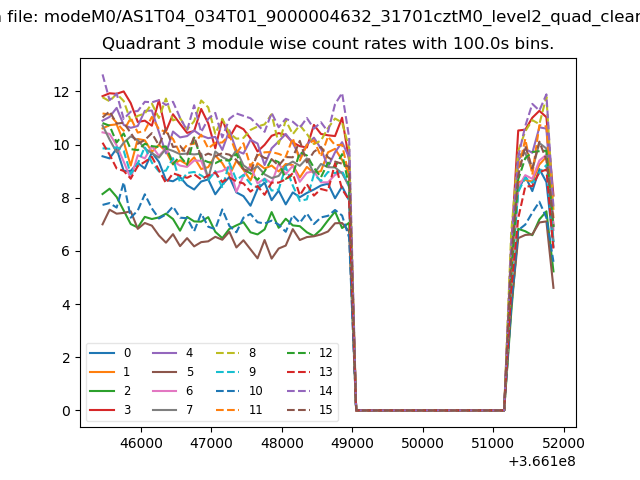 |
 |
| Parameter | Plot |
|---|---|
| CZT HV Monitor |  |
| D_VDD | 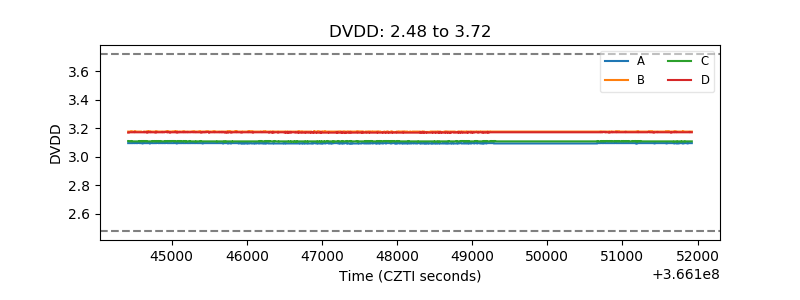 |
| Temperature 1 | 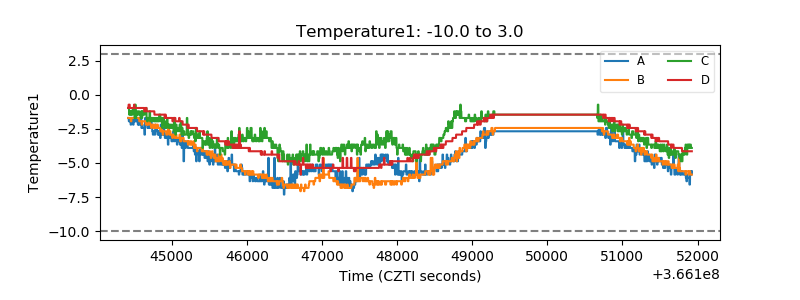 |
| Veto HV Monitor | 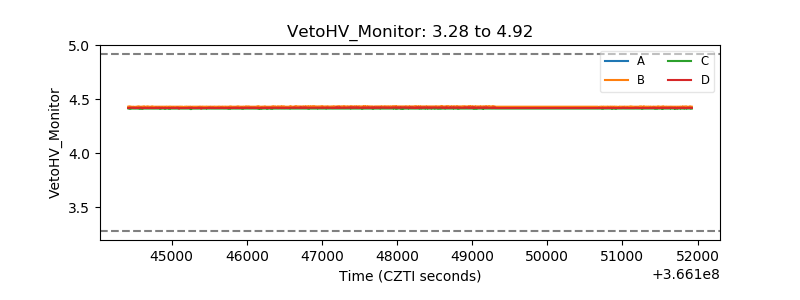 |
| Veto LLD | 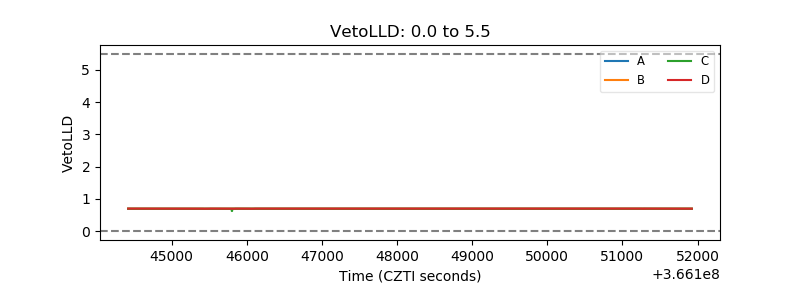 |
| Alpha Counter | 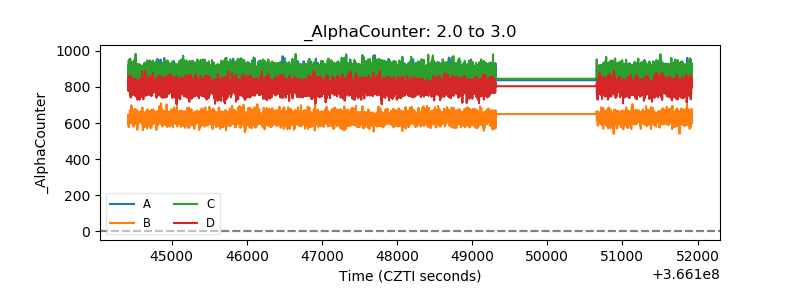 |
| _CPM_Rate | 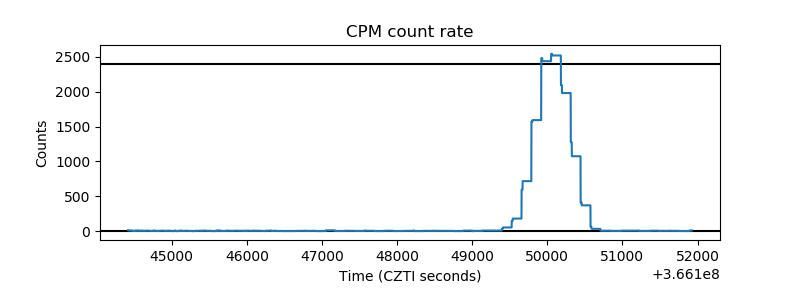 |
| CZT Counter | 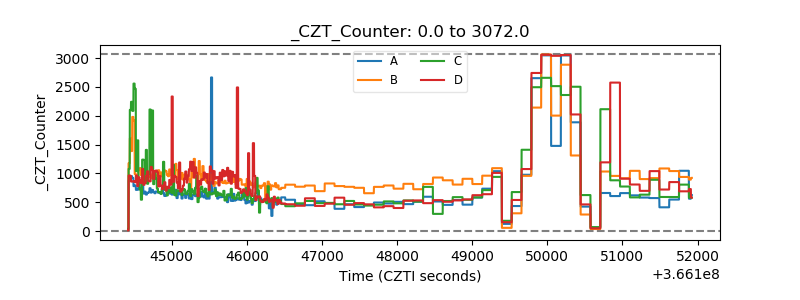 |
| +2.5 Volts monitor |  |
| +5 Volts monitor |  |
| _ROLL_ROT | 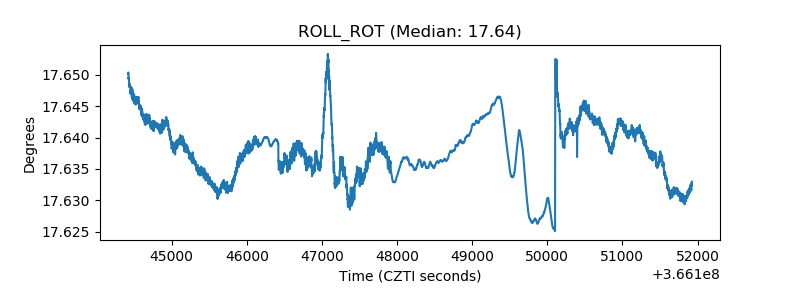 |
| _Roll_DEC | 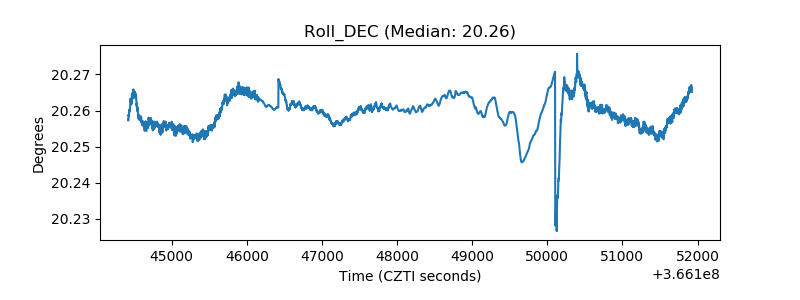 |
| _Roll_RA | 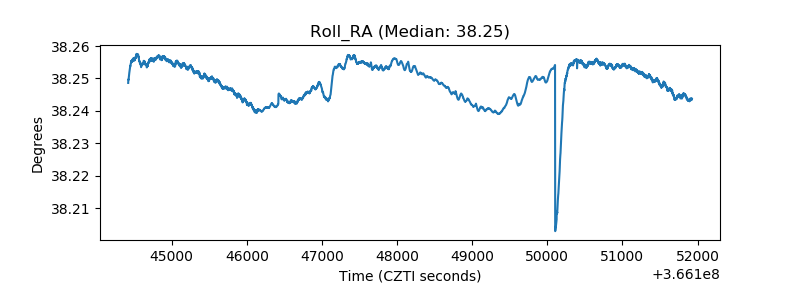 |
| Veto Counter | 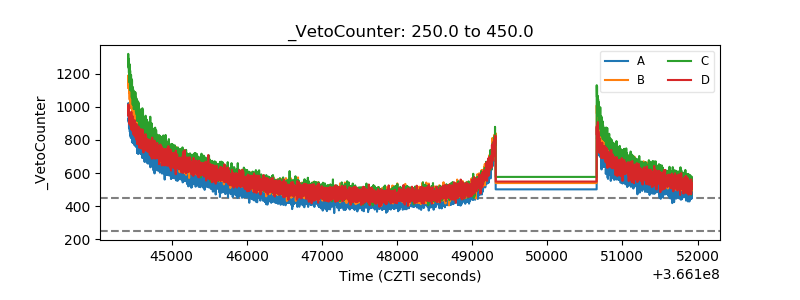 |