| Param | Original file | Final file |
|---|---|---|
| Filename | modeM0/AS1T04_034T01_9000004632_31703cztM0_level2.evt | modeM0/AS1T04_034T01_9000004632_31703cztM0_level2_quad_clean.evt |
| Size (bytes) | 669,049,920 | 102,386,880 |
| Size | 638.1 MB | 97.6 MB |
| Events in quadrant A | 4,050,028 | 670,426 |
| Events in quadrant B | 6,466,545 | 662,951 |
| Events in quadrant C | 4,143,152 | 660,230 |
| Events in quadrant D | 5,144,271 | 634,301 |
| Mode M9 | |||
|---|---|---|---|
| Quadrant | BADHDUFLAG | Total packets | Discarded packets |
| A | 0 | 21 | 0 |
| B | 0 | 21 | 0 |
| C | 0 | 21 | 0 |
| D | 0 | 21 | 0 |
| Mode SS | |||
|---|---|---|---|
| Quadrant | BADHDUFLAG | Total packets | Discarded packets |
| A | 0 | 140 | 0 |
| B | 0 | 140 | 0 |
| C | 0 | 140 | 0 |
| D | 0 | 140 | 0 |
| Mode M0 | |||
|---|---|---|---|
| Quadrant | BADHDUFLAG | Total packets | Discarded packets |
| A | 0 | 16340 | 2 |
| B | 0 | 23836 | 2 |
| C | 0 | 16556 | 2 |
| D | 0 | 19621 | 2 |
| Quadrant | Total seconds | Saturated seconds | Saturation percentage |
|---|---|---|---|
| A | 6778 | 187 | 2.758926% |
| B | 6779 | 647 | 9.544181% |
| C | 6779 | 393 | 5.797315% |
| D | 6779 | 510 | 7.523234% |
Noise dominated data is calculated using 1-second bins in cleaned event files. If a bin has >2000 counts, and if more than 50% of those come from <1% of pixels, then it is considered to be noise-dominated and hence unusable.
| Quadrant | # 1 sec bins | Bins with >0 counts | Bins with >2000 counts | High rate bins dominated by noise | Noise dominated (total time) | Noise dominated (detector-on time) | Marked lightcurve |
|---|---|---|---|---|---|---|---|
| A | 8878 | 6780 | 88 | 88 | 0.99% | 1.30% | 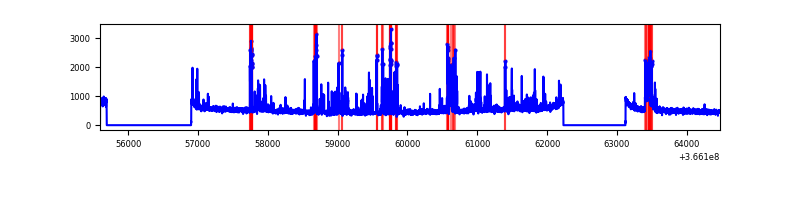 |
| B | 8879 | 6781 | 370 | 370 | 4.17% | 5.46% | 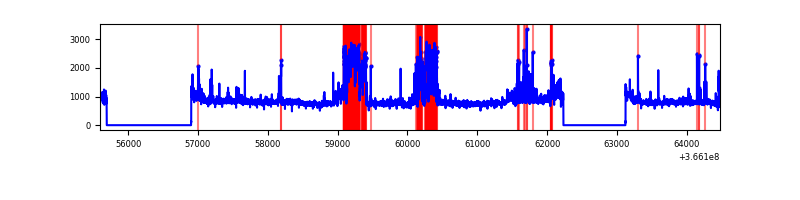 |
| C | 8879 | 6781 | 126 | 126 | 1.42% | 1.86% | 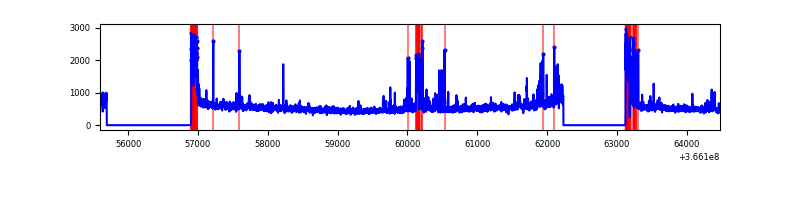 |
| D | 8879 | 6781 | 344 | 344 | 3.87% | 5.07% | 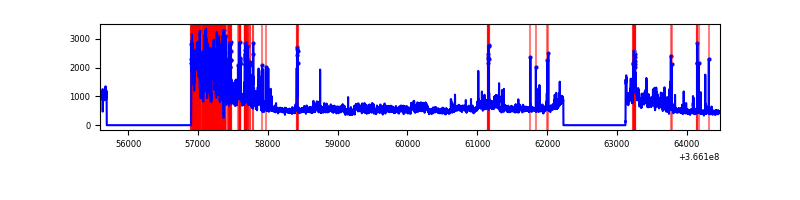 |
Top three noisy pixels from each quadrant. If the there are fewer than three noisy pixels in the level2.evt file, extra rows are filled as -1
| Pixel properties | Quadrant properties | ||||||
|---|---|---|---|---|---|---|---|
| Quadrant | DetID | PixID | Counts | Sigma | Mean | Median | Sigma |
| A | 0 | 13 | 707045 | 4080.06 | 864 | 848 | 173.1 |
| A | 13 | 254 | 11893 | 63.81 | 864 | 848 | 173.1 |
| A | 3 | 137 | 8724 | 45.5 | 864 | 848 | 173.1 |
| B | 6 | 159 | 1844958 | 11309.04 | 847 | 826 | 163.1 |
| B | 4 | 80 | 1139846 | 6984.98 | 847 | 826 | 163.1 |
| B | 5 | 172 | 86451 | 525.09 | 847 | 826 | 163.1 |
| C | 0 | 10 | 447982 | 2307.24 | 826 | 833 | 193.8 |
| C | 10 | 22 | 204705 | 1051.96 | 826 | 833 | 193.8 |
| C | 14 | 238 | 133103 | 682.5 | 826 | 833 | 193.8 |
| D | 8 | 195 | 972609 | 4953.06 | 820 | 797 | 196.2 |
| D | 13 | 249 | 843411 | 4294.57 | 820 | 797 | 196.2 |
| D | 12 | 227 | 117403 | 594.31 | 820 | 797 | 196.2 |
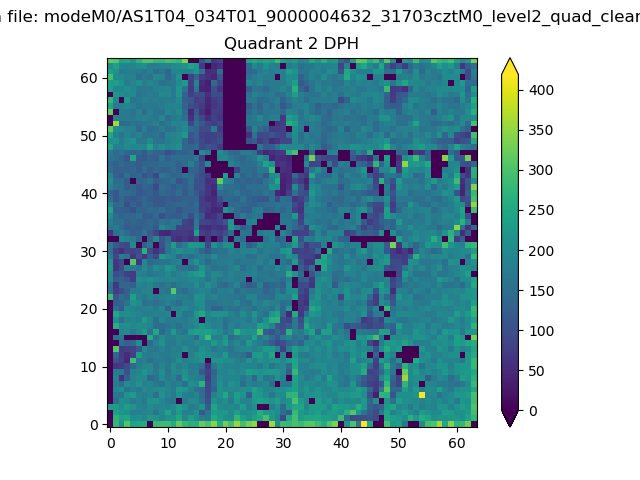
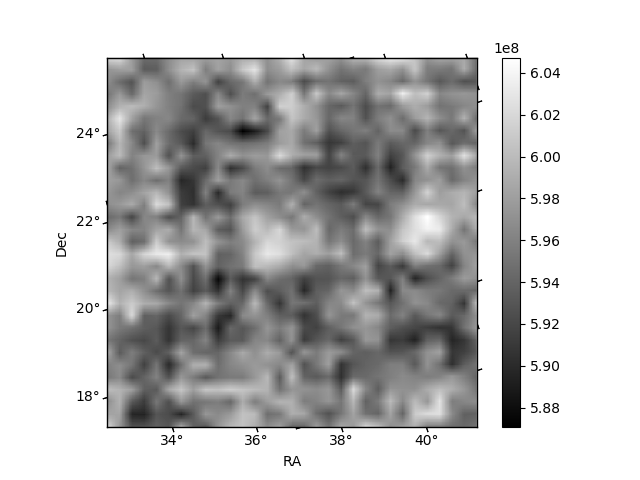
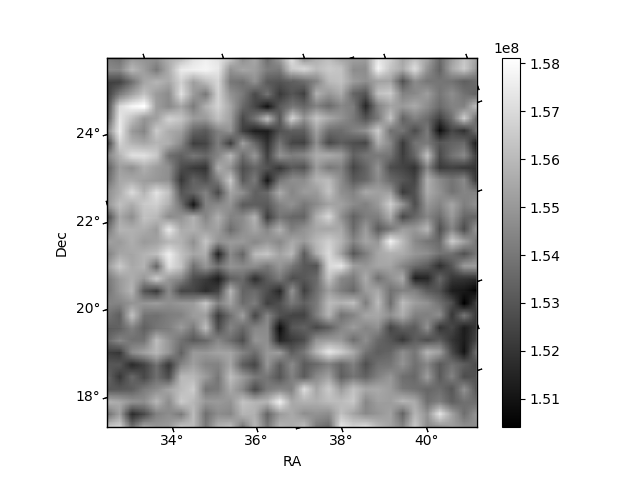
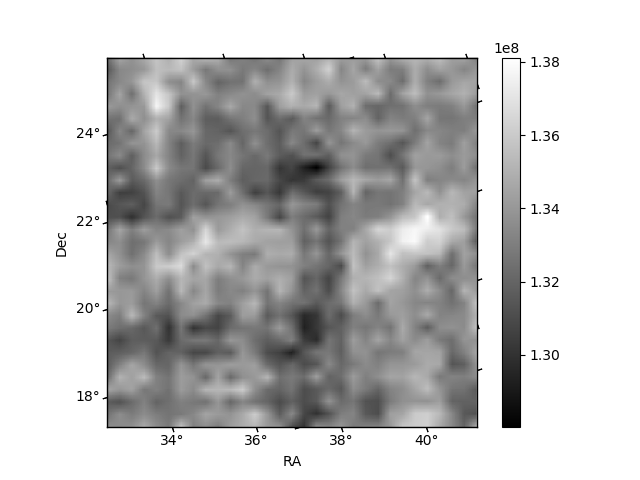
Histogram calculated using DETX and DETY for each event in the final _common_clean file
| Quadrant A | 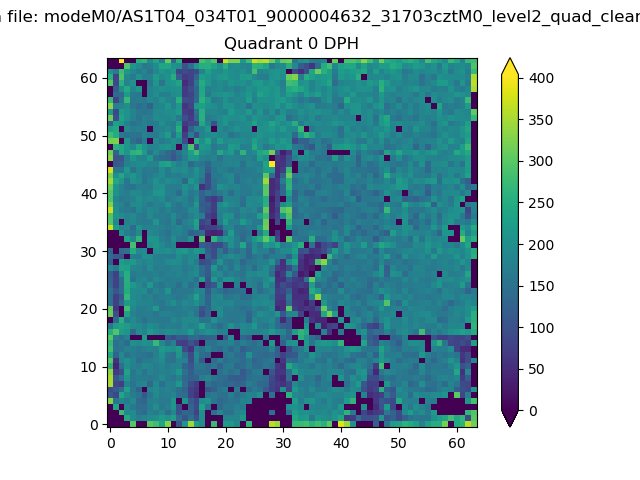 |
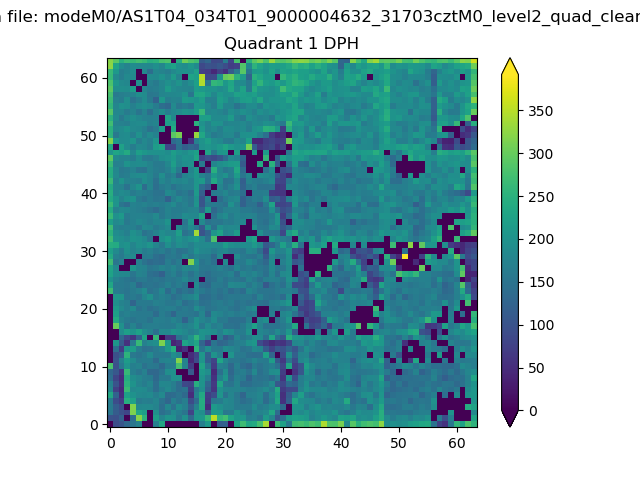 |
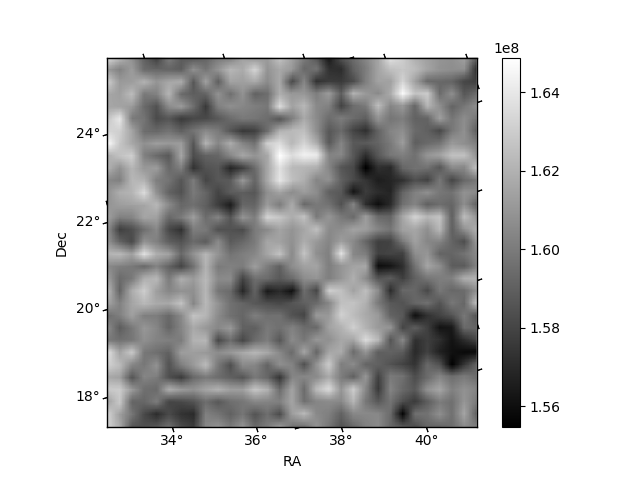
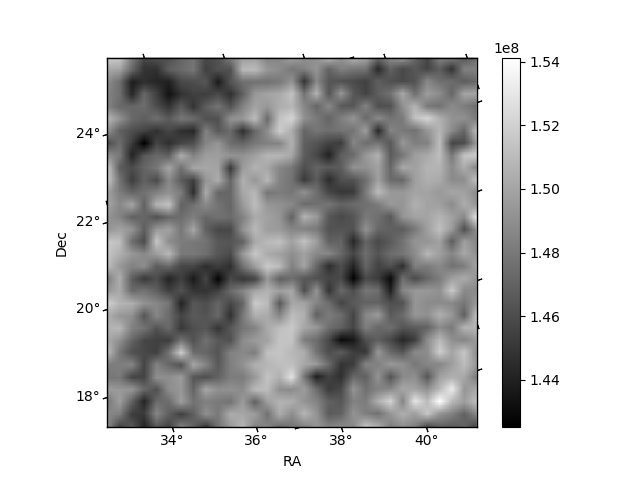
Quadrant B |
|---|---|---|---|
| Quadrant D | 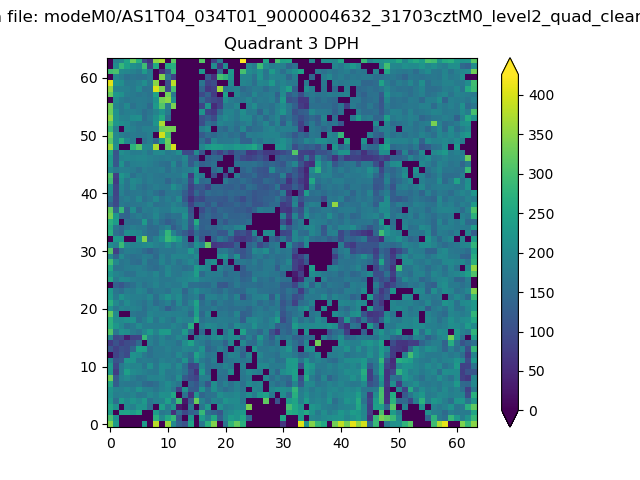 |
 |
Quadrant C |
| Plot type | Count rate plots | Images |
|---|---|---|
| Comparison with Poisson distribution Blue bars denote a histogram of data divided into 1 sec bins. Red curve is a Poisson curve with rate = median count rate of data. |
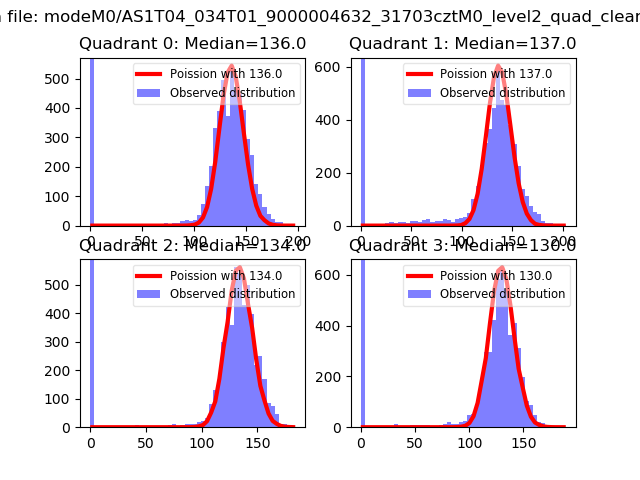 |
 |
| Quadrant-wise count rates Data is divided into 100 sec bins |
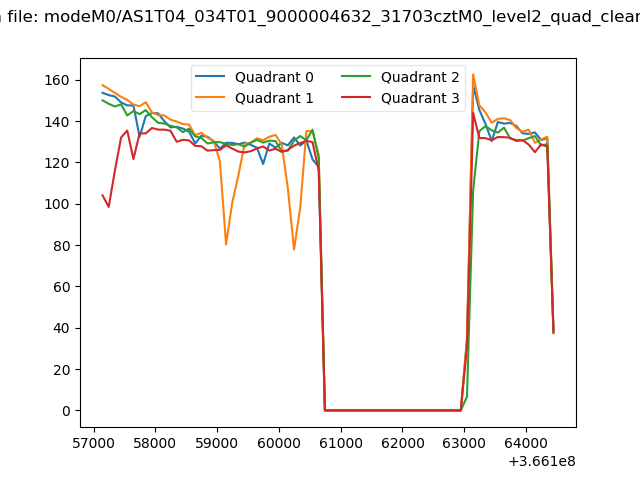 |
|
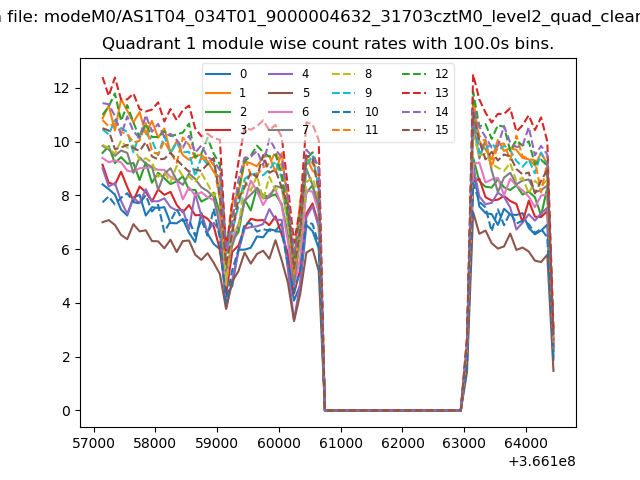
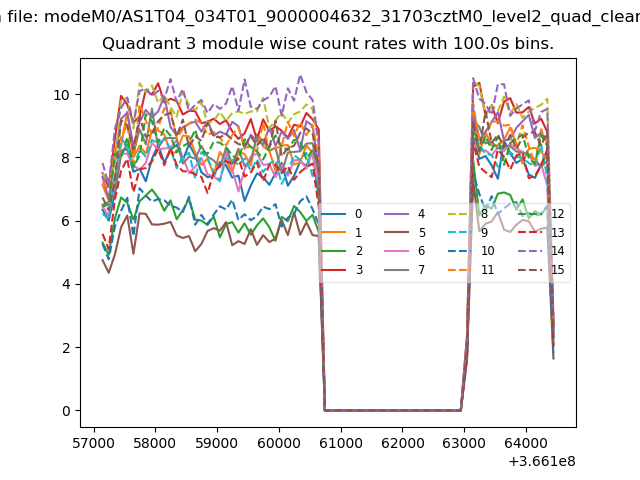
| Module-wise count rates for Quadrant A Data is divided into 100 sec bins |
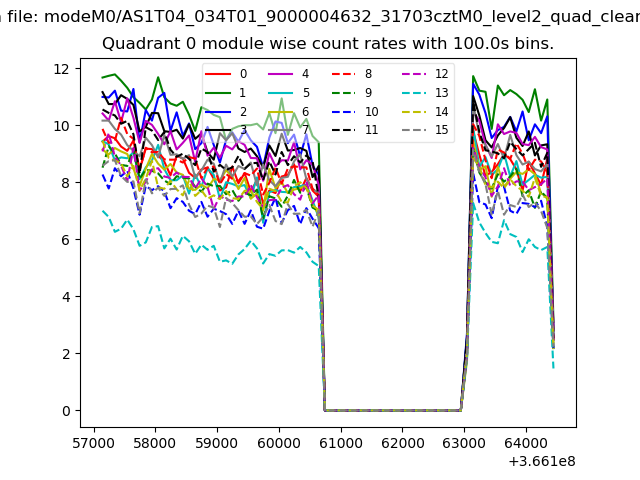 |
 |
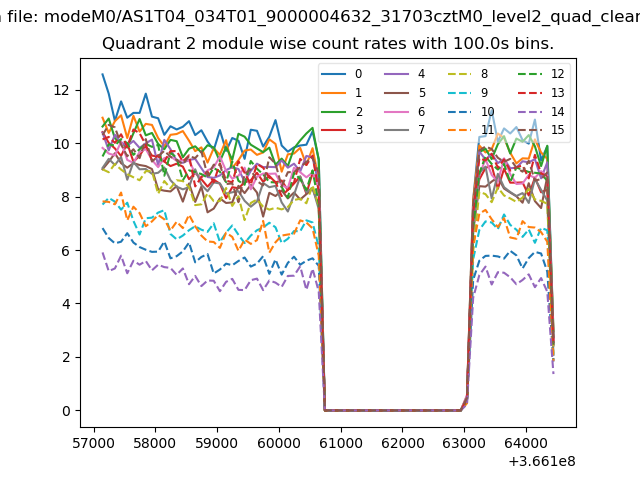
| Module-wise count rates for Quadrant B Data is divided into 100 sec bins |
 |
 |
| Module-wise count rates for Quadrant C Data is divided into 100 sec bins |
 |
 |
| Module-wise count rates for Quadrant D Data is divided into 100 sec bins |
 |
 |
| Parameter | Plot |
|---|---|
| CZT HV Monitor |  |
| D_VDD | 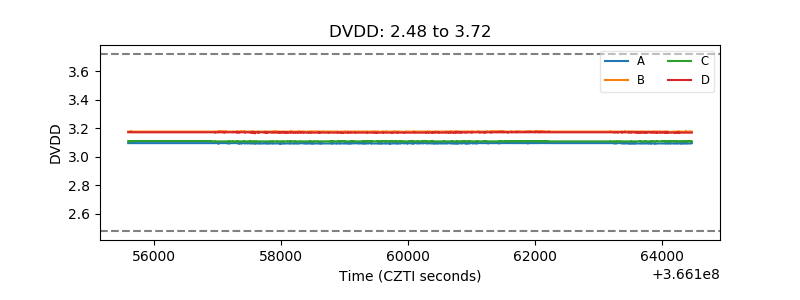 |
| Temperature 1 |  |
| Veto HV Monitor | 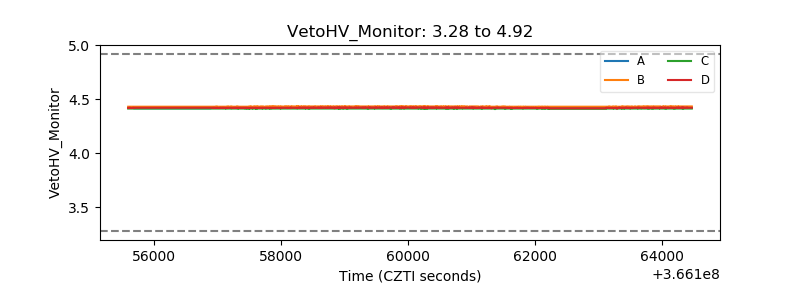 |
| Veto LLD |  |
| Alpha Counter | 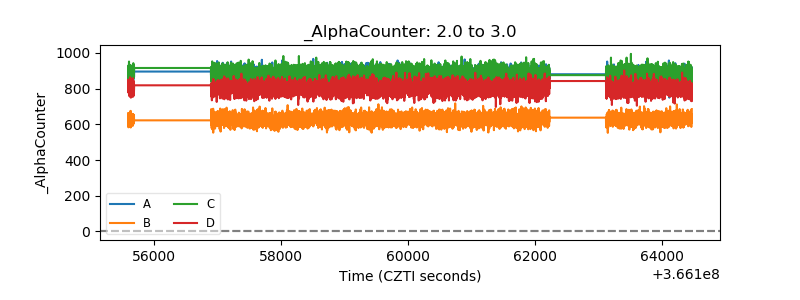 |
| _CPM_Rate | 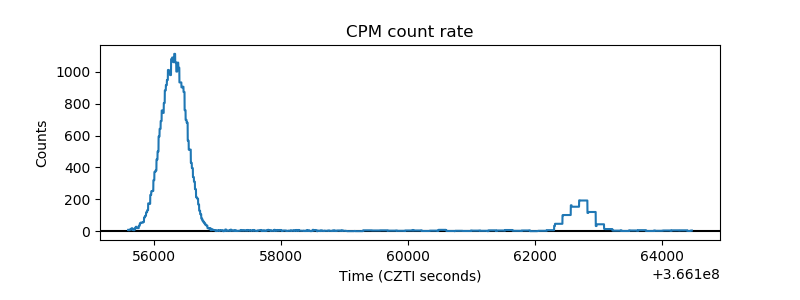 |
| CZT Counter | 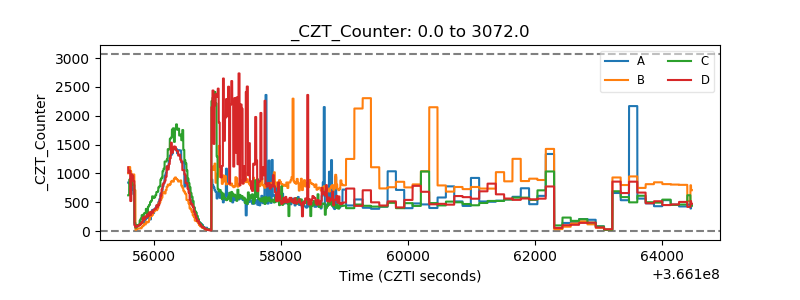 |
| +2.5 Volts monitor |  |
| +5 Volts monitor |  |
| _ROLL_ROT | 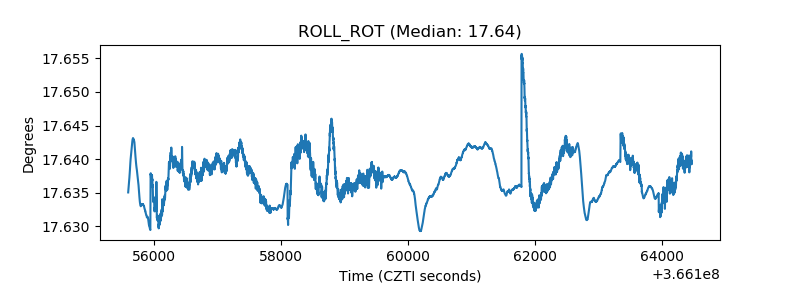 |
| _Roll_DEC | 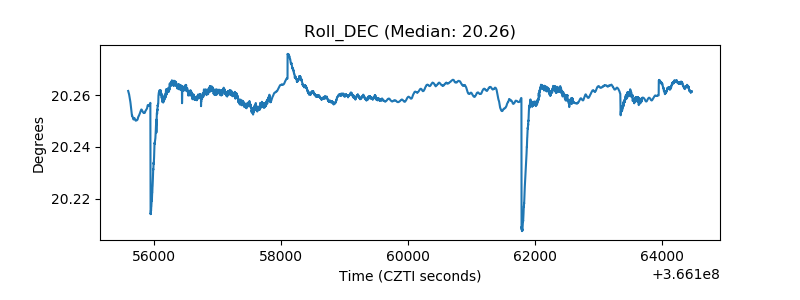 |
| _Roll_RA | 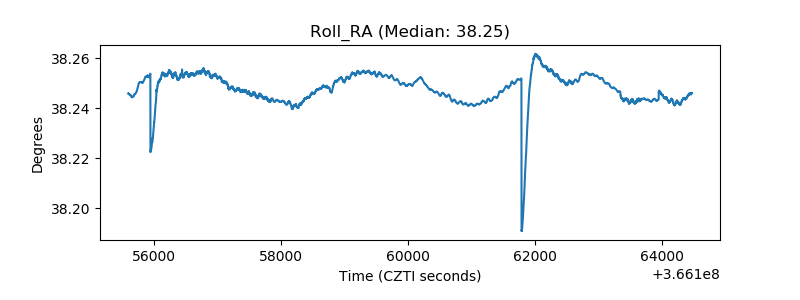 |
| Veto Counter | 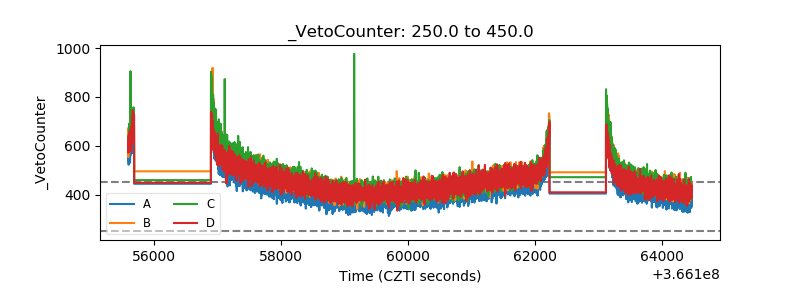 |