| Param | Original file | Final file |
|---|---|---|
| Filename | modeM0/AS1T04_034T01_9000004632_31704cztM0_level2.evt | modeM0/AS1T04_034T01_9000004632_31704cztM0_level2_quad_clean.evt |
| Size (bytes) | 640,857,600 | 102,335,040 |
| Size | 611.2 MB | 97.6 MB |
| Events in quadrant A | 4,248,275 | 653,585 |
| Events in quadrant B | 6,050,062 | 664,096 |
| Events in quadrant C | 4,289,696 | 638,556 |
| Events in quadrant D | 4,327,562 | 635,648 |
| Mode M9 | |||
|---|---|---|---|
| Quadrant | BADHDUFLAG | Total packets | Discarded packets |
| A | 0 | 7 | 0 |
| B | 0 | 8 | 0 |
| C | 0 | 8 | 0 |
| D | 0 | 8 | 0 |
| Mode SS | |||
|---|---|---|---|
| Quadrant | BADHDUFLAG | Total packets | Discarded packets |
| A | 0 | 148 | 0 |
| B | 0 | 148 | 0 |
| C | 0 | 148 | 0 |
| D | 0 | 148 | 0 |
| Mode M0 | |||
|---|---|---|---|
| Quadrant | BADHDUFLAG | Total packets | Discarded packets |
| A | 0 | 17368 | 3 |
| B | 0 | 23315 | 2 |
| C | 0 | 17472 | 2 |
| D | 0 | 17853 | 2 |
| Quadrant | Total seconds | Saturated seconds | Saturation percentage |
|---|---|---|---|
| A | 7284 | 267 | 3.665568% |
| B | 7284 | 370 | 5.079627% |
| C | 7284 | 282 | 3.871499% |
| D | 7284 | 111 | 1.523888% |
Noise dominated data is calculated using 1-second bins in cleaned event files. If a bin has >2000 counts, and if more than 50% of those come from <1% of pixels, then it is considered to be noise-dominated and hence unusable.
| Quadrant | # 1 sec bins | Bins with >0 counts | Bins with >2000 counts | High rate bins dominated by noise | Noise dominated (total time) | Noise dominated (detector-on time) | Marked lightcurve |
|---|---|---|---|---|---|---|---|
| A | 7639 | 7285 | 109 | 109 | 1.43% | 1.50% | 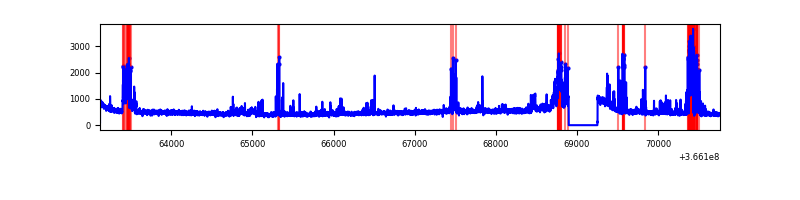 |
| B | 7639 | 7285 | 71 | 71 | 0.93% | 0.97% | 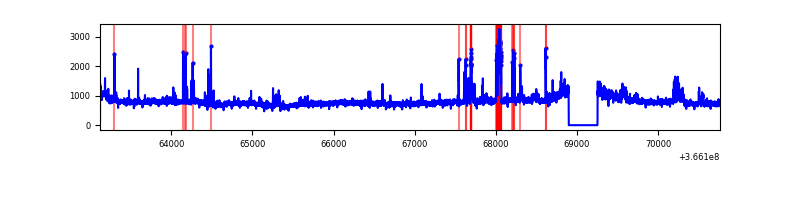 |
| C | 7639 | 7285 | 52 | 52 | 0.68% | 0.71% | 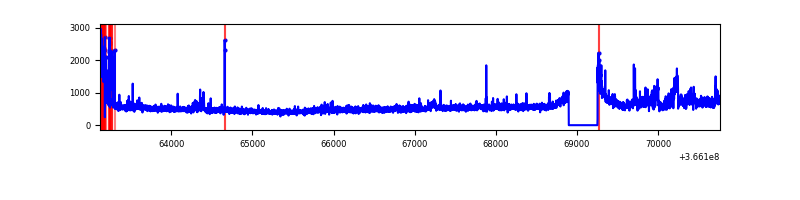 |
| D | 7639 | 7285 | 27 | 27 | 0.35% | 0.37% | 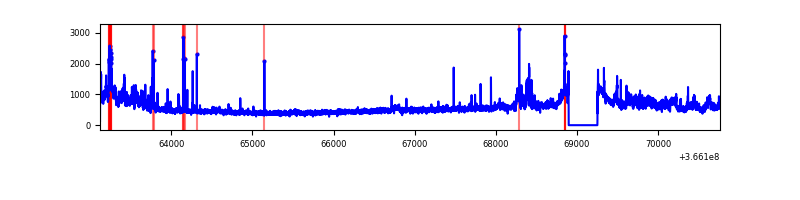 |
Top three noisy pixels from each quadrant. If the there are fewer than three noisy pixels in the level2.evt file, extra rows are filled as -1
| Pixel properties | Quadrant properties | ||||||
|---|---|---|---|---|---|---|---|
| Quadrant | DetID | PixID | Counts | Sigma | Mean | Median | Sigma |
| A | 0 | 13 | 729936 | 3927.91 | 910 | 892 | 185.6 |
| A | 13 | 254 | 13667 | 68.83 | 910 | 892 | 185.6 |
| A | 3 | 137 | 9540 | 46.59 | 910 | 892 | 185.6 |
| B | 6 | 159 | 2021313 | 11409.05 | 907 | 885 | 177.1 |
| B | 5 | 172 | 241317 | 1357.68 | 907 | 885 | 177.1 |
| B | 4 | 80 | 153391 | 861.18 | 907 | 885 | 177.1 |
| C | 3 | 233 | 322612 | 1531.34 | 881 | 886 | 210.1 |
| C | 0 | 10 | 287067 | 1362.15 | 881 | 886 | 210.1 |
| C | 14 | 238 | 140205 | 663.12 | 881 | 886 | 210.1 |
| D | 8 | 195 | 623425 | 2929.86 | 892 | 869 | 212.5 |
| D | 12 | 227 | 245434 | 1150.96 | 892 | 869 | 212.5 |
| D | 13 | 249 | 39120 | 180.02 | 892 | 869 | 212.5 |
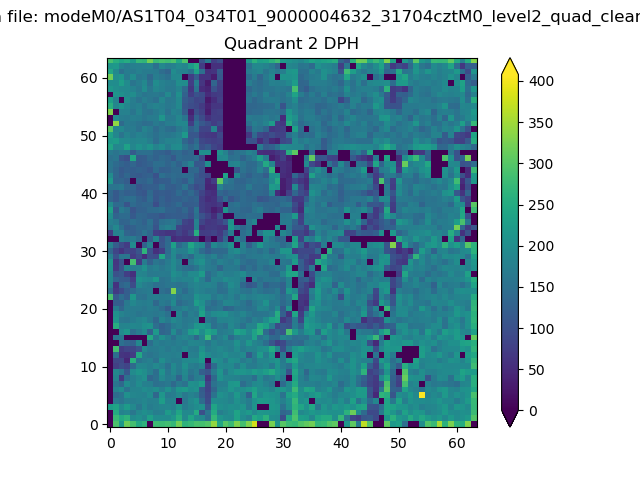
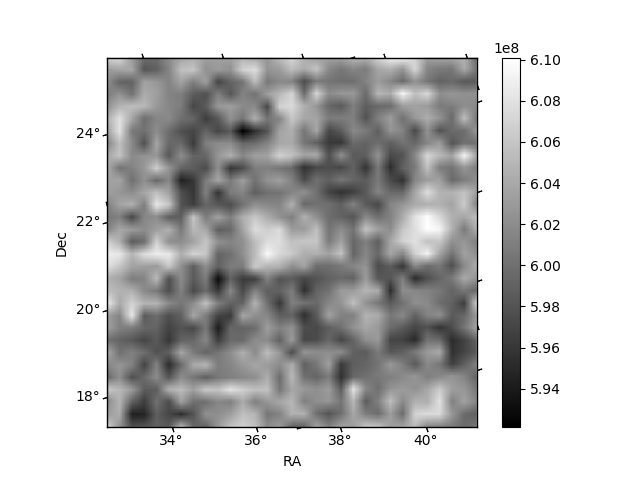
Histogram calculated using DETX and DETY for each event in the final _common_clean file
| Quadrant A | 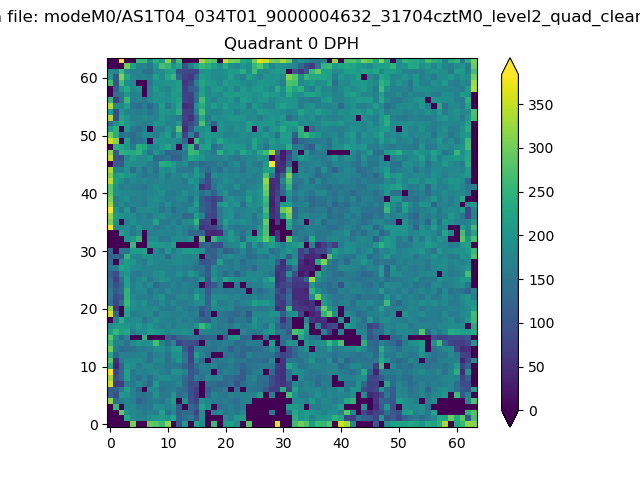 |
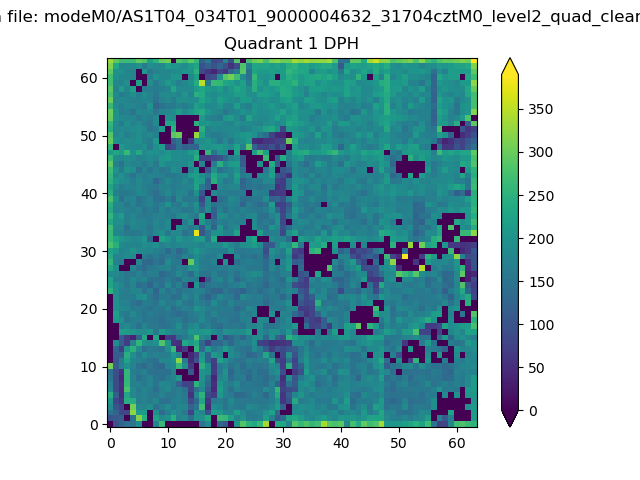 |
Quadrant B |
|---|---|---|---|
| Quadrant D | 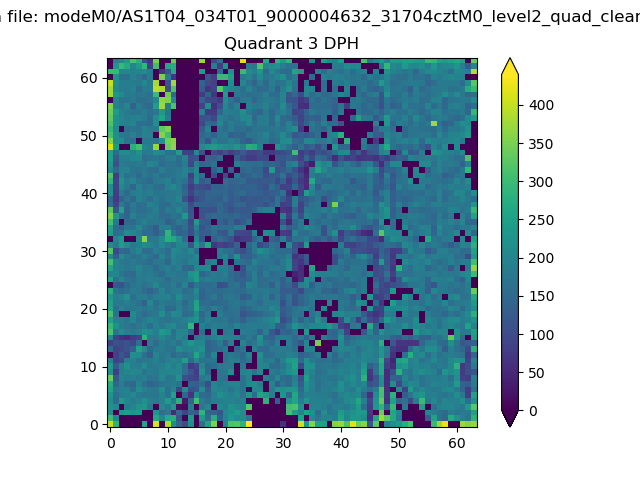 |
 |
Quadrant C |
| Plot type | Count rate plots | Images |
|---|---|---|
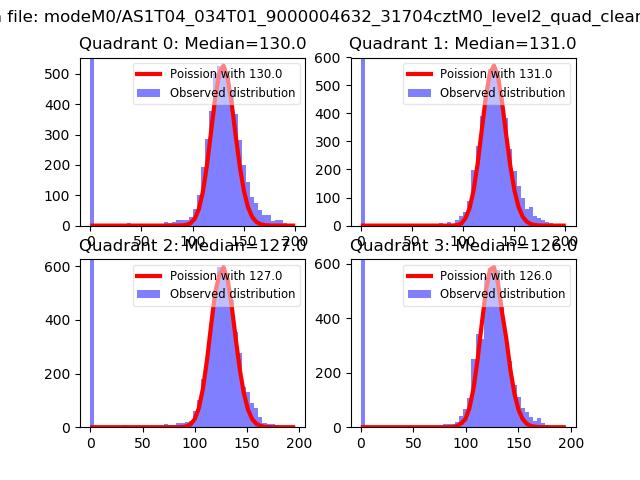
| Comparison with Poisson distribution Blue bars denote a histogram of data divided into 1 sec bins. Red curve is a Poisson curve with rate = median count rate of data. |
 |
 |
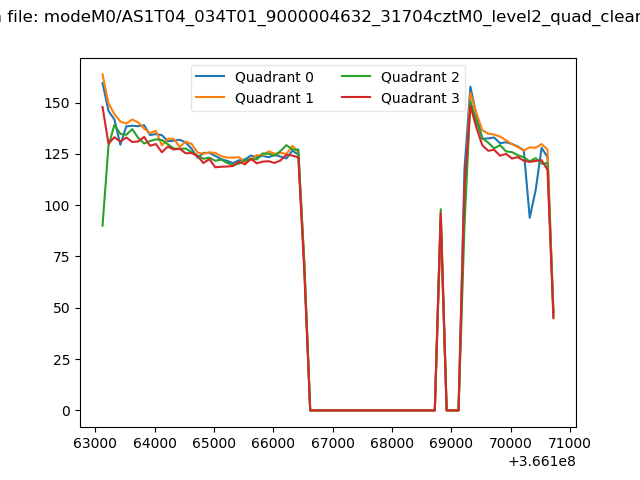
| Quadrant-wise count rates Data is divided into 100 sec bins |
 |
|
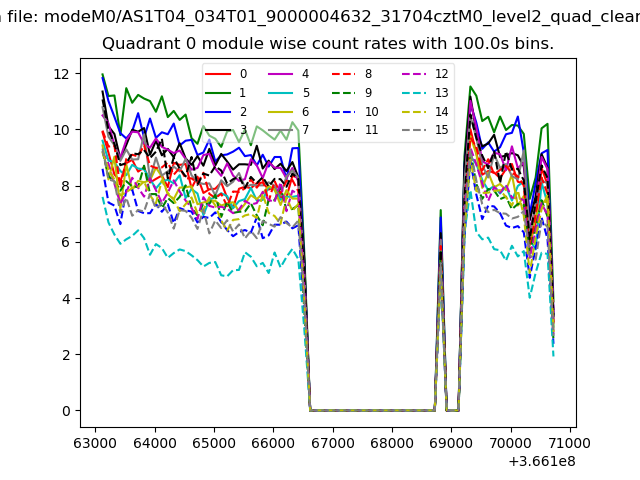
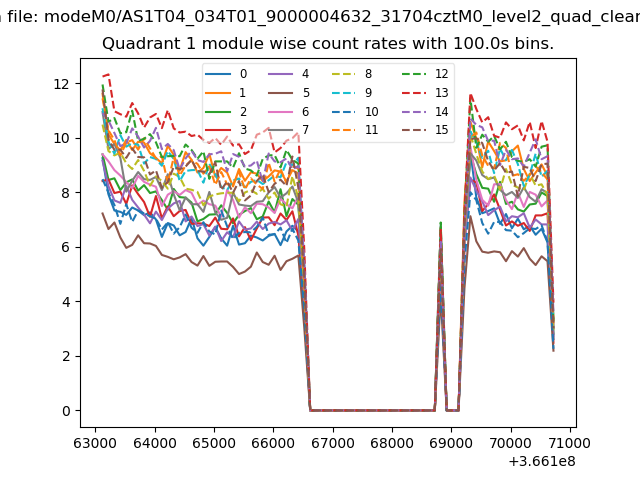
| Module-wise count rates for Quadrant A Data is divided into 100 sec bins |
 |
 |
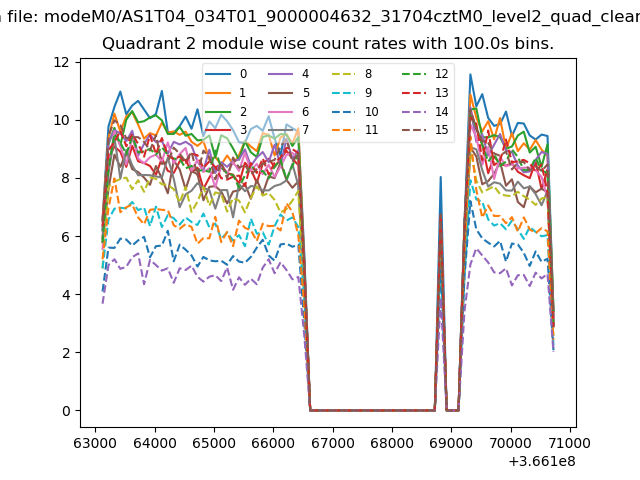
| Module-wise count rates for Quadrant B Data is divided into 100 sec bins |
 |
 |
| Module-wise count rates for Quadrant C Data is divided into 100 sec bins |
 |
 |
| Module-wise count rates for Quadrant D Data is divided into 100 sec bins |
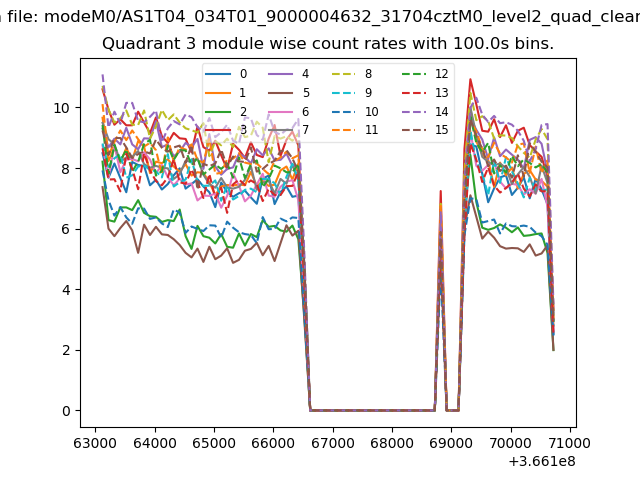 |
 |
| Parameter | Plot |
|---|---|
| CZT HV Monitor | 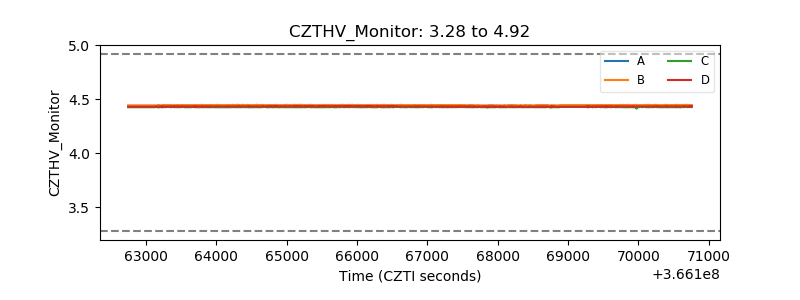 |
| D_VDD | 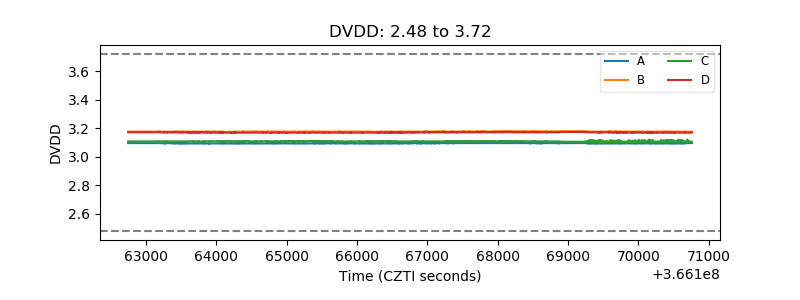 |
| Temperature 1 | 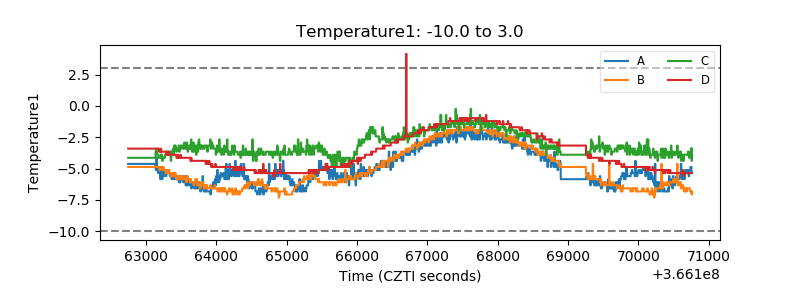 |
| Veto HV Monitor | 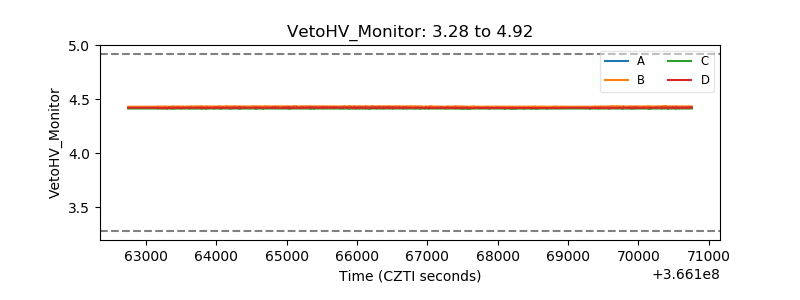 |
| Veto LLD | 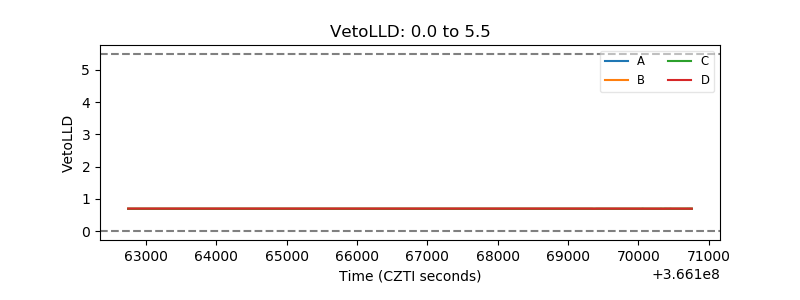 |
| Alpha Counter | 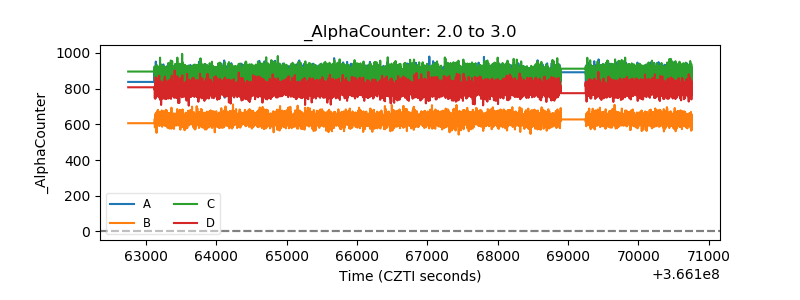 |
| _CPM_Rate | 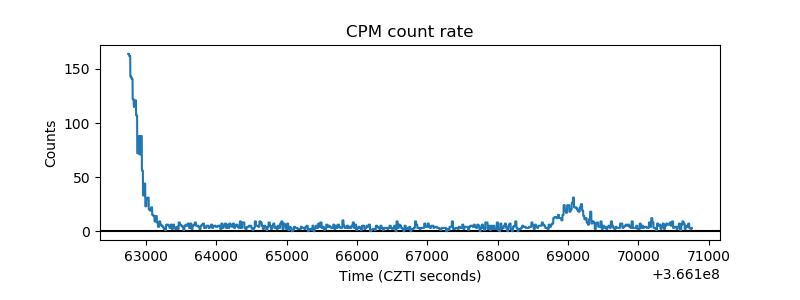 |
| CZT Counter | 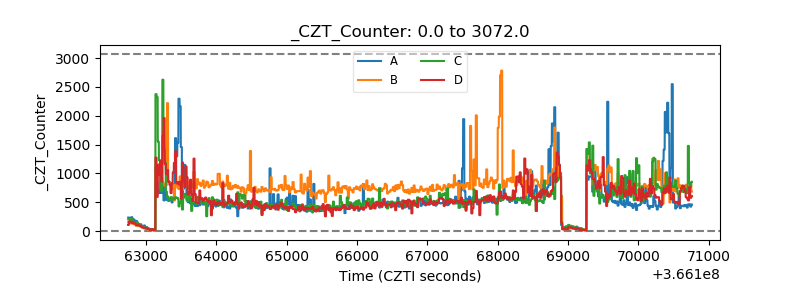 |
| +2.5 Volts monitor |  |
| +5 Volts monitor |  |
| _ROLL_ROT | 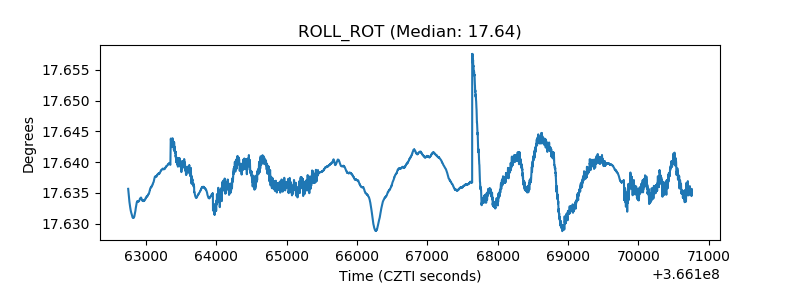 |
| _Roll_DEC | 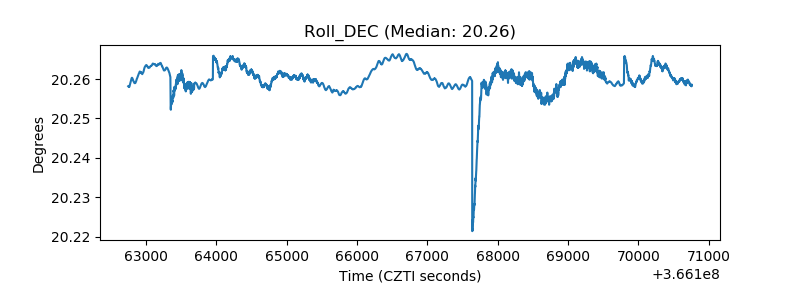 |
| _Roll_RA | 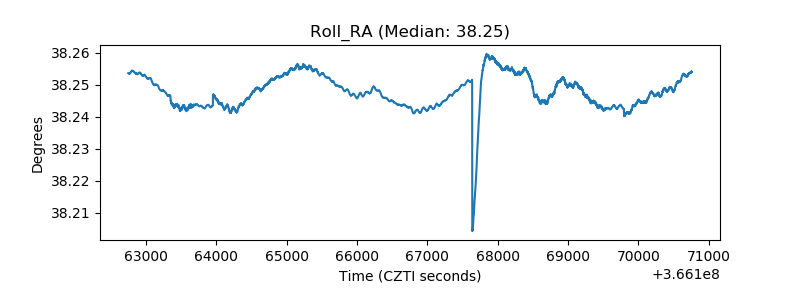 |
| Veto Counter | 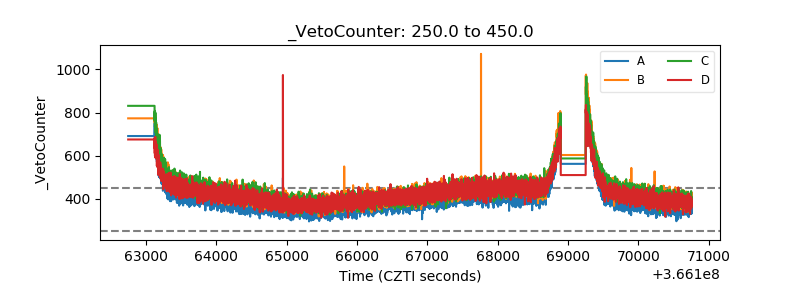 |