| Param | Original file | Final file |
|---|---|---|
| Filename | modeM0/AS1T04_034T01_9000004632_31705cztM0_level2.evt | modeM0/AS1T04_034T01_9000004632_31705cztM0_level2_quad_clean.evt |
| Size (bytes) | 788,106,240 | 114,145,920 |
| Size | 751.6 MB | 108.9 MB |
| Events in quadrant A | 5,136,392 | 725,069 |
| Events in quadrant B | 6,704,242 | 735,783 |
| Events in quadrant C | 5,829,536 | 714,074 |
| Events in quadrant D | 5,634,149 | 701,430 |
| Mode M9 | |||
|---|---|---|---|
| Quadrant | BADHDUFLAG | Total packets | Discarded packets |
| A | 0 | 5 | 0 |
| B | 0 | 5 | 0 |
| C | 0 | 5 | 0 |
| D | 0 | 5 | 0 |
| Mode SS | |||
|---|---|---|---|
| Quadrant | BADHDUFLAG | Total packets | Discarded packets |
| A | 0 | 170 | 0 |
| B | 0 | 170 | 0 |
| C | 0 | 170 | 0 |
| D | 0 | 170 | 0 |
| Mode M0 | |||
|---|---|---|---|
| Quadrant | BADHDUFLAG | Total packets | Discarded packets |
| A | 0 | 20681 | 2 |
| B | 0 | 26232 | 2 |
| C | 0 | 23024 | 2 |
| D | 0 | 22491 | 2 |
| Quadrant | Total seconds | Saturated seconds | Saturation percentage |
|---|---|---|---|
| A | 8354 | 420 | 5.027532% |
| B | 8354 | 446 | 5.338760% |
| C | 8355 | 403 | 4.823459% |
| D | 8355 | 175 | 2.094554% |
Noise dominated data is calculated using 1-second bins in cleaned event files. If a bin has >2000 counts, and if more than 50% of those come from <1% of pixels, then it is considered to be noise-dominated and hence unusable.
| Quadrant | # 1 sec bins | Bins with >0 counts | Bins with >2000 counts | High rate bins dominated by noise | Noise dominated (total time) | Noise dominated (detector-on time) | Marked lightcurve |
|---|---|---|---|---|---|---|---|
| A | 8774 | 8357 | 182 | 182 | 2.07% | 2.18% |  |
| B | 8774 | 8357 | 2 | 2 | 0.02% | 0.02% | 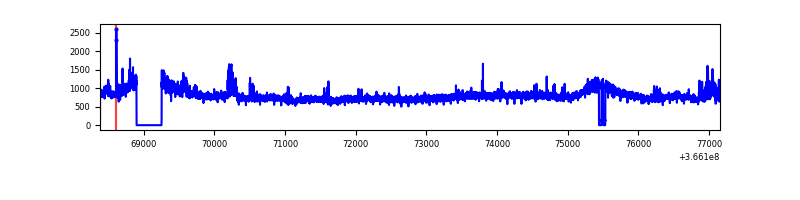 |
| C | 8775 | 8358 | 9 | 9 | 0.10% | 0.11% | 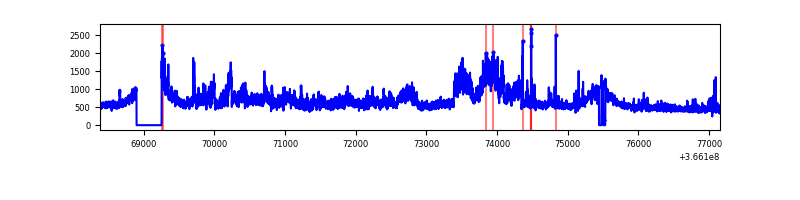 |
| D | 8775 | 8358 | 28 | 28 | 0.32% | 0.34% | 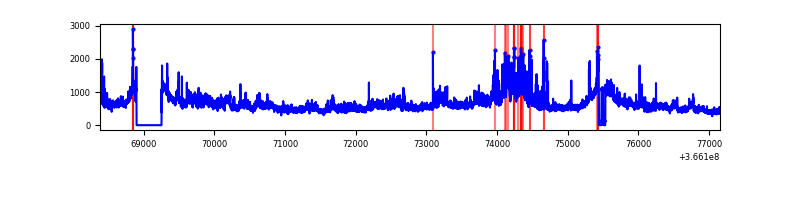 |
Top three noisy pixels from each quadrant. If the there are fewer than three noisy pixels in the level2.evt file, extra rows are filled as -1
| Pixel properties | Quadrant properties | ||||||
|---|---|---|---|---|---|---|---|
| Quadrant | DetID | PixID | Counts | Sigma | Mean | Median | Sigma |
| A | 0 | 13 | 1030370 | 4765.46 | 1058 | 1035 | 216.0 |
| A | 8 | 255 | 20171 | 88.59 | 1058 | 1035 | 216.0 |
| A | 13 | 254 | 14939 | 64.37 | 1058 | 1035 | 216.0 |
| B | 6 | 159 | 2269747 | 10918.76 | 1059 | 1031 | 207.8 |
| B | 4 | 80 | 159118 | 760.83 | 1059 | 1031 | 207.8 |
| B | 0 | 229 | 38522 | 180.43 | 1059 | 1031 | 207.8 |
| C | 3 | 233 | 1361652 | 5558.47 | 1026 | 1033 | 244.8 |
| C | 14 | 238 | 159057 | 645.57 | 1026 | 1033 | 244.8 |
| C | 0 | 10 | 156987 | 637.11 | 1026 | 1033 | 244.8 |
| D | 8 | 195 | 1159309 | 4615.83 | 1036 | 1007 | 250.9 |
| D | 12 | 227 | 416468 | 1655.61 | 1036 | 1007 | 250.9 |
| D | 12 | 233 | 84900 | 334.31 | 1036 | 1007 | 250.9 |
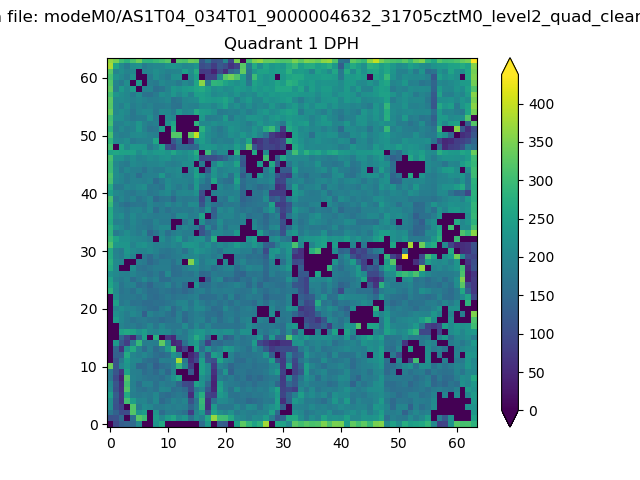
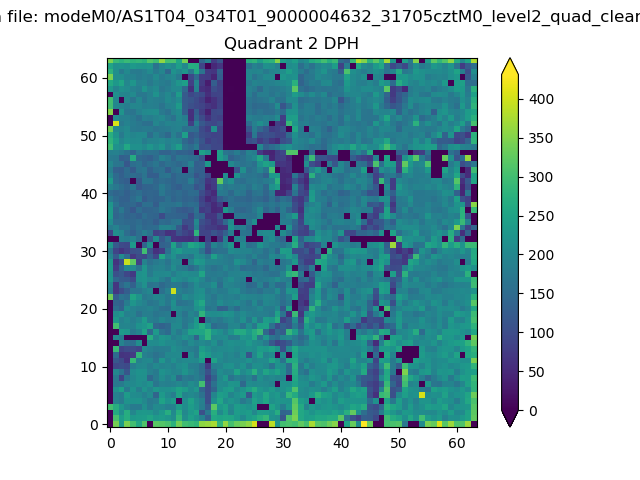
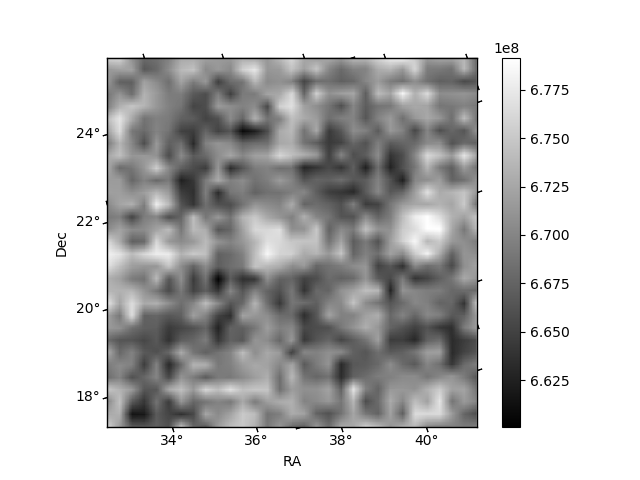
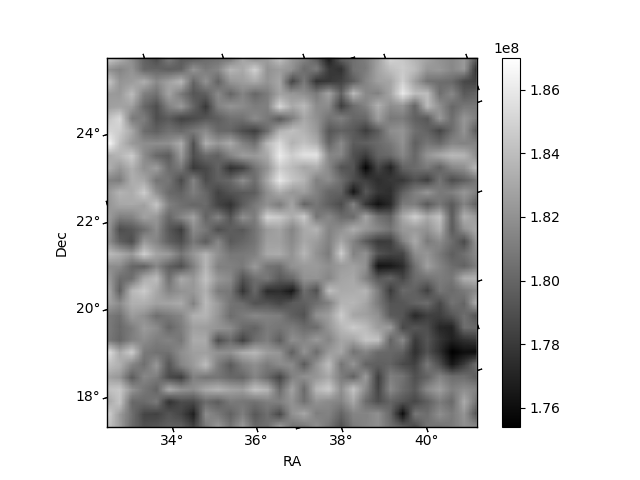
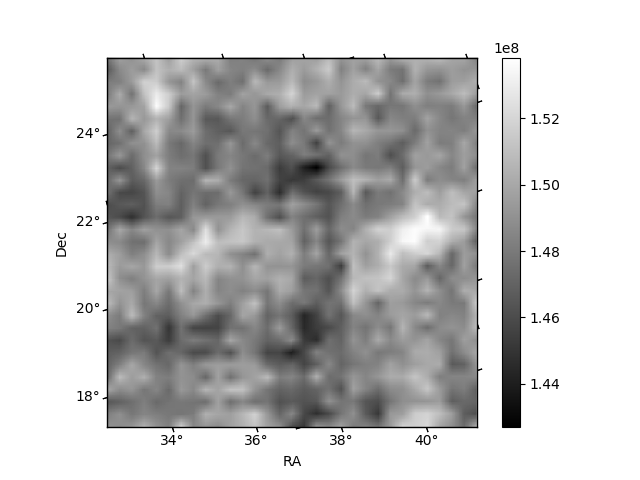
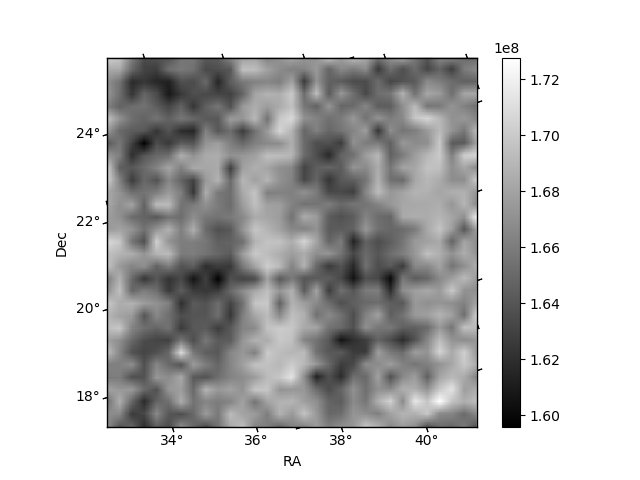
Histogram calculated using DETX and DETY for each event in the final _common_clean file
| Quadrant A | 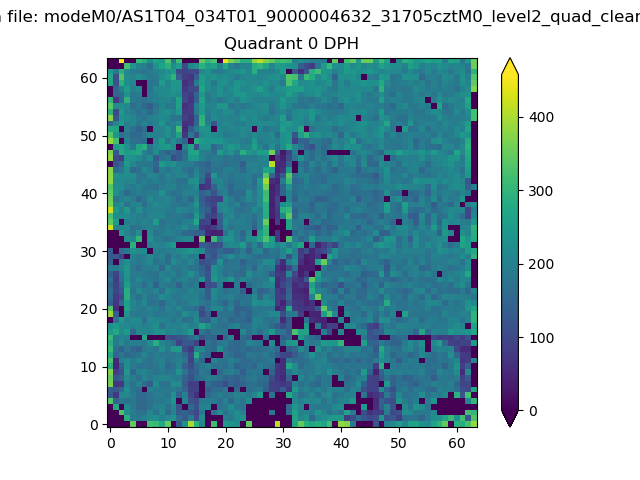 |
 |
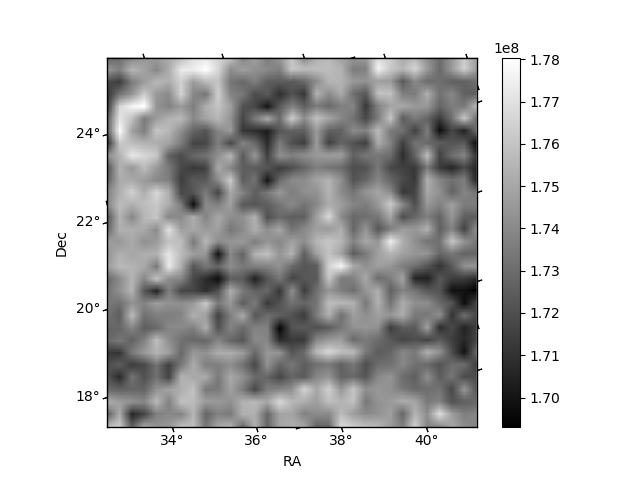
Quadrant B |
|---|---|---|---|
| Quadrant D | 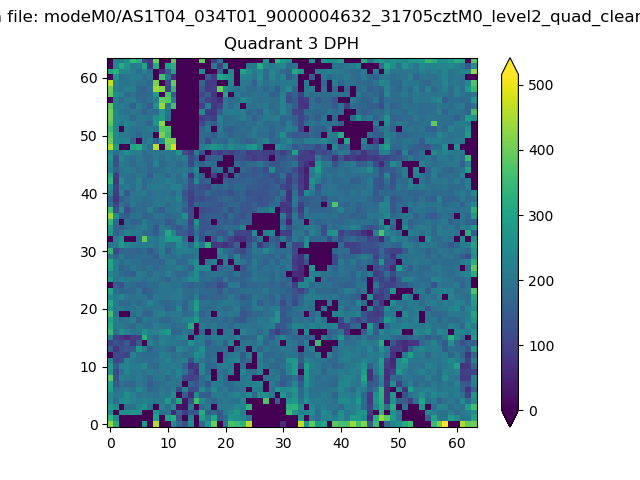 |
 |
Quadrant C |
| Plot type | Count rate plots | Images |
|---|---|---|
| Comparison with Poisson distribution Blue bars denote a histogram of data divided into 1 sec bins. Red curve is a Poisson curve with rate = median count rate of data. |
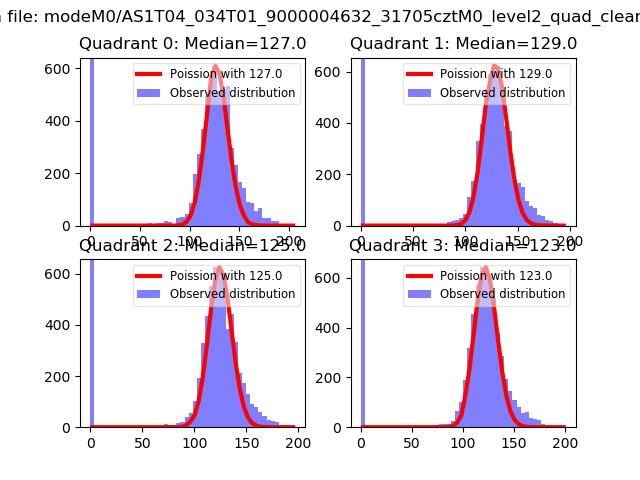 |
 |
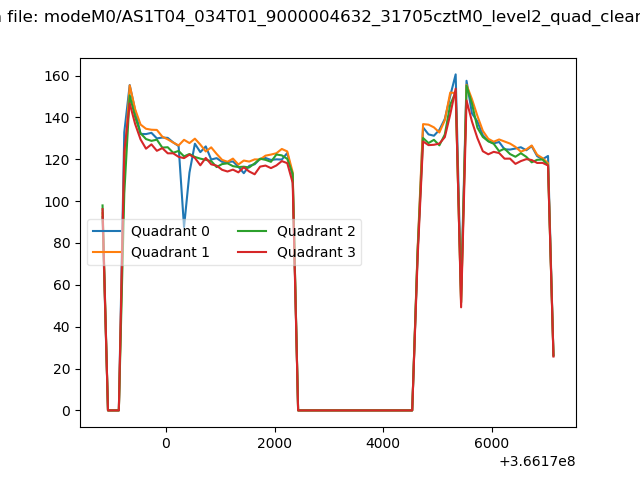
| Quadrant-wise count rates Data is divided into 100 sec bins |
 |
|
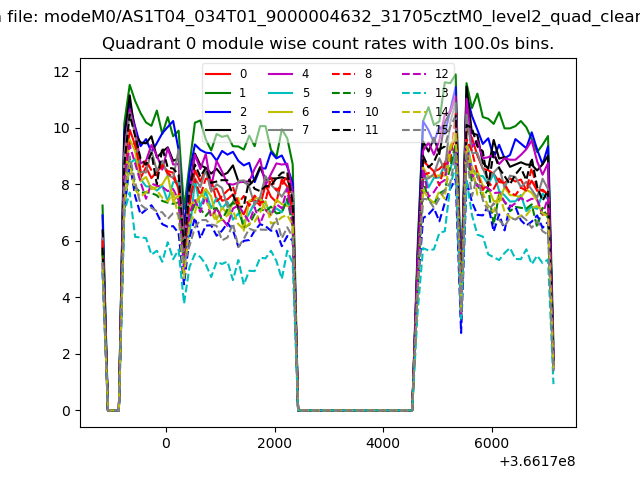
| Module-wise count rates for Quadrant A Data is divided into 100 sec bins |
 |
 |
| Module-wise count rates for Quadrant B Data is divided into 100 sec bins |
 |
 |
| Module-wise count rates for Quadrant C Data is divided into 100 sec bins |
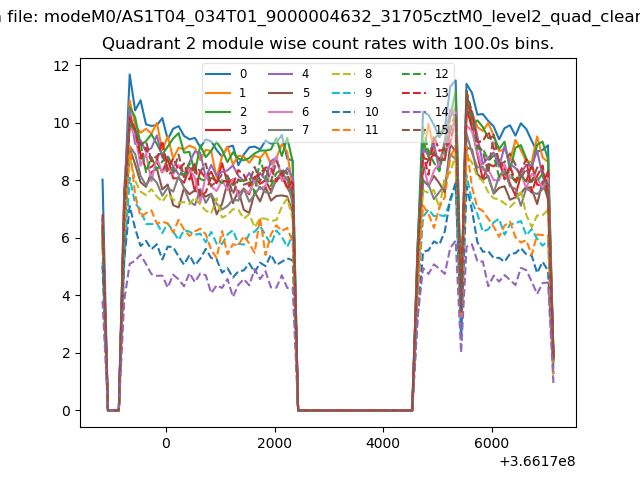 |
 |
| Module-wise count rates for Quadrant D Data is divided into 100 sec bins |
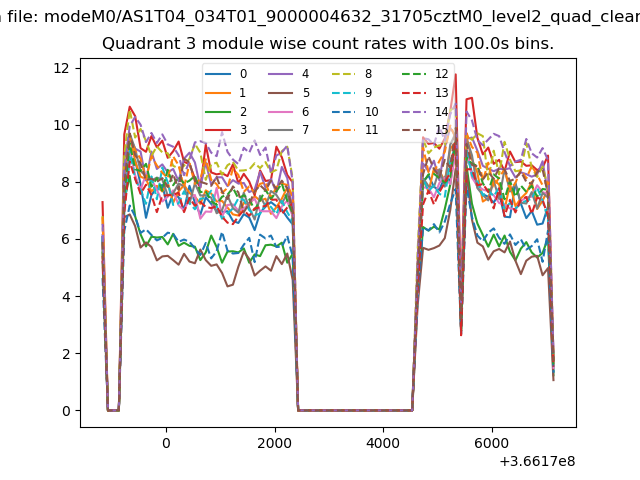 |
 |
| Parameter | Plot |
|---|---|
| CZT HV Monitor | 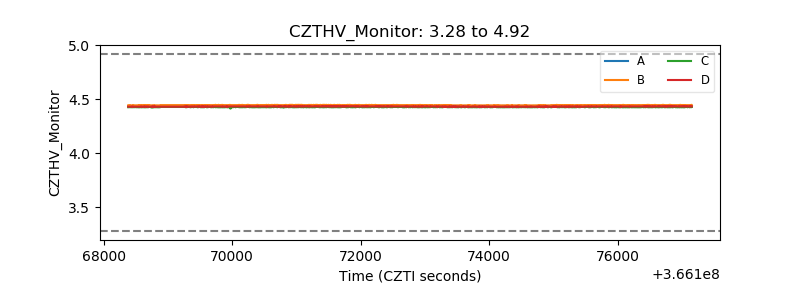 |
| D_VDD | 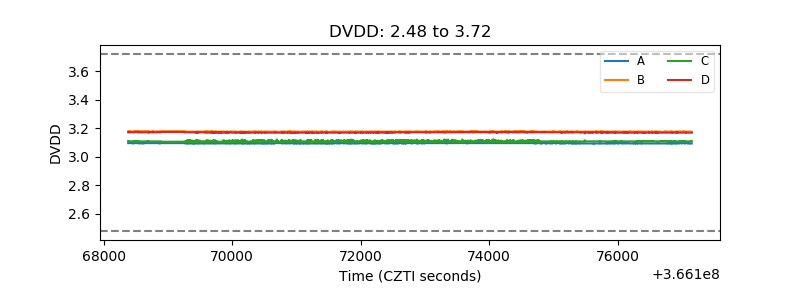 |
| Temperature 1 | 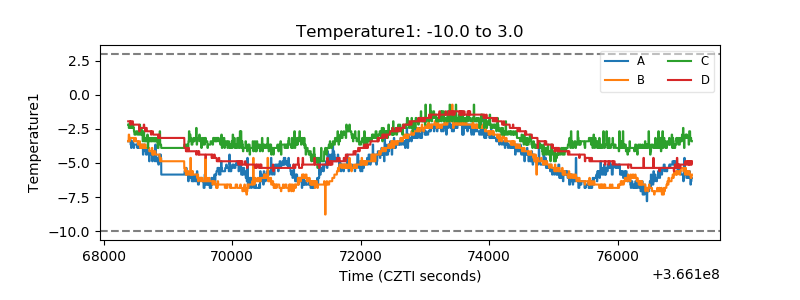 |
| Veto HV Monitor | 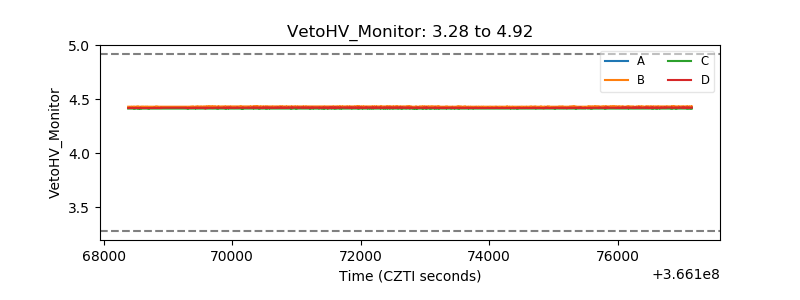 |
| Veto LLD |  |
| Alpha Counter | 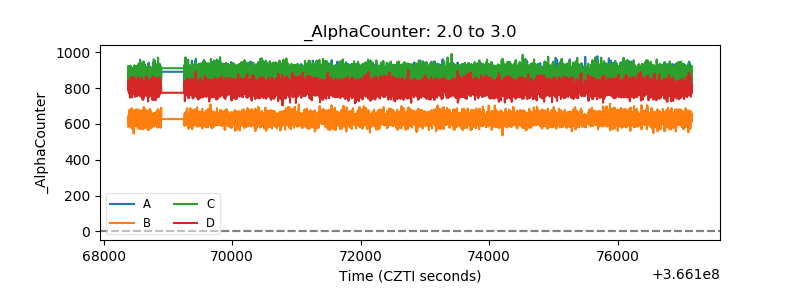 |
| _CPM_Rate | 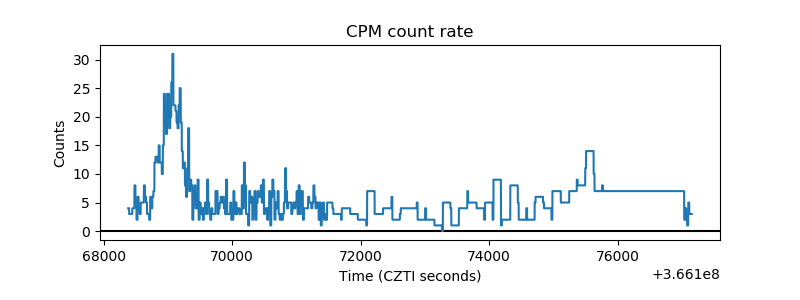 |
| CZT Counter | 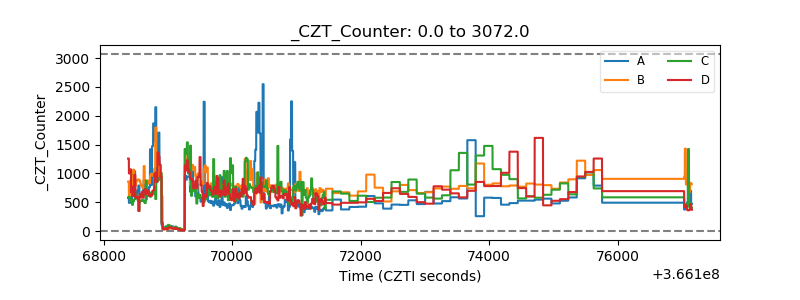 |
| +2.5 Volts monitor |  |
| +5 Volts monitor |  |
| _ROLL_ROT | 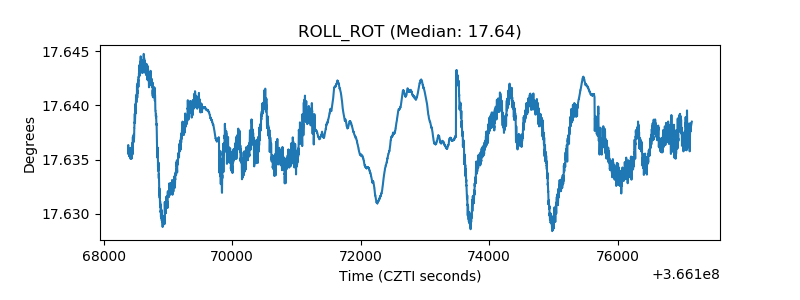 |
| _Roll_DEC | 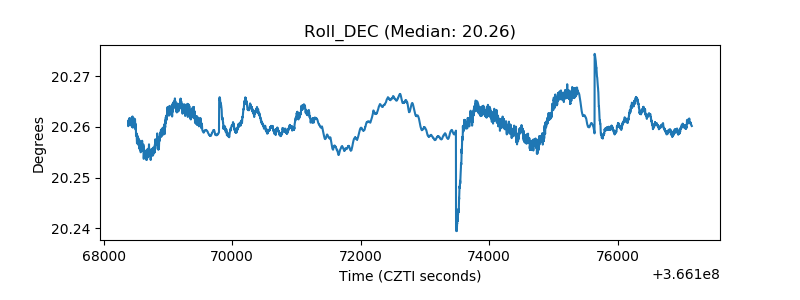 |
| _Roll_RA | 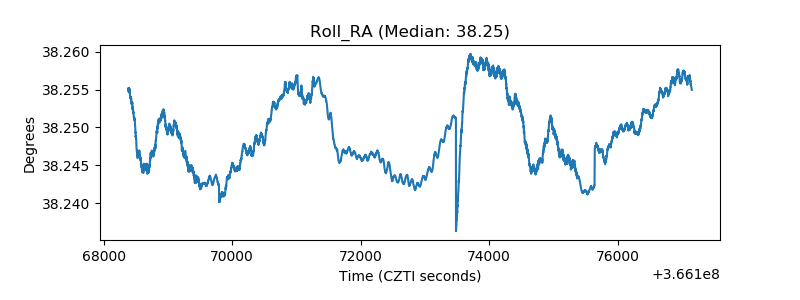 |
| Veto Counter | 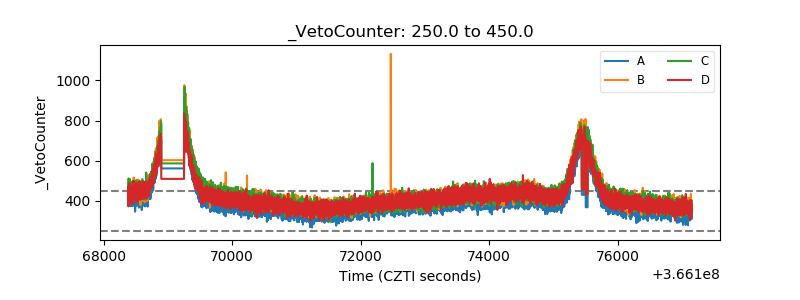 |