| Param | Original file | Final file |
|---|---|---|
| Filename | modeM0/AS1T04_034T01_9000004632_31708cztM0_level2.evt | modeM0/AS1T04_034T01_9000004632_31708cztM0_level2_quad_clean.evt |
| Size (bytes) | 262,172,160 | 38,422,080 |
| Size | 250.0 MB | 36.6 MB |
| Events in quadrant A | 2,088,255 | 231,269 |
| Events in quadrant B | 2,608,008 | 236,090 |
| Events in quadrant C | 1,498,720 | 231,688 |
| Events in quadrant D | 1,517,992 | 228,139 |
| Mode SS | |||
|---|---|---|---|
| Quadrant | BADHDUFLAG | Total packets | Discarded packets |
| A | 0 | 66 | 0 |
| B | 0 | 66 | 0 |
| C | 0 | 66 | 0 |
| D | 0 | 66 | 0 |
| Mode M0 | |||
|---|---|---|---|
| Quadrant | BADHDUFLAG | Total packets | Discarded packets |
| A | 0 | 8456 | 0 |
| B | 0 | 10502 | 0 |
| C | 0 | 6718 | 0 |
| D | 0 | 6704 | 0 |
| Quadrant | Total seconds | Saturated seconds | Saturation percentage |
|---|---|---|---|
| A | 3323 | 31 | 0.932892% |
| B | 3323 | 72 | 2.166717% |
| C | 3323 | 14 | 0.421306% |
| D | 3324 | 2 | 0.060168% |
Noise dominated data is calculated using 1-second bins in cleaned event files. If a bin has >2000 counts, and if more than 50% of those come from <1% of pixels, then it is considered to be noise-dominated and hence unusable.
| Quadrant | # 1 sec bins | Bins with >0 counts | Bins with >2000 counts | High rate bins dominated by noise | Noise dominated (total time) | Noise dominated (detector-on time) | Marked lightcurve |
|---|---|---|---|---|---|---|---|
| A | 3323 | 3323 | 19 | 19 | 0.57% | 0.57% | 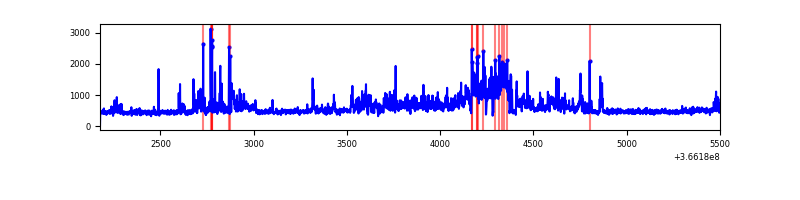 |
| B | 3323 | 3323 | 49 | 49 | 1.47% | 1.47% | 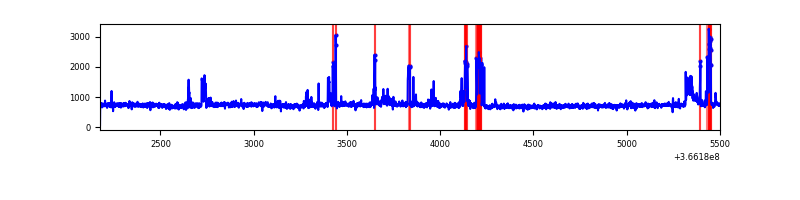 |
| C | 3323 | 3323 | 1 | 1 | 0.03% | 0.03% | 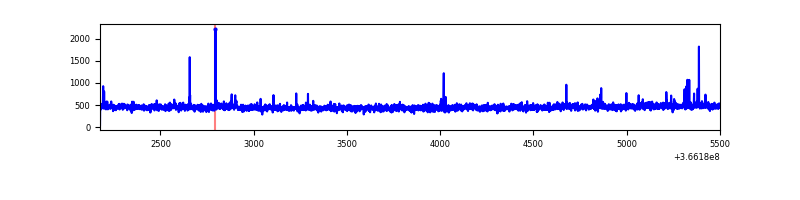 |
| D | 3324 | 3324 | 1 | 1 | 0.03% | 0.03% | 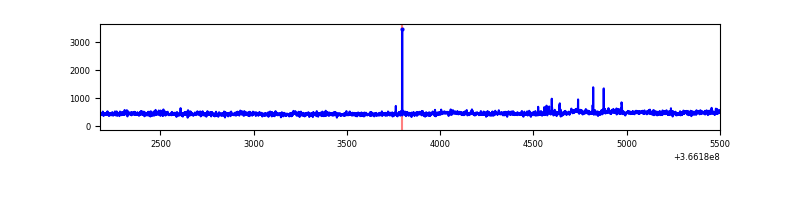 |
Top three noisy pixels from each quadrant. If the there are fewer than three noisy pixels in the level2.evt file, extra rows are filled as -1
| Pixel properties | Quadrant properties | ||||||
|---|---|---|---|---|---|---|---|
| Quadrant | DetID | PixID | Counts | Sigma | Mean | Median | Sigma |
| A | 0 | 13 | 644221 | 8396.86 | 371 | 363 | 76.7 |
| A | 13 | 254 | 6210 | 76.25 | 371 | 363 | 76.7 |
| A | 14 | 238 | 4642 | 55.8 | 371 | 363 | 76.7 |
| B | 6 | 159 | 886674 | 12241.36 | 365 | 356 | 72.4 |
| B | 0 | 229 | 164723 | 2270.15 | 365 | 356 | 72.4 |
| B | 0 | 156 | 35440 | 484.56 | 365 | 356 | 72.4 |
| C | 14 | 238 | 58865 | 686.32 | 356 | 359 | 85.2 |
| C | 0 | 10 | 29495 | 341.79 | 356 | 359 | 85.2 |
| C | 3 | 233 | 8992 | 101.27 | 356 | 359 | 85.2 |
| D | 8 | 195 | 144862 | 1684.22 | 359 | 349 | 85.8 |
| D | 2 | 234 | 14417 | 163.96 | 359 | 349 | 85.8 |
| D | 2 | 250 | 9920 | 111.54 | 359 | 349 | 85.8 |
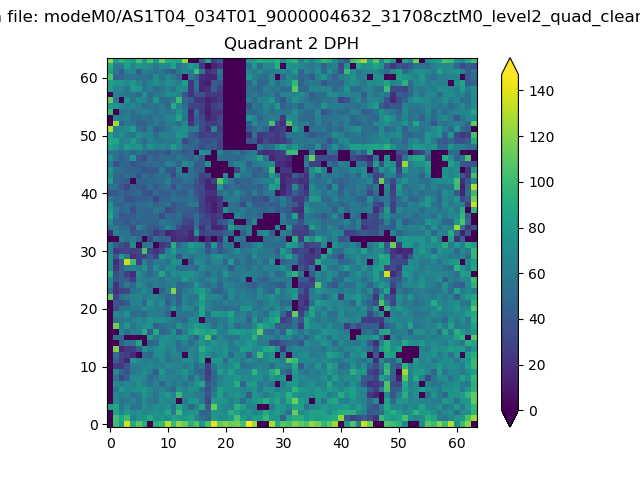
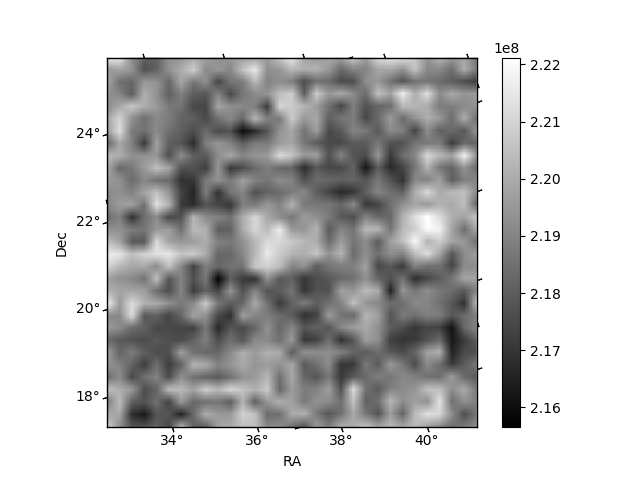
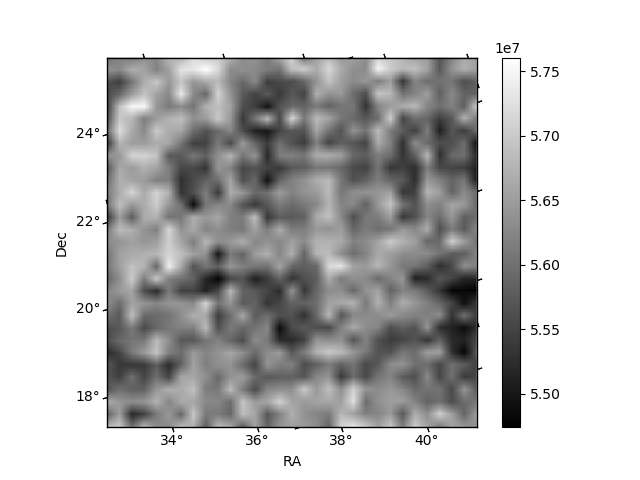
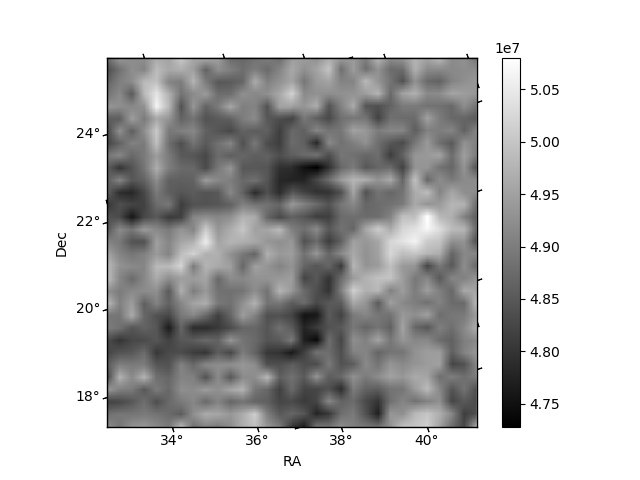
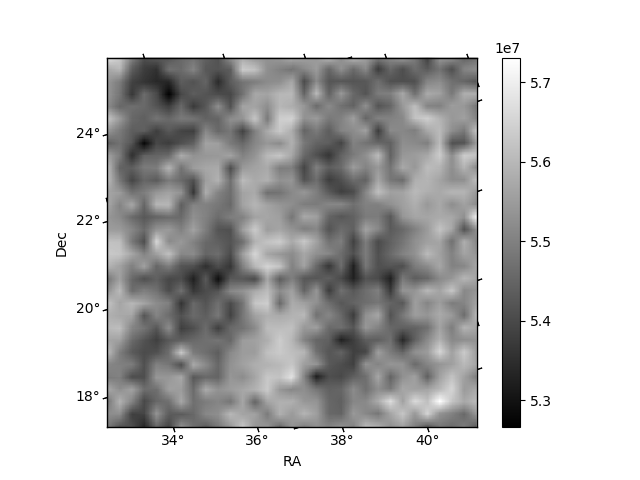
Histogram calculated using DETX and DETY for each event in the final _common_clean file
| Quadrant A | 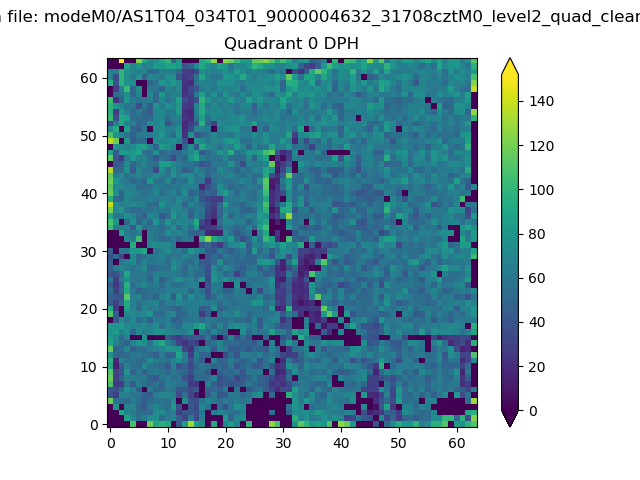 |
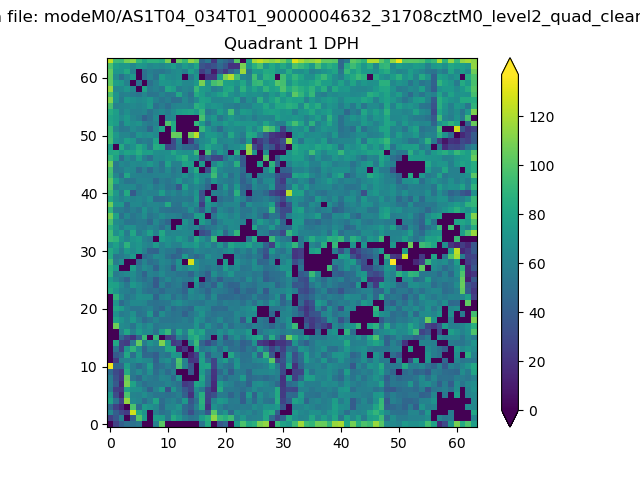 |
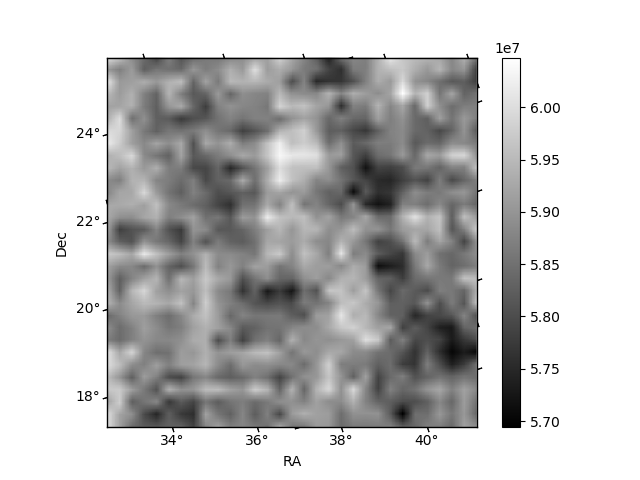
Quadrant B |
|---|---|---|---|
| Quadrant D | 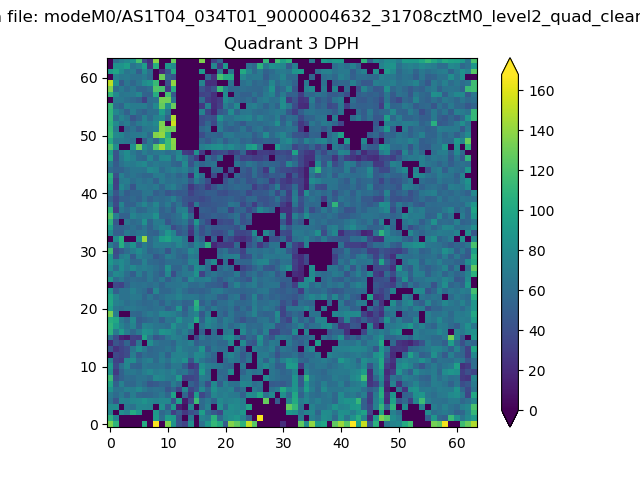 |
 |
Quadrant C |
| Plot type | Count rate plots | Images |
|---|---|---|
| Comparison with Poisson distribution Blue bars denote a histogram of data divided into 1 sec bins. Red curve is a Poisson curve with rate = median count rate of data. |
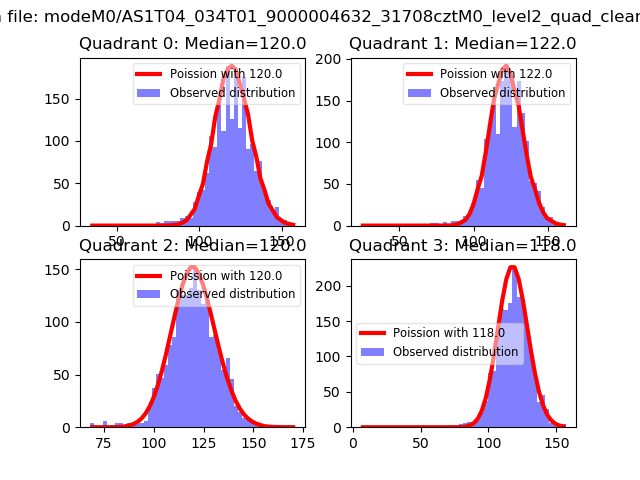 |
 |
| Quadrant-wise count rates Data is divided into 100 sec bins |
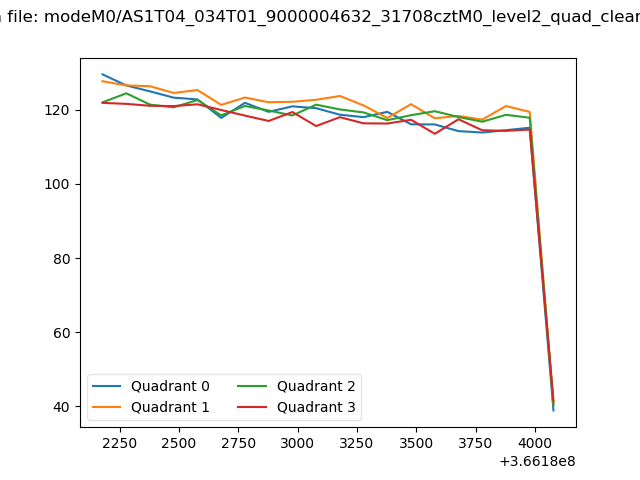 |
|
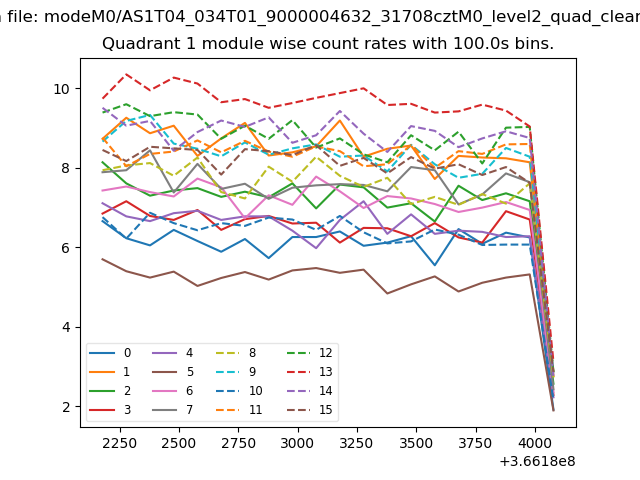
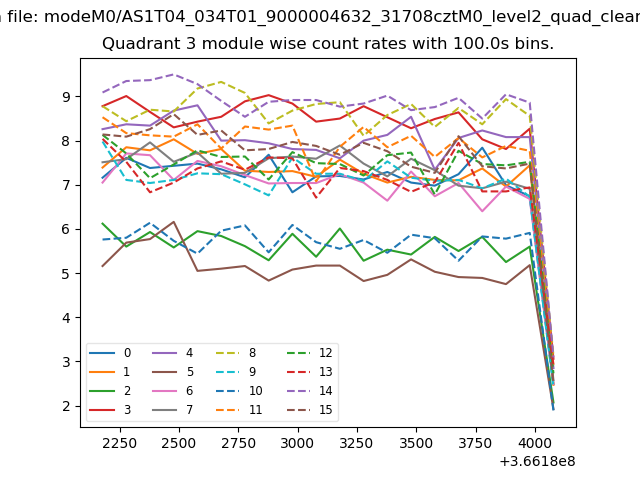
| Module-wise count rates for Quadrant A Data is divided into 100 sec bins |
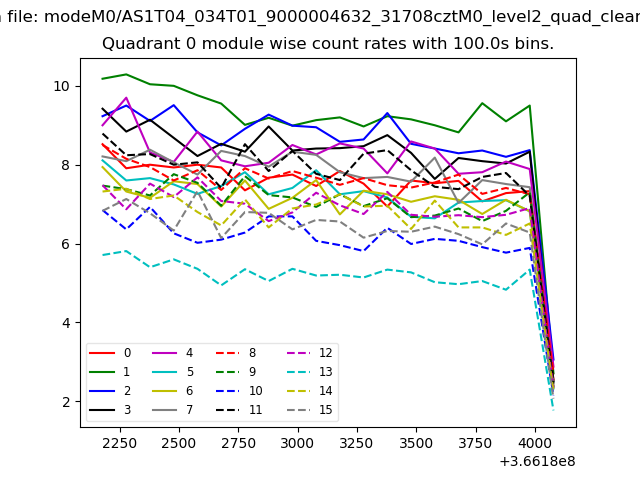 |
 |
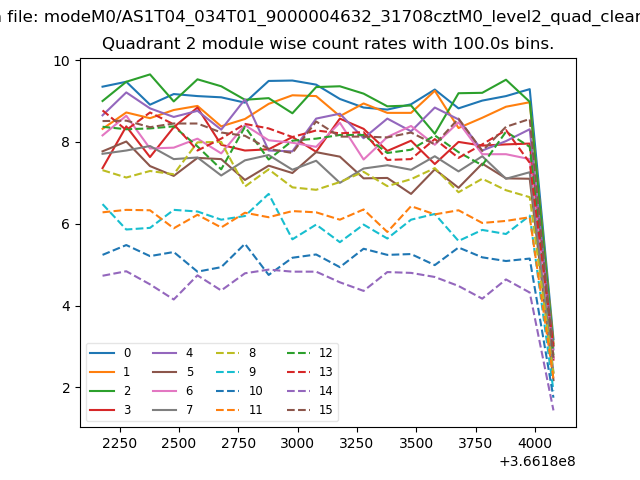
| Module-wise count rates for Quadrant B Data is divided into 100 sec bins |
 |
 |
| Module-wise count rates for Quadrant C Data is divided into 100 sec bins |
 |
 |
| Module-wise count rates for Quadrant D Data is divided into 100 sec bins |
 |
 |
| Parameter | Plot |
|---|---|
| CZT HV Monitor | 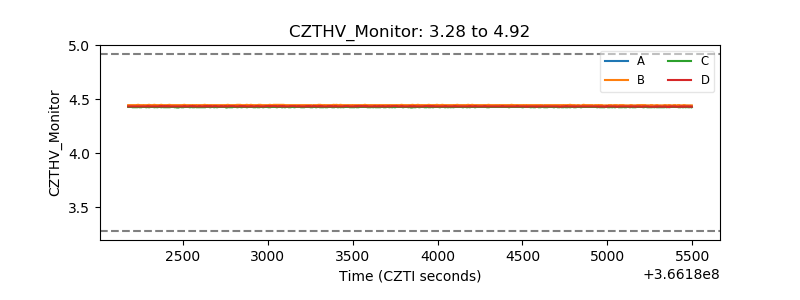 |
| D_VDD | 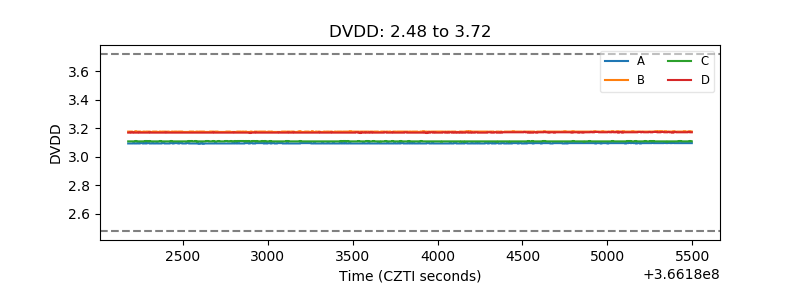 |
| Temperature 1 | 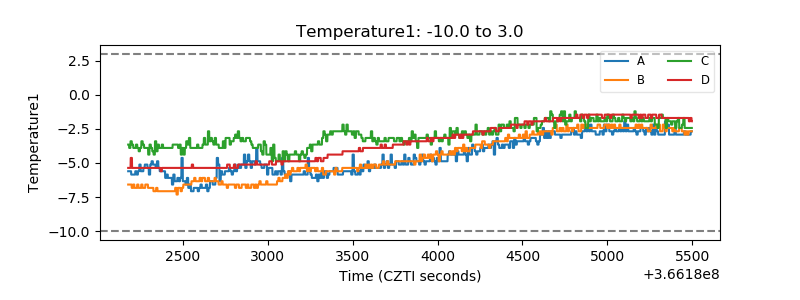 |
| Veto HV Monitor | 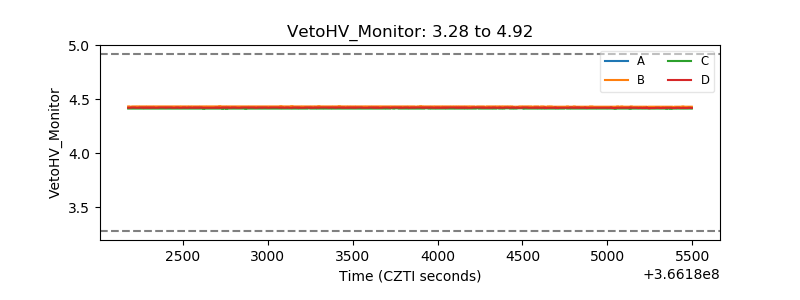 |
| Veto LLD | 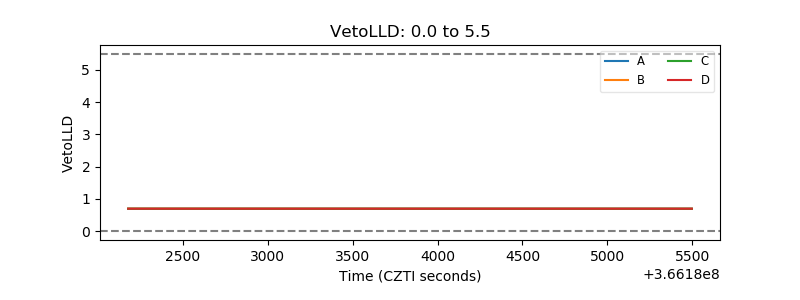 |
| Alpha Counter | 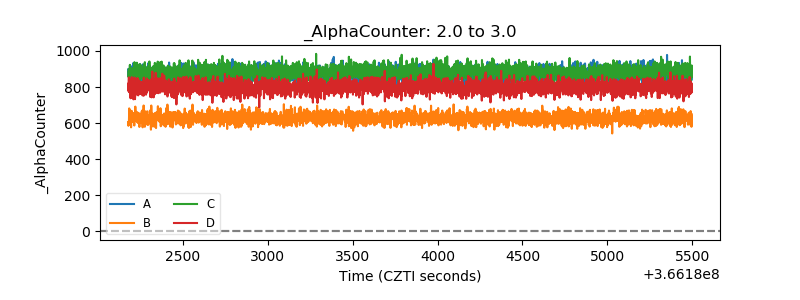 |
| _CPM_Rate | 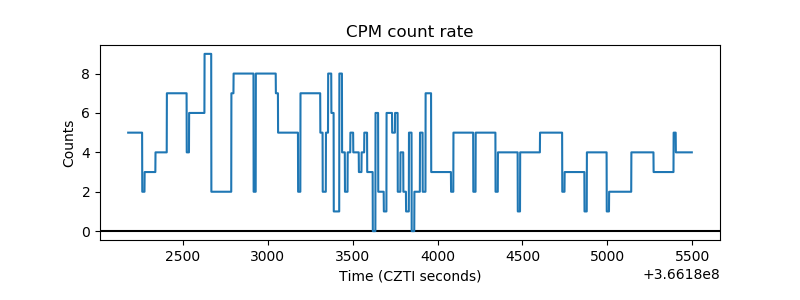 |
| CZT Counter | 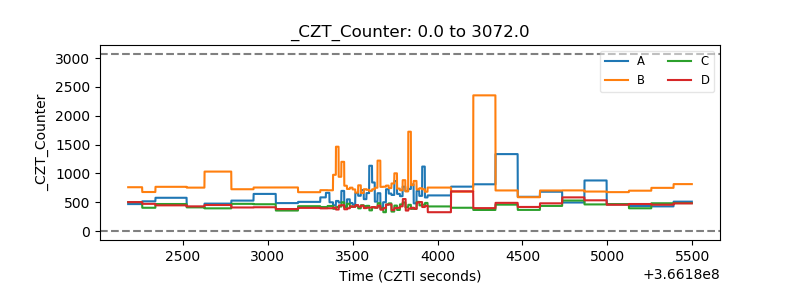 |
| +2.5 Volts monitor | 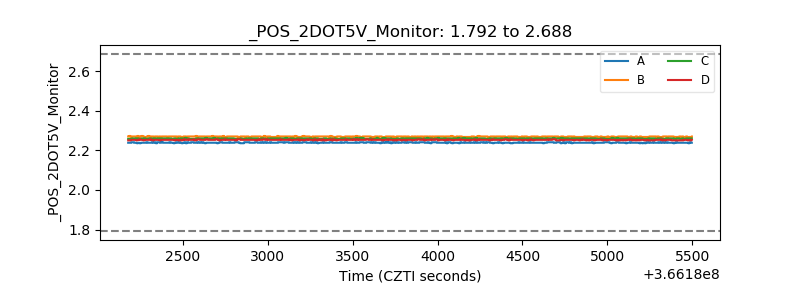 |
| +5 Volts monitor |  |
| _ROLL_ROT | 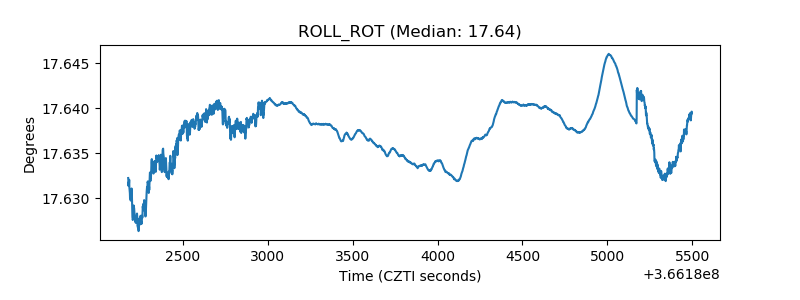 |
| _Roll_DEC | 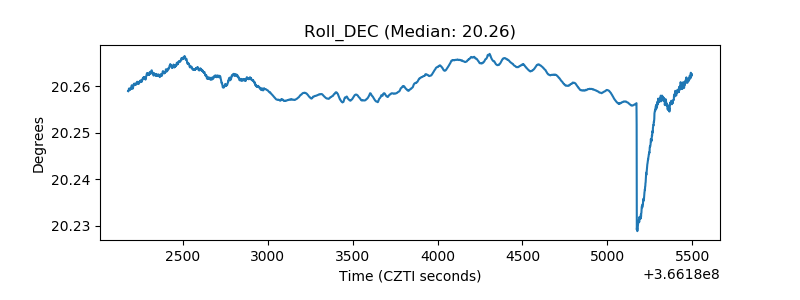 |
| _Roll_RA | 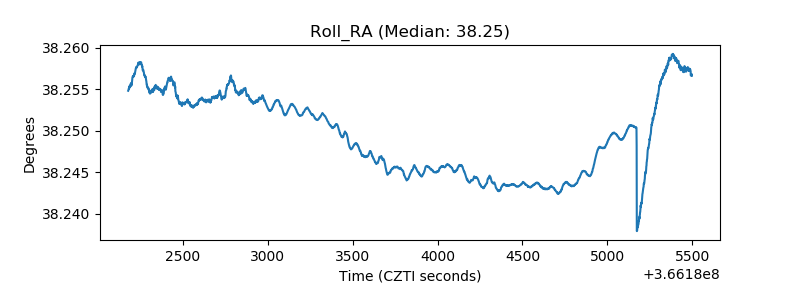 |
| Veto Counter | 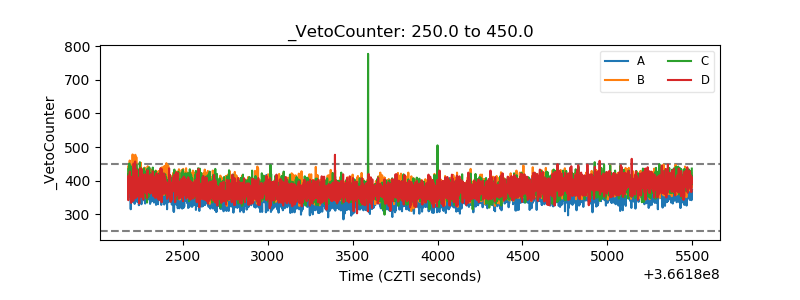 |