| Param | Original file | Final file |
|---|---|---|
| Filename | modeM0/AS1T04_034T01_9000004632_31709cztM0_level2.evt | modeM0/AS1T04_034T01_9000004632_31709cztM0_level2_quad_clean.evt |
| Size (bytes) | 1,403,193,600 | 182,557,440 |
| Size | 1.3 GB | 174.1 MB |
| Events in quadrant A | 9,298,431 | 1,135,674 |
| Events in quadrant B | 13,432,406 | 1,139,931 |
| Events in quadrant C | 9,247,249 | 1,108,158 |
| Events in quadrant D | 9,498,775 | 1,100,654 |
| Mode M9 | |||
|---|---|---|---|
| Quadrant | BADHDUFLAG | Total packets | Discarded packets |
| A | 0 | 19 | 0 |
| B | 0 | 19 | 0 |
| C | 0 | 19 | 0 |
| D | 0 | 19 | 0 |
| Mode SS | |||
|---|---|---|---|
| Quadrant | BADHDUFLAG | Total packets | Discarded packets |
| A | 0 | 310 | 0 |
| B | 0 | 310 | 0 |
| C | 0 | 310 | 0 |
| D | 0 | 310 | 0 |
| Mode M0 | |||
|---|---|---|---|
| Quadrant | BADHDUFLAG | Total packets | Discarded packets |
| A | 0 | 37150 | 5 |
| B | 0 | 51141 | 3 |
| C | 0 | 36642 | 3 |
| D | 0 | 37917 | 3 |
| Quadrant | Total seconds | Saturated seconds | Saturation percentage |
|---|---|---|---|
| A | 15124 | 695 | 4.595345% |
| B | 15125 | 1141 | 7.543802% |
| C | 15125 | 558 | 3.689256% |
| D | 15125 | 237 | 1.566942% |
Noise dominated data is calculated using 1-second bins in cleaned event files. If a bin has >2000 counts, and if more than 50% of those come from <1% of pixels, then it is considered to be noise-dominated and hence unusable.
| Quadrant | # 1 sec bins | Bins with >0 counts | Bins with >2000 counts | High rate bins dominated by noise | Noise dominated (total time) | Noise dominated (detector-on time) | Marked lightcurve |
|---|---|---|---|---|---|---|---|
| A | 17119 | 15127 | 382 | 382 | 2.23% | 2.53% | 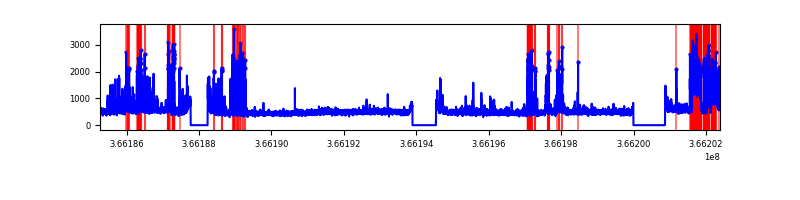 |
| B | 17120 | 15128 | 640 | 640 | 3.74% | 4.23% | 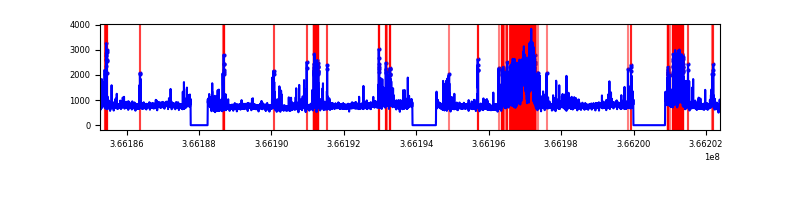 |
| C | 17120 | 15128 | 242 | 242 | 1.41% | 1.60% |  |
| D | 17120 | 15128 | 130 | 130 | 0.76% | 0.86% | 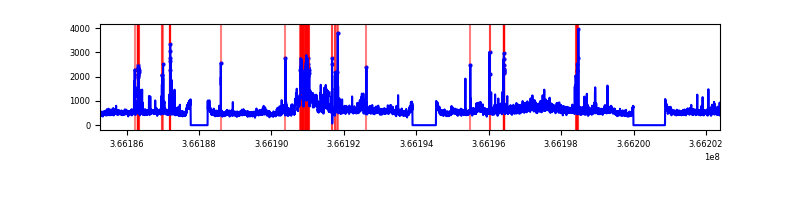 |
Top three noisy pixels from each quadrant. If the there are fewer than three noisy pixels in the level2.evt file, extra rows are filled as -1
| Pixel properties | Quadrant properties | ||||||
|---|---|---|---|---|---|---|---|
| Quadrant | DetID | PixID | Counts | Sigma | Mean | Median | Sigma |
| A | 0 | 13 | 2109190 | 5703.38 | 1840 | 1802 | 369.5 |
| A | 14 | 238 | 56508 | 148.05 | 1840 | 1802 | 369.5 |
| A | 13 | 254 | 28749 | 72.93 | 1840 | 1802 | 369.5 |
| B | 6 | 159 | 3886819 | 11216.45 | 1799 | 1748 | 346.4 |
| B | 4 | 80 | 1810936 | 5223.24 | 1799 | 1748 | 346.4 |
| B | 0 | 229 | 453599 | 1304.52 | 1799 | 1748 | 346.4 |
| C | 3 | 233 | 1100548 | 2640.39 | 1772 | 1781 | 416.1 |
| C | 0 | 10 | 493298 | 1181.14 | 1772 | 1781 | 416.1 |
| C | 14 | 225 | 315491 | 753.86 | 1772 | 1781 | 416.1 |
| D | 8 | 195 | 2003459 | 4665.77 | 1804 | 1756 | 429.0 |
| D | 12 | 233 | 333920 | 774.24 | 1804 | 1756 | 429.0 |
| D | 13 | 249 | 102545 | 234.93 | 1804 | 1756 | 429.0 |
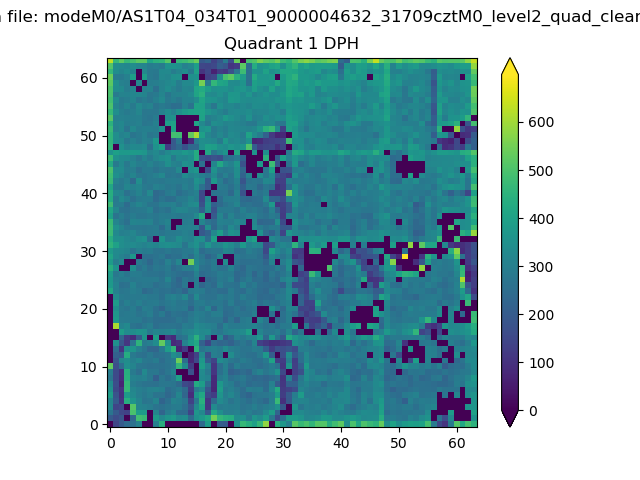
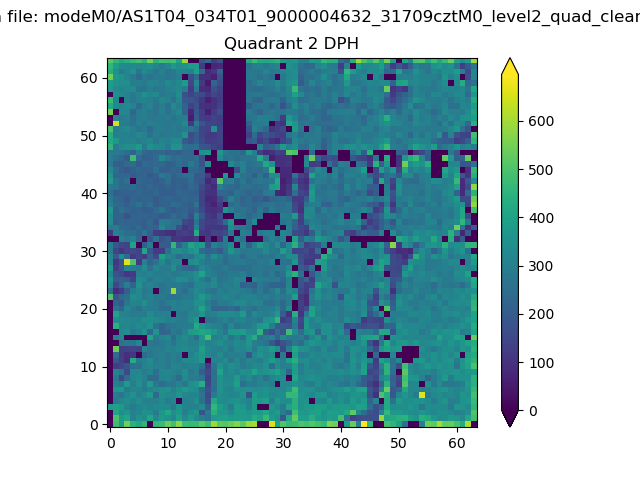
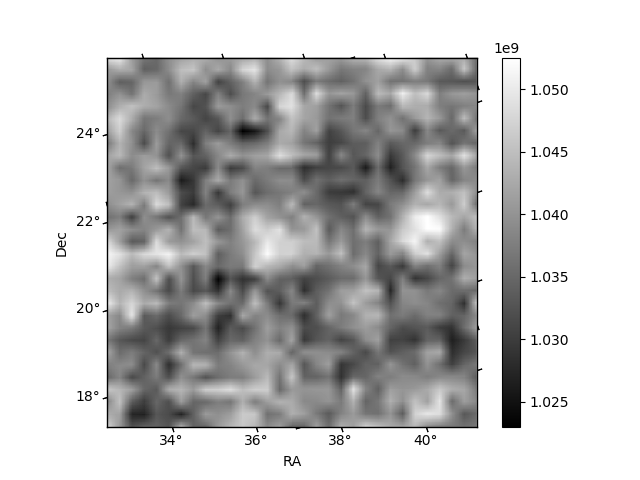
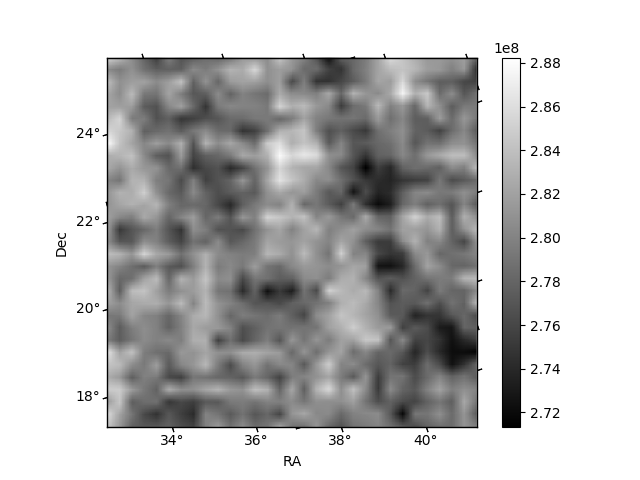
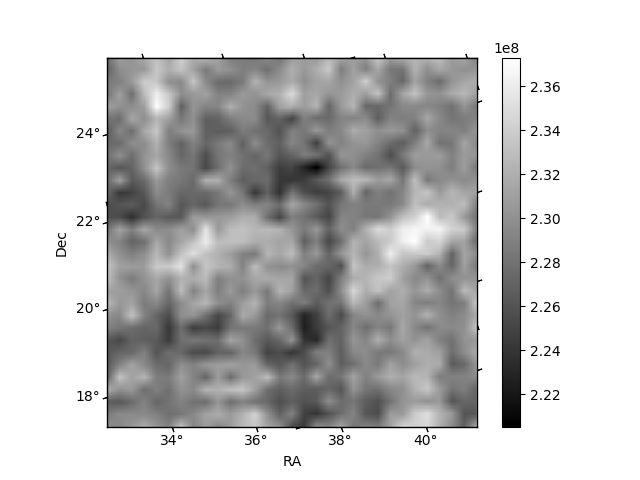
Histogram calculated using DETX and DETY for each event in the final _common_clean file
| Quadrant A | 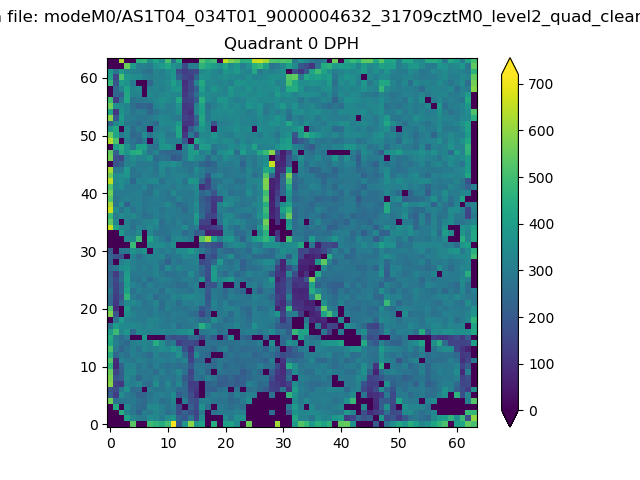 |
 |
Quadrant B |
|---|---|---|---|
| Quadrant D | 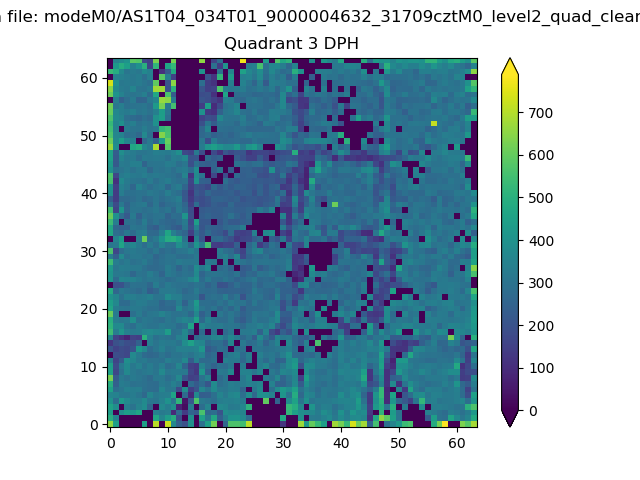 |
 |
Quadrant C |
| Plot type | Count rate plots | Images |
|---|---|---|
| Comparison with Poisson distribution Blue bars denote a histogram of data divided into 1 sec bins. Red curve is a Poisson curve with rate = median count rate of data. |
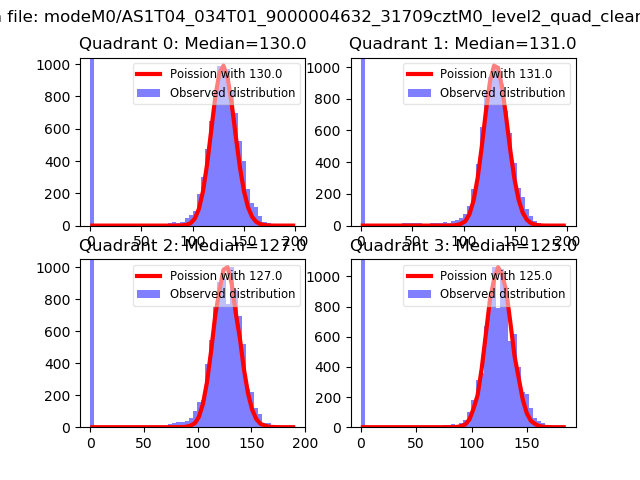 |
 |
| Quadrant-wise count rates Data is divided into 100 sec bins |
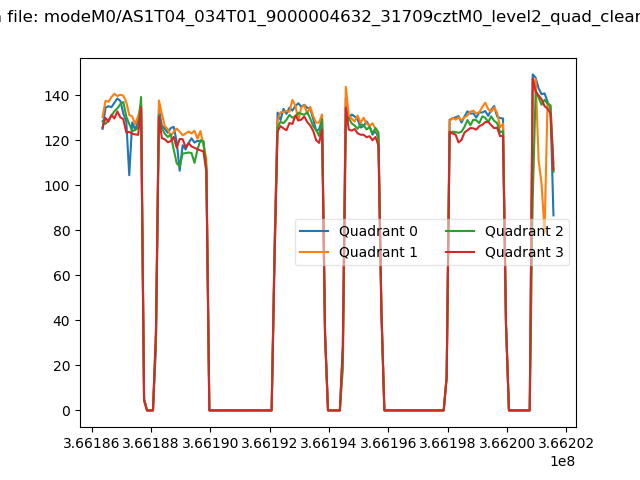 |
|
| Module-wise count rates for Quadrant A Data is divided into 100 sec bins |
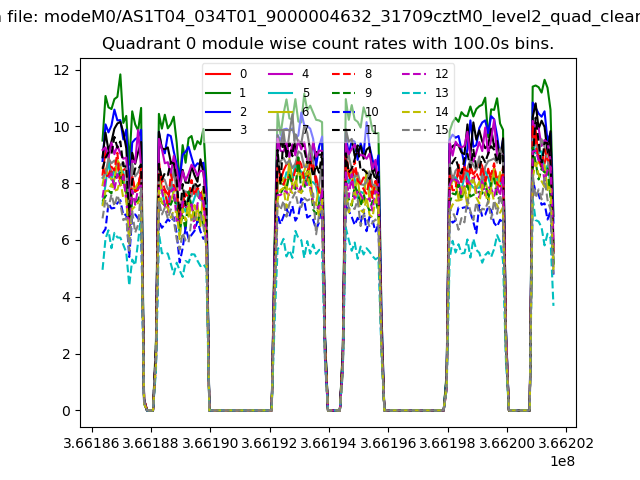 |
 |
| Module-wise count rates for Quadrant B Data is divided into 100 sec bins |
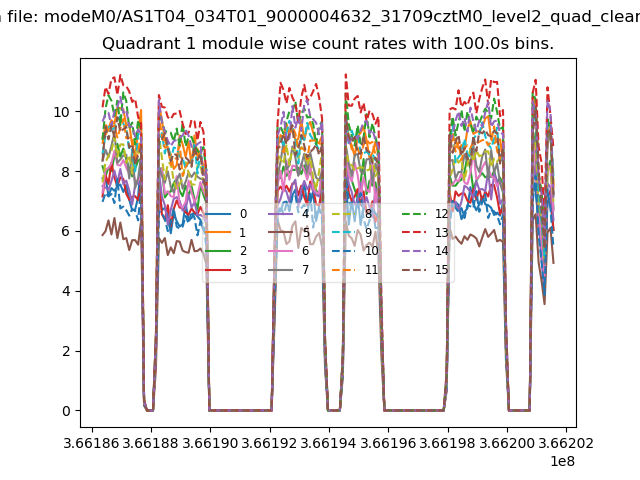 |
 |
| Module-wise count rates for Quadrant C Data is divided into 100 sec bins |
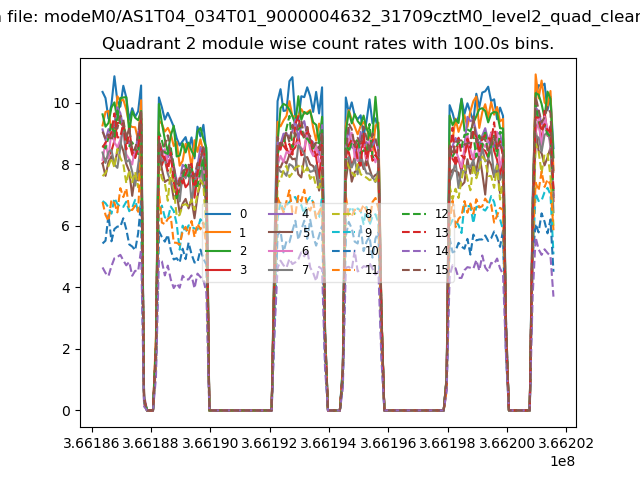 |
 |
| Module-wise count rates for Quadrant D Data is divided into 100 sec bins |
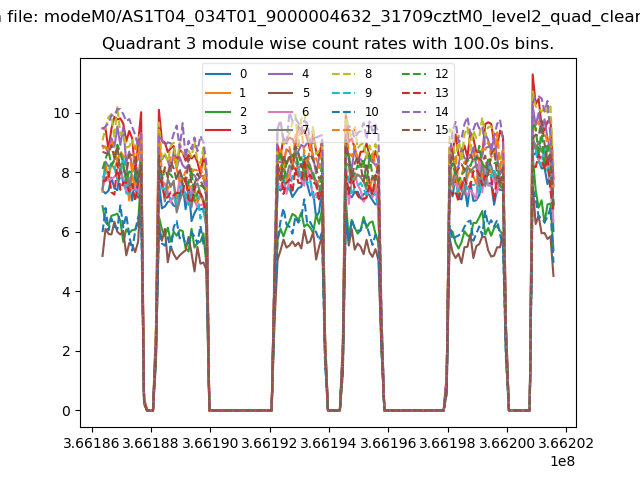 |
 |
| Parameter | Plot |
|---|---|
| CZT HV Monitor | 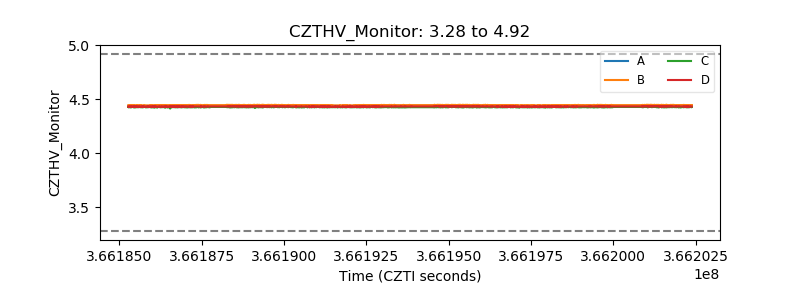 |
| D_VDD | 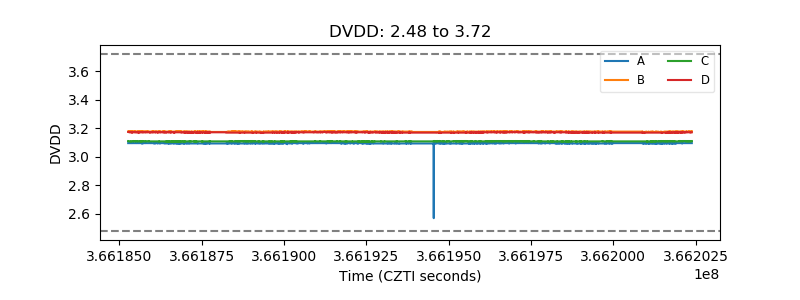 |
| Temperature 1 | 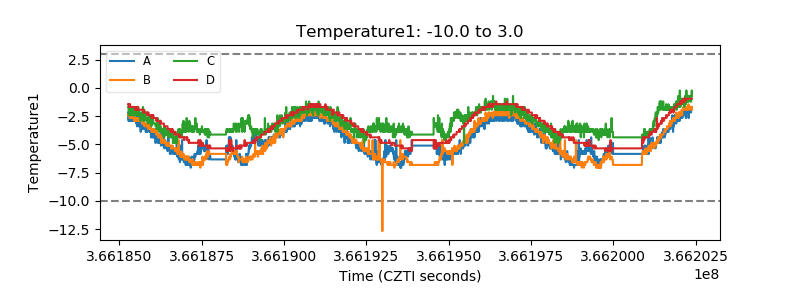 |
| Veto HV Monitor | 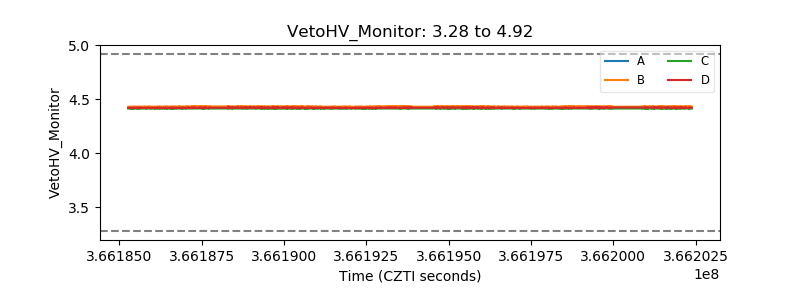 |
| Veto LLD | 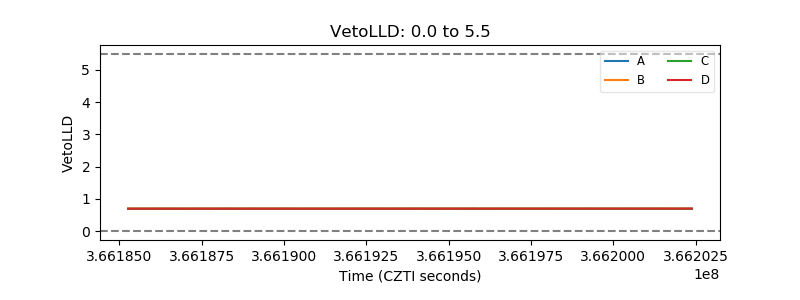 |
| Alpha Counter | 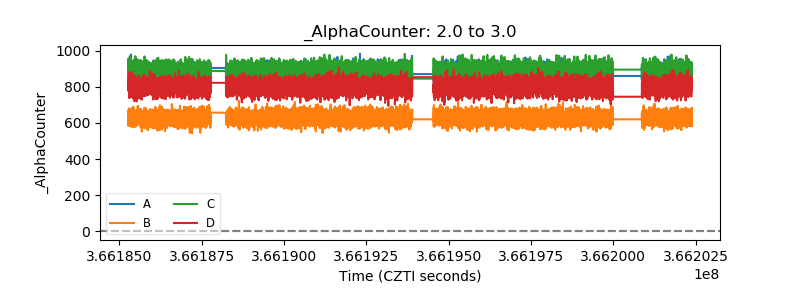 |
| _CPM_Rate | 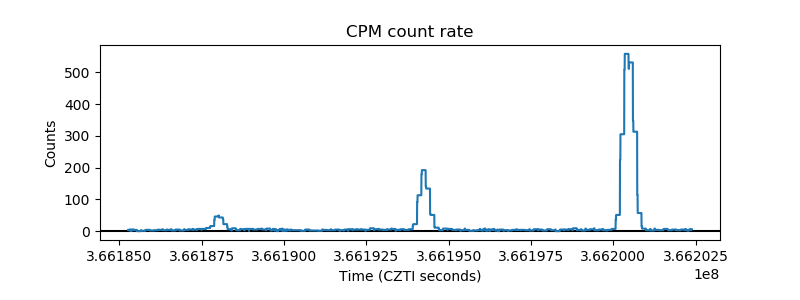 |
| CZT Counter | 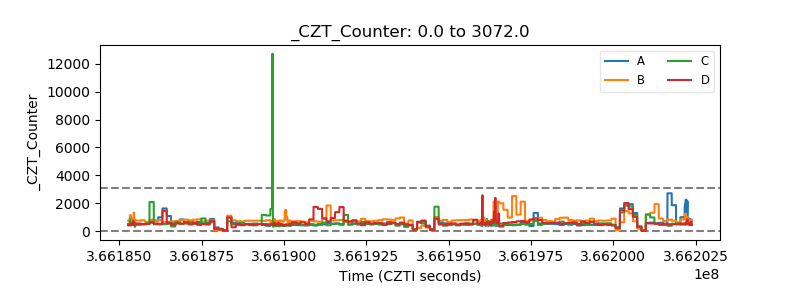 |
| +2.5 Volts monitor |  |
| +5 Volts monitor |  |
| _ROLL_ROT | 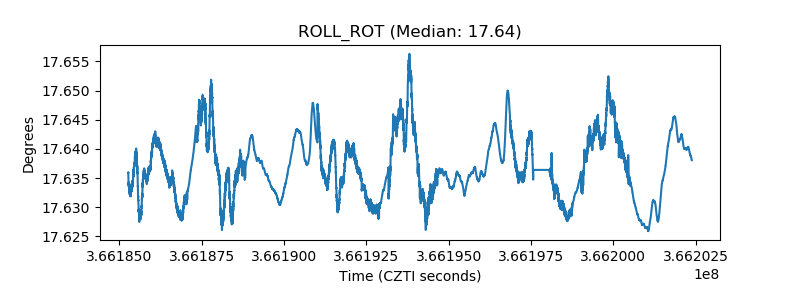 |
| _Roll_DEC | 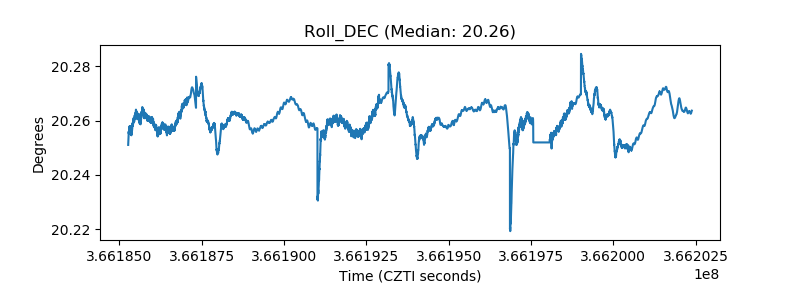 |
| _Roll_RA | 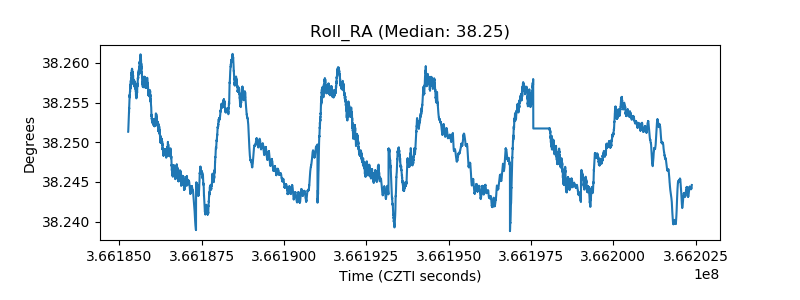 |
| Veto Counter | 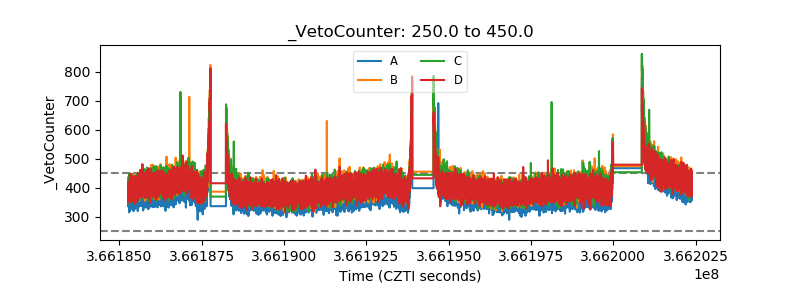 |