| Param | Original file | Final file |
|---|---|---|
| Filename | modeM0/AS1T04_034T01_9000004632_31710cztM0_level2.evt | modeM0/AS1T04_034T01_9000004632_31710cztM0_level2_quad_clean.evt |
| Size (bytes) | 2,611,520,640 | 339,122,880 |
| Size | 2.4 GB | 323.4 MB |
| Events in quadrant A | 17,838,702 | 2,102,281 |
| Events in quadrant B | 25,171,010 | 2,108,782 |
| Events in quadrant C | 16,298,777 | 2,050,990 |
| Events in quadrant D | 17,841,807 | 2,025,409 |
| Mode M9 | |||
|---|---|---|---|
| Quadrant | BADHDUFLAG | Total packets | Discarded packets |
| A | 0 | 32 | 0 |
| B | 0 | 32 | 0 |
| C | 0 | 32 | 0 |
| D | 0 | 32 | 0 |
| Mode SS | |||
|---|---|---|---|
| Quadrant | BADHDUFLAG | Total packets | Discarded packets |
| A | 0 | 588 | 0 |
| B | 0 | 588 | 0 |
| C | 0 | 588 | 0 |
| D | 0 | 588 | 0 |
| Mode M0 | |||
|---|---|---|---|
| Quadrant | BADHDUFLAG | Total packets | Discarded packets |
| A | 0 | 71199 | 5 |
| B | 0 | 96225 | 5 |
| C | 0 | 66409 | 5 |
| D | 0 | 71880 | 5 |
| Quadrant | Total seconds | Saturated seconds | Saturation percentage |
|---|---|---|---|
| A | 28844 | 1190 | 4.125641% |
| B | 28845 | 1742 | 6.039175% |
| C | 28845 | 831 | 2.880915% |
| D | 28845 | 540 | 1.872075% |
Noise dominated data is calculated using 1-second bins in cleaned event files. If a bin has >2000 counts, and if more than 50% of those come from <1% of pixels, then it is considered to be noise-dominated and hence unusable.
| Quadrant | # 1 sec bins | Bins with >0 counts | Bins with >2000 counts | High rate bins dominated by noise | Noise dominated (total time) | Noise dominated (detector-on time) | Marked lightcurve |
|---|---|---|---|---|---|---|---|
| A | 32119 | 28850 | 679 | 679 | 2.11% | 2.35% | 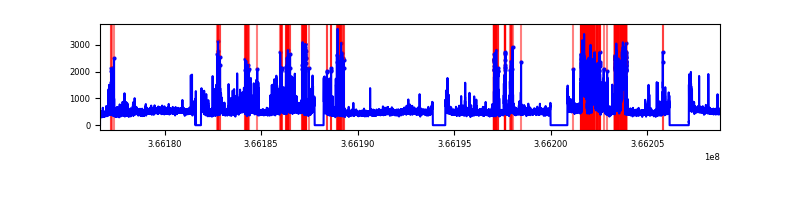 |
| B | 32120 | 28851 | 845 | 845 | 2.63% | 2.93% | 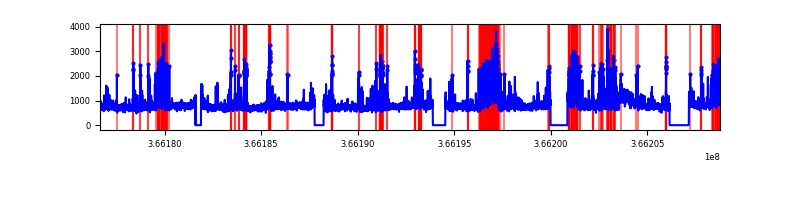 |
| C | 32120 | 28851 | 289 | 289 | 0.90% | 1.00% | 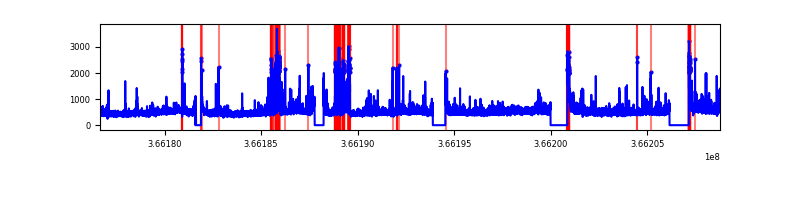 |
| D | 32120 | 28851 | 310 | 310 | 0.97% | 1.07% | 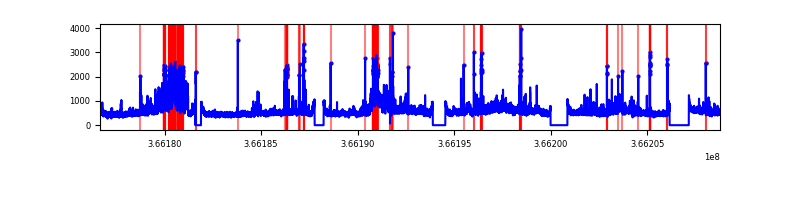 |
Top three noisy pixels from each quadrant. If the there are fewer than three noisy pixels in the level2.evt file, extra rows are filled as -1
| Pixel properties | Quadrant properties | ||||||
|---|---|---|---|---|---|---|---|
| Quadrant | DetID | PixID | Counts | Sigma | Mean | Median | Sigma |
| A | 0 | 13 | 4148746 | 5919.12 | 3505 | 3429 | 700.3 |
| A | 8 | 255 | 91640 | 125.96 | 3505 | 3429 | 700.3 |
| A | 14 | 238 | 63058 | 85.14 | 3505 | 3429 | 700.3 |
| B | 6 | 159 | 7514473 | 11462.79 | 3439 | 3347 | 655.3 |
| B | 4 | 80 | 2660073 | 4054.45 | 3439 | 3347 | 655.3 |
| B | 0 | 229 | 1031871 | 1569.64 | 3439 | 3347 | 655.3 |
| C | 3 | 233 | 1140130 | 1436.79 | 3373 | 3391 | 791.2 |
| C | 0 | 10 | 840681 | 1058.3 | 3373 | 3391 | 791.2 |
| C | 14 | 238 | 543564 | 682.76 | 3373 | 3391 | 791.2 |
| D | 8 | 195 | 2794048 | 3440.37 | 3427 | 3341 | 811.2 |
| D | 12 | 227 | 1304706 | 1604.32 | 3427 | 3341 | 811.2 |
| D | 12 | 233 | 391026 | 477.94 | 3427 | 3341 | 811.2 |
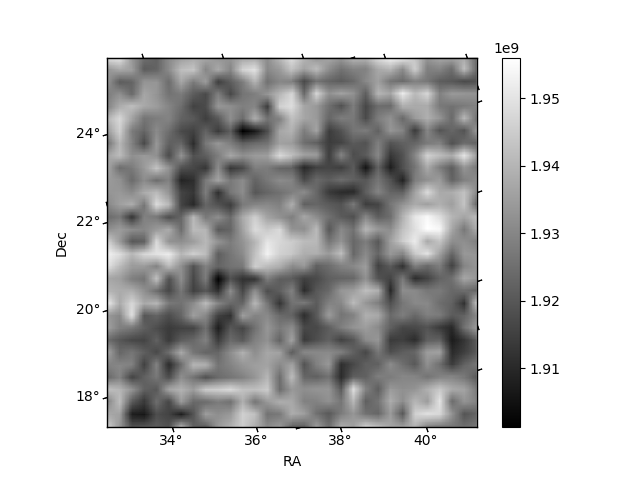
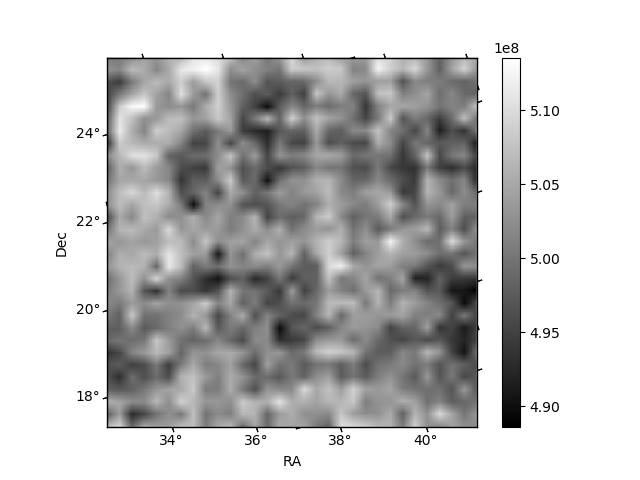
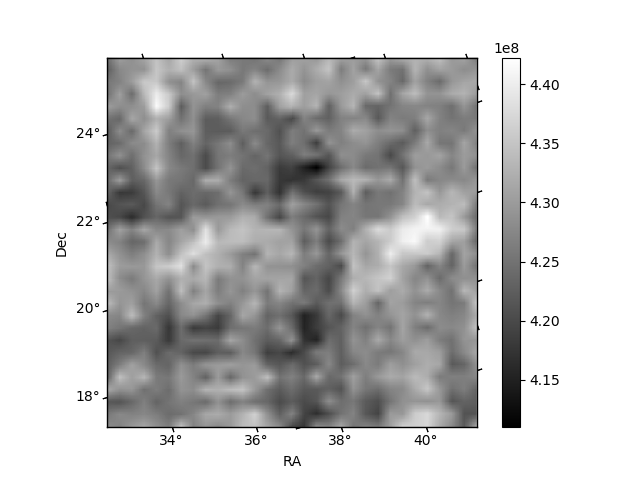
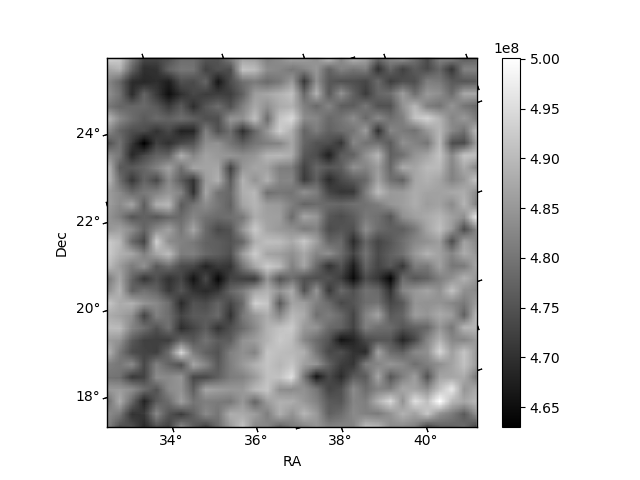
Histogram calculated using DETX and DETY for each event in the final _common_clean file
| Quadrant A | 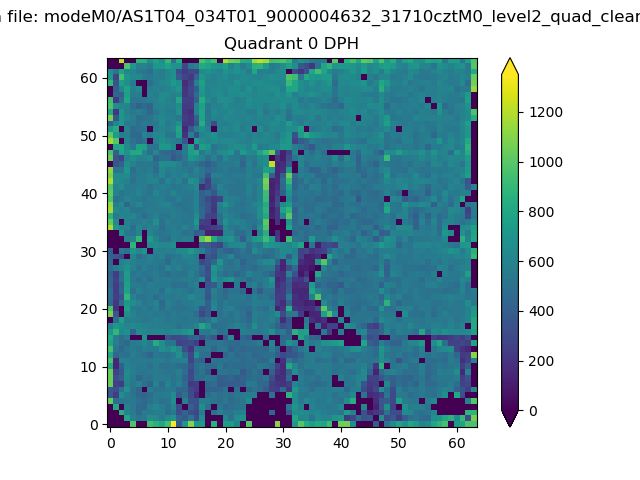 |
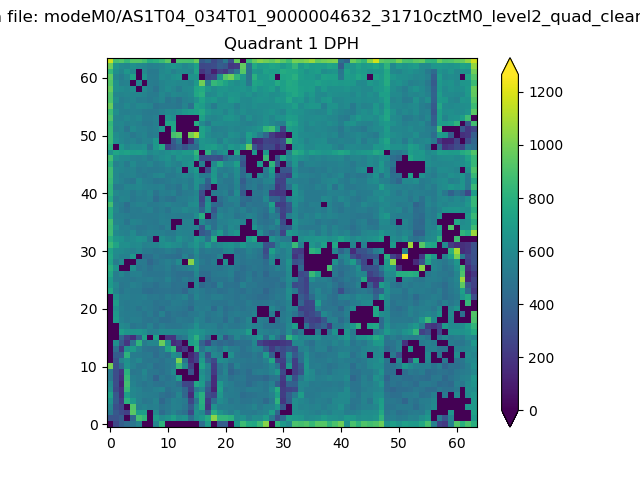 |
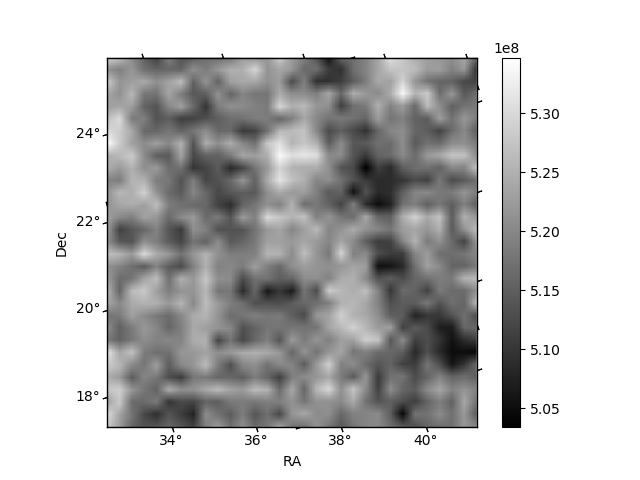
Quadrant B |
|---|---|---|---|
| Quadrant D | 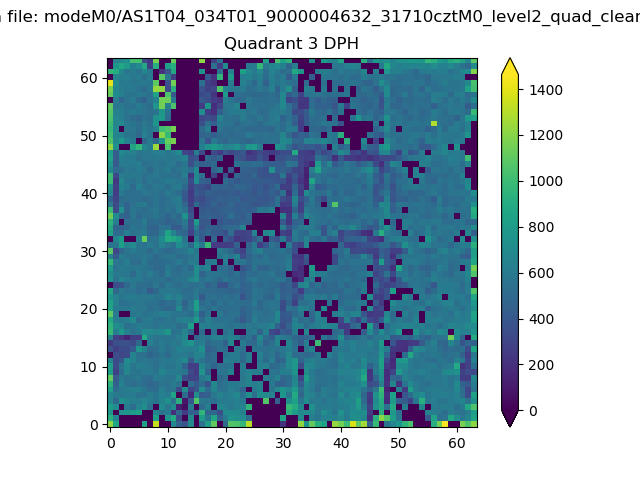 |
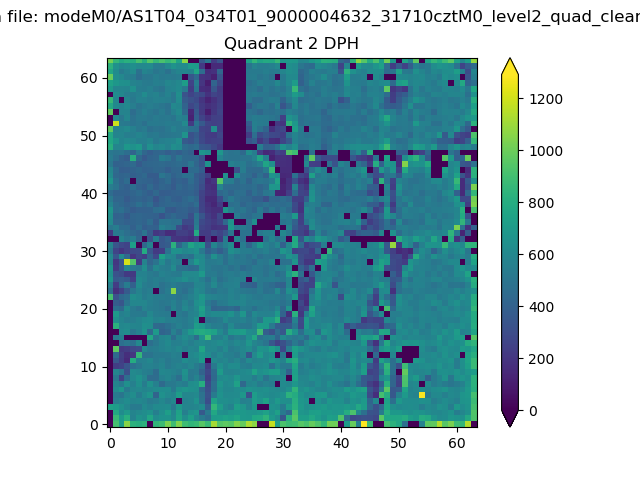 |
Quadrant C |
| Plot type | Count rate plots | Images |
|---|---|---|
| Comparison with Poisson distribution Blue bars denote a histogram of data divided into 1 sec bins. Red curve is a Poisson curve with rate = median count rate of data. |
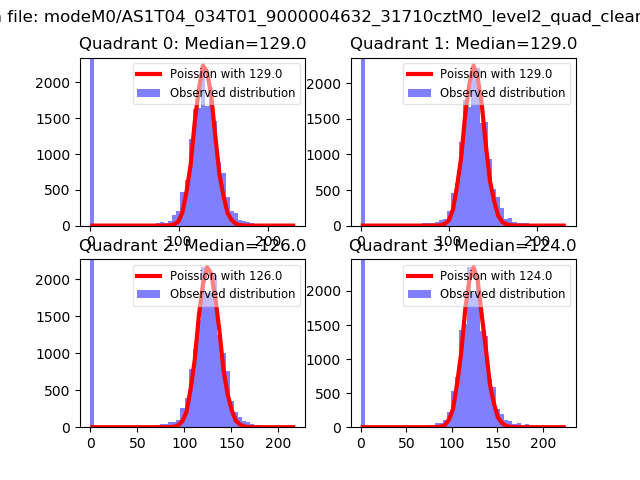 |
 |
| Quadrant-wise count rates Data is divided into 100 sec bins |
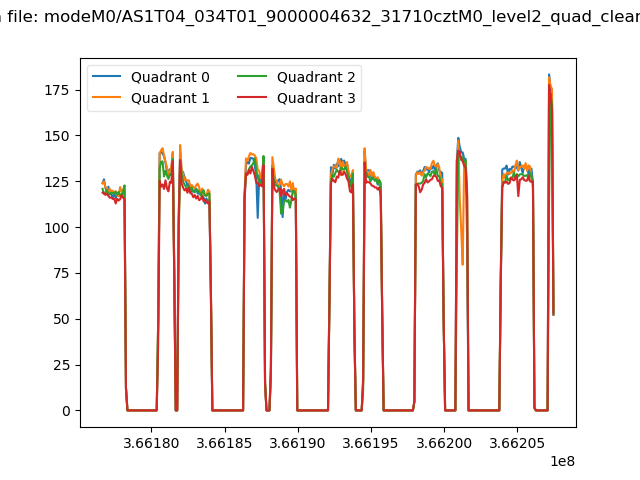 |
|
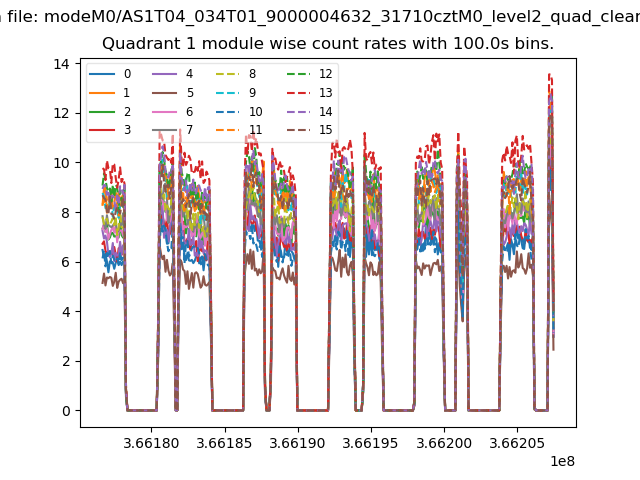
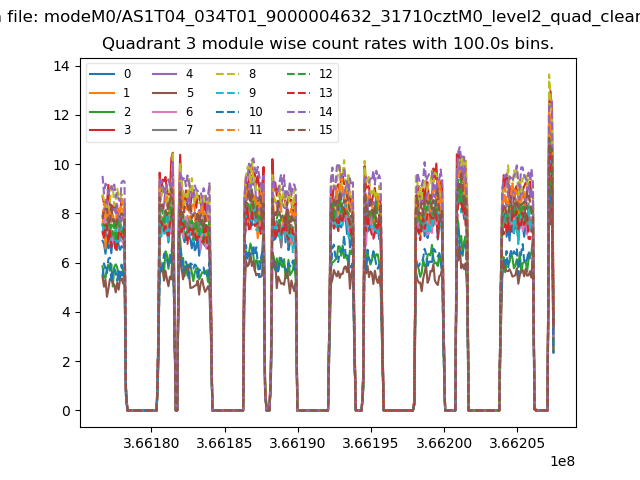
| Module-wise count rates for Quadrant A Data is divided into 100 sec bins |
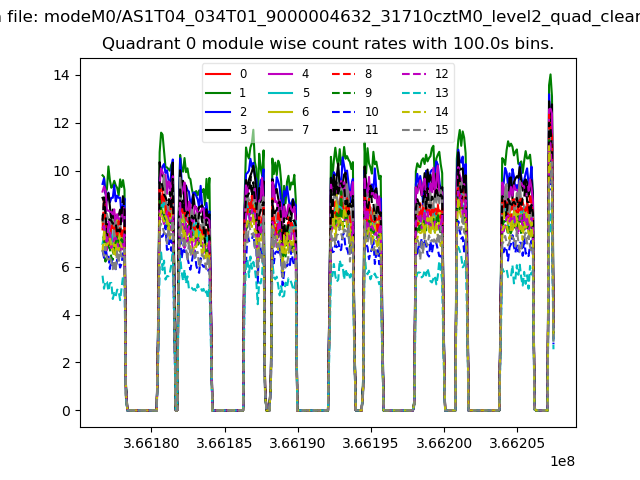 |
 |
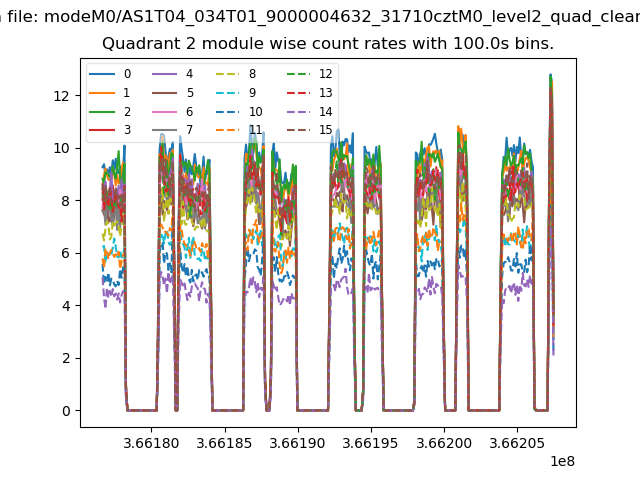
| Module-wise count rates for Quadrant B Data is divided into 100 sec bins |
 |
 |
| Module-wise count rates for Quadrant C Data is divided into 100 sec bins |
 |
 |
| Module-wise count rates for Quadrant D Data is divided into 100 sec bins |
 |
 |
| Parameter | Plot |
|---|---|
| CZT HV Monitor | 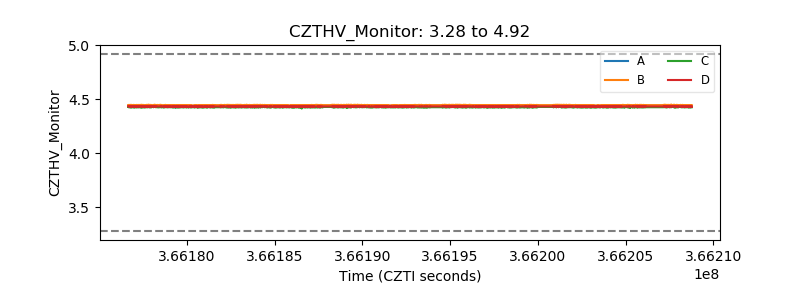 |
| D_VDD | 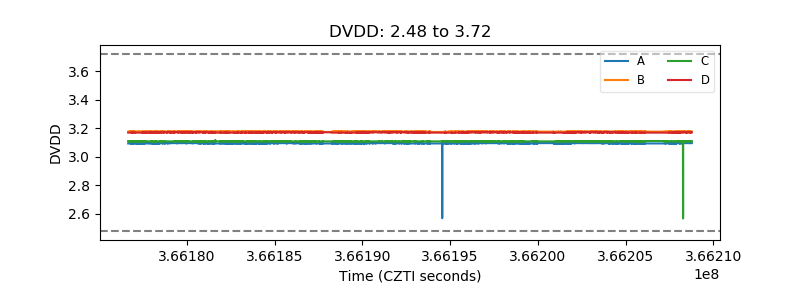 |
| Temperature 1 | 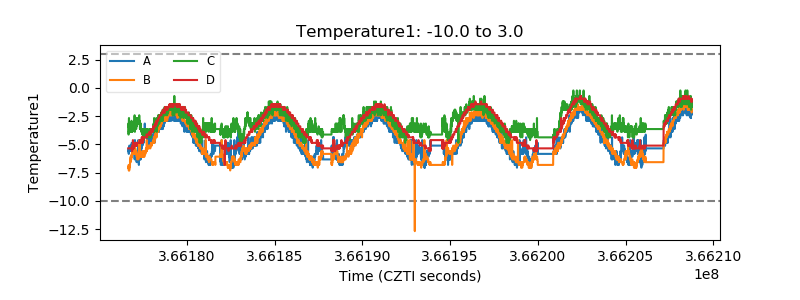 |
| Veto HV Monitor | 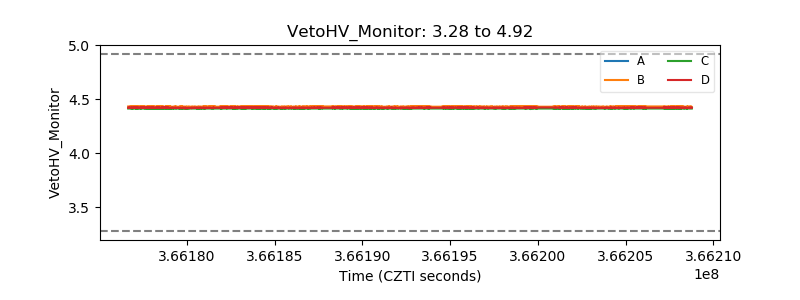 |
| Veto LLD | 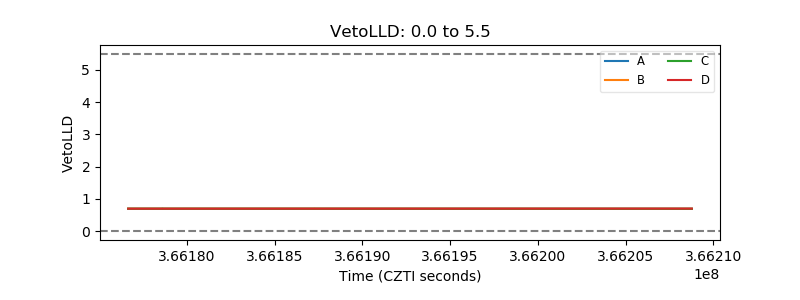 |
| Alpha Counter | 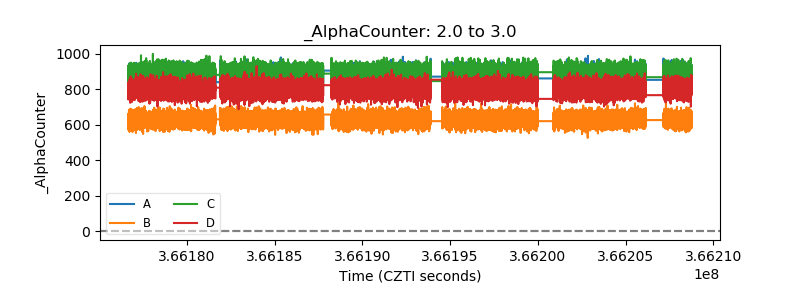 |
| _CPM_Rate | 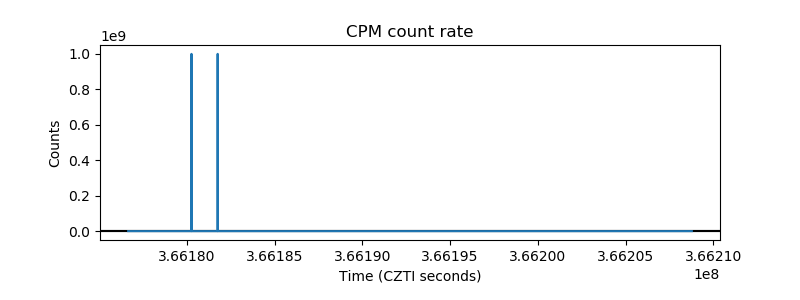 |
| CZT Counter | 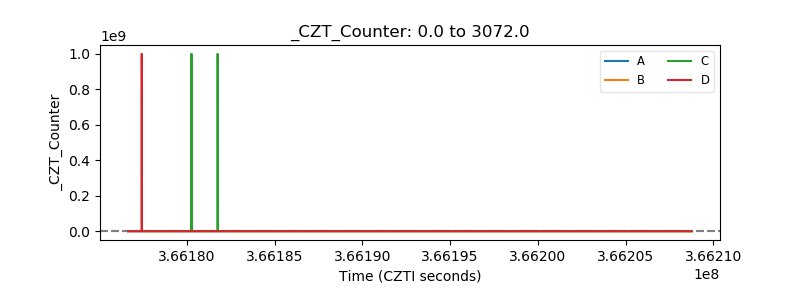 |
| +2.5 Volts monitor | 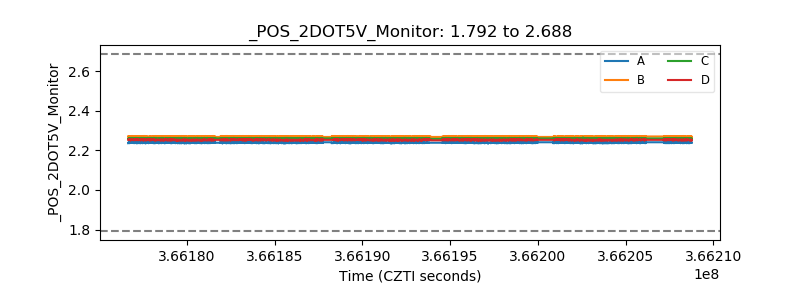 |
| +5 Volts monitor | 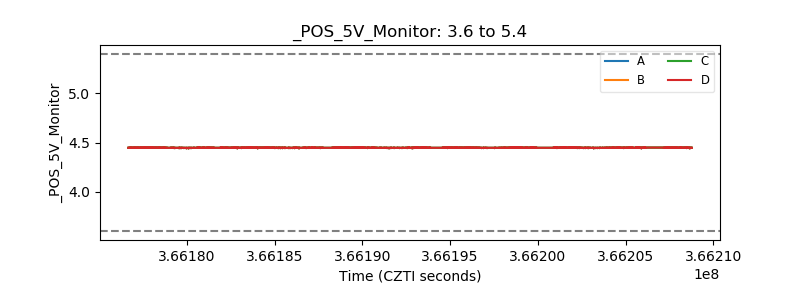 |
| _ROLL_ROT | 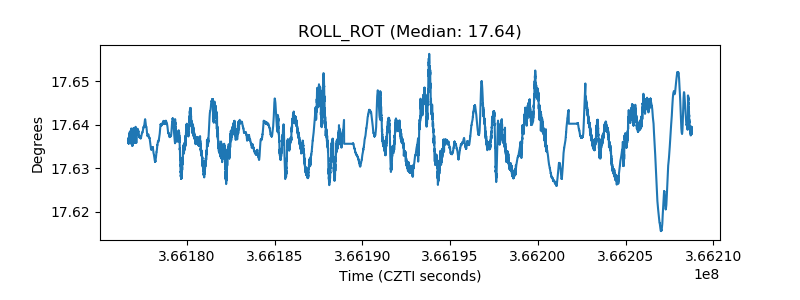 |
| _Roll_DEC | 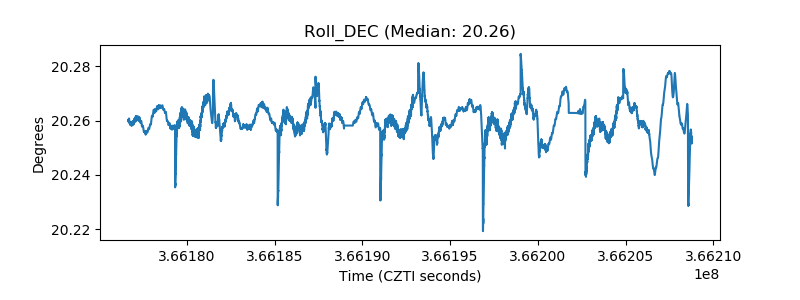 |
| _Roll_RA | 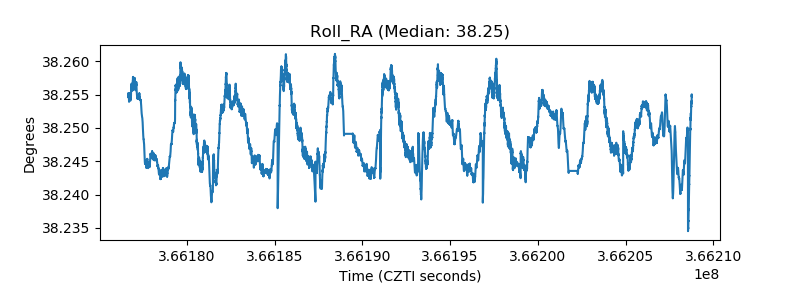 |
| Veto Counter | 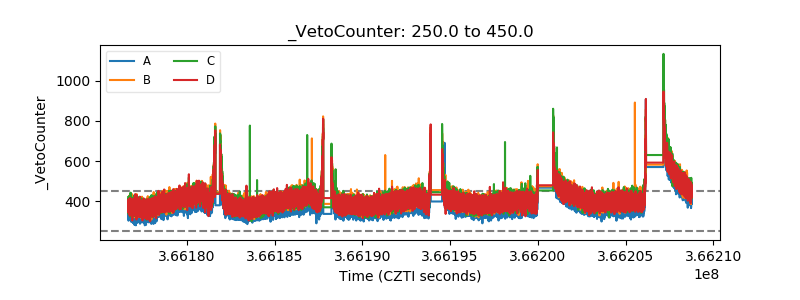 |