| Param | Original file | Final file |
|---|---|---|
| Filename | modeM0/AS1T04_034T01_9000004632_31713cztM0_level2.evt | modeM0/AS1T04_034T01_9000004632_31713cztM0_level2_quad_clean.evt |
| Size (bytes) | 660,850,560 | 66,643,200 |
| Size | 630.2 MB | 63.6 MB |
| Events in quadrant A | 4,103,435 | 414,835 |
| Events in quadrant B | 6,906,824 | 357,166 |
| Events in quadrant C | 4,360,779 | 402,422 |
| Events in quadrant D | 4,213,380 | 399,782 |
| Mode M9 | |||
|---|---|---|---|
| Quadrant | BADHDUFLAG | Total packets | Discarded packets |
| A | 0 | 13 | 0 |
| B | 0 | 14 | 0 |
| C | 0 | 14 | 0 |
| D | 0 | 14 | 0 |
| Mode SS | |||
|---|---|---|---|
| Quadrant | BADHDUFLAG | Total packets | Discarded packets |
| A | 0 | 130 | 0 |
| B | 0 | 130 | 0 |
| C | 0 | 130 | 0 |
| D | 0 | 130 | 0 |
| Mode M0 | |||
|---|---|---|---|
| Quadrant | BADHDUFLAG | Total packets | Discarded packets |
| A | 0 | 16411 | 2 |
| B | 0 | 24877 | 2 |
| C | 0 | 17244 | 2 |
| D | 0 | 16688 | 2 |
| Quadrant | Total seconds | Saturated seconds | Saturation percentage |
|---|---|---|---|
| A | 6350 | 232 | 3.653543% |
| B | 6350 | 1286 | 20.251969% |
| C | 6350 | 367 | 5.779528% |
| D | 6350 | 92 | 1.448819% |
Noise dominated data is calculated using 1-second bins in cleaned event files. If a bin has >2000 counts, and if more than 50% of those come from <1% of pixels, then it is considered to be noise-dominated and hence unusable.
| Quadrant | # 1 sec bins | Bins with >0 counts | Bins with >2000 counts | High rate bins dominated by noise | Noise dominated (total time) | Noise dominated (detector-on time) | Marked lightcurve |
|---|---|---|---|---|---|---|---|
| A | 7610 | 6351 | 68 | 68 | 0.89% | 1.07% | 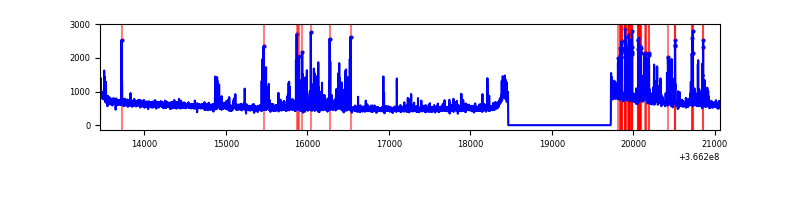 |
| B | 7610 | 6351 | 536 | 536 | 7.04% | 8.44% | 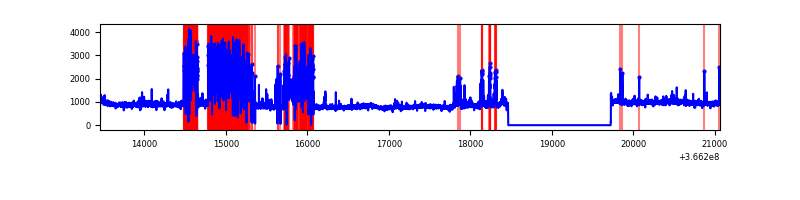 |
| C | 7610 | 6351 | 134 | 134 | 1.76% | 2.11% | 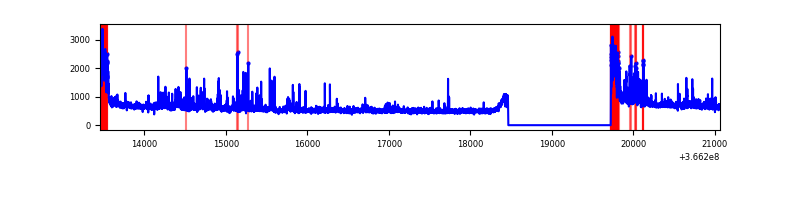 |
| D | 7610 | 6351 | 12 | 12 | 0.16% | 0.19% | 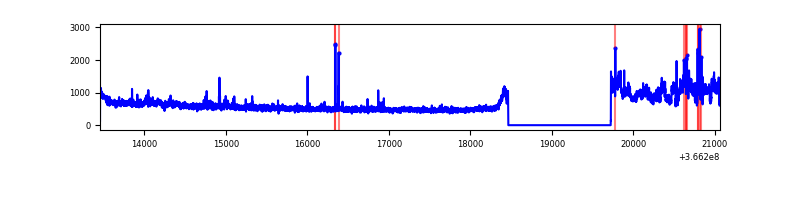 |
Top three noisy pixels from each quadrant. If the there are fewer than three noisy pixels in the level2.evt file, extra rows are filled as -1
| Pixel properties | Quadrant properties | ||||||
|---|---|---|---|---|---|---|---|
| Quadrant | DetID | PixID | Counts | Sigma | Mean | Median | Sigma |
| A | 0 | 13 | 546175 | 2991.87 | 918 | 902 | 182.3 |
| A | 13 | 254 | 11862 | 60.14 | 918 | 902 | 182.3 |
| A | 12 | 96 | 9019 | 44.54 | 918 | 902 | 182.3 |
| B | 4 | 80 | 2167817 | 14733.57 | 792 | 775 | 147.1 |
| B | 6 | 159 | 1518949 | 10321.96 | 792 | 775 | 147.1 |
| B | 0 | 229 | 54853 | 367.67 | 792 | 775 | 147.1 |
| C | 0 | 10 | 721647 | 3613.92 | 866 | 877 | 199.4 |
| C | 14 | 238 | 141002 | 702.58 | 866 | 877 | 199.4 |
| C | 0 | 207 | 46397 | 228.24 | 866 | 877 | 199.4 |
| D | 8 | 195 | 715793 | 3393.04 | 903 | 884 | 210.7 |
| D | 2 | 250 | 34095 | 157.62 | 903 | 884 | 210.7 |
| D | 13 | 249 | 29386 | 135.27 | 903 | 884 | 210.7 |
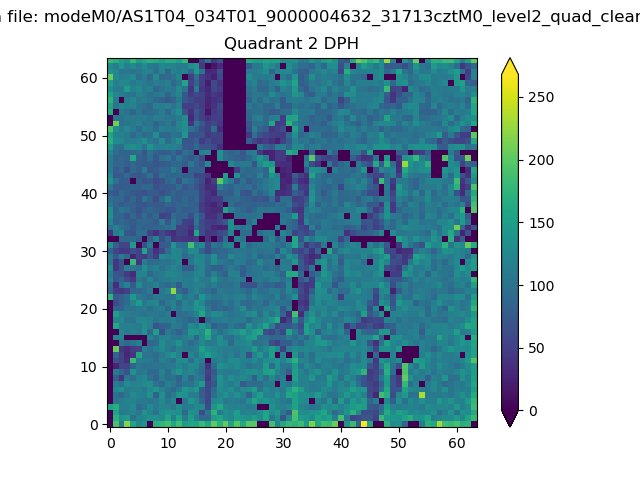
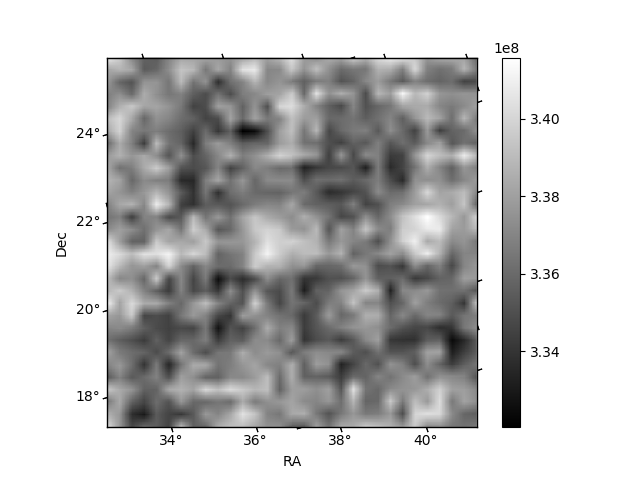
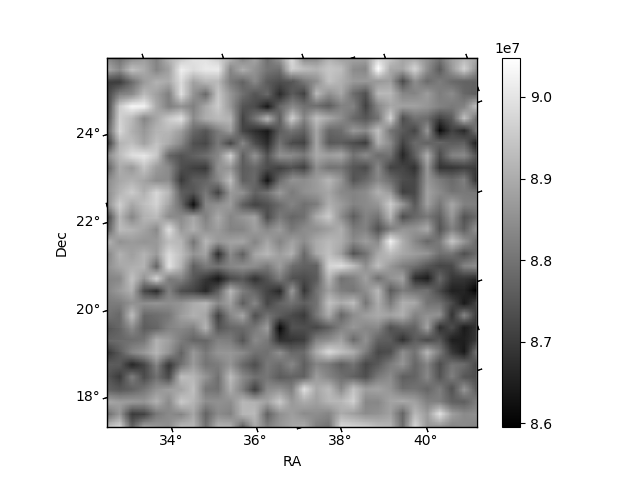
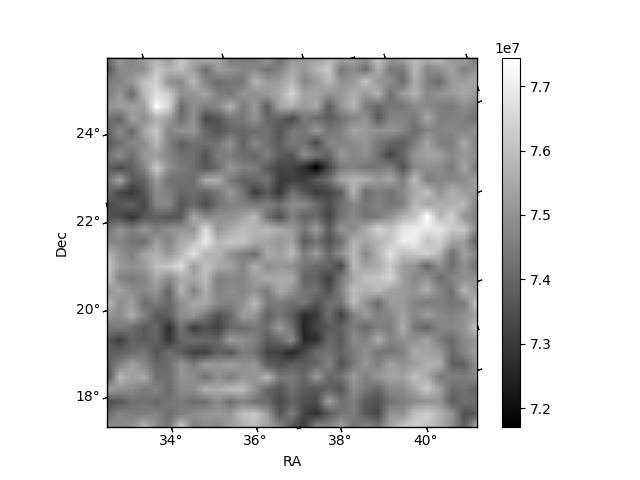
Histogram calculated using DETX and DETY for each event in the final _common_clean file
| Quadrant A | 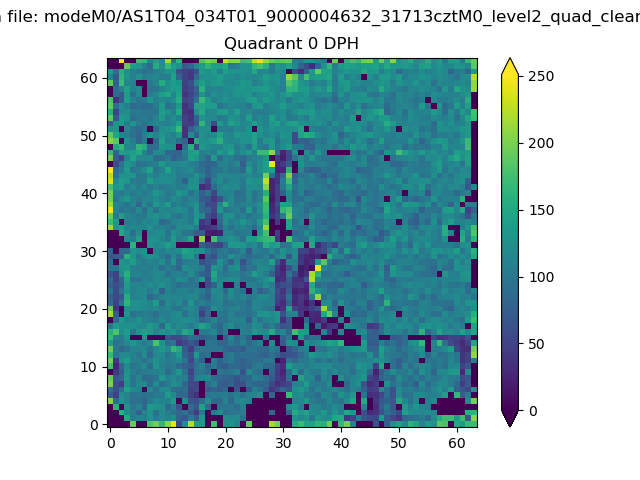 |
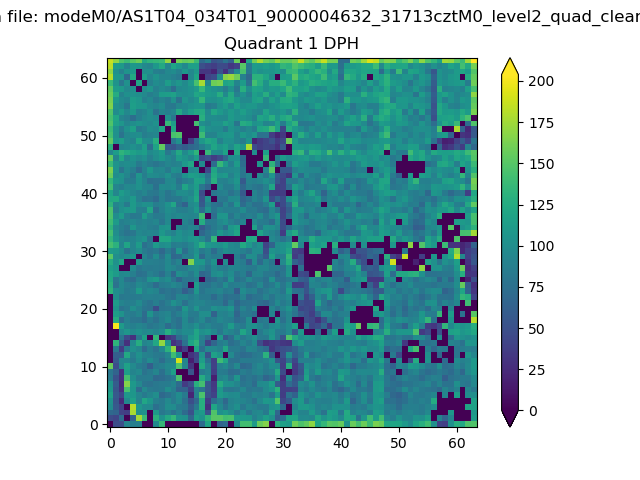 |
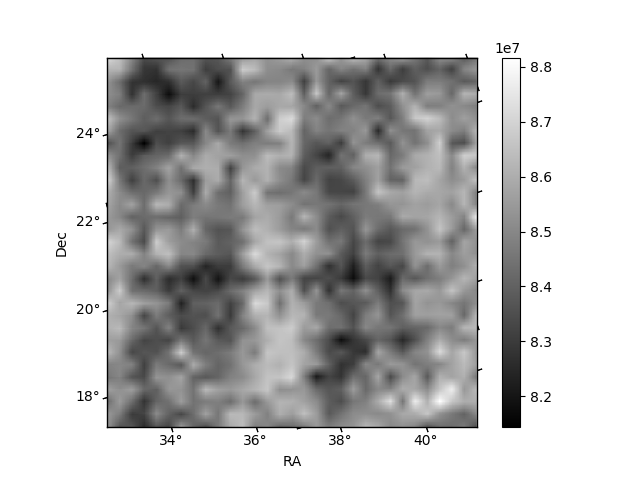
Quadrant B |
|---|---|---|---|
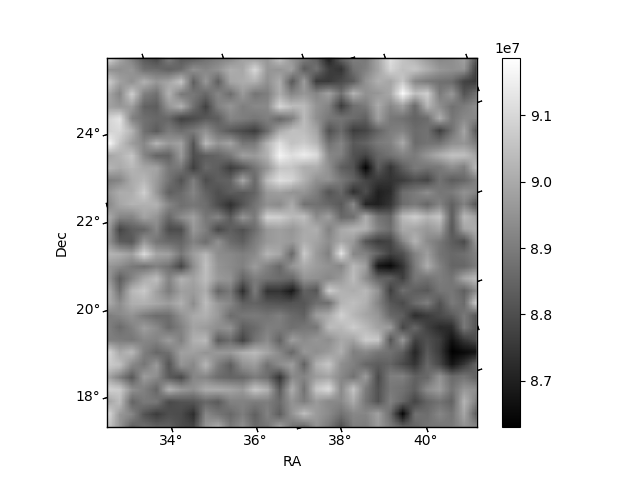
| Quadrant D | 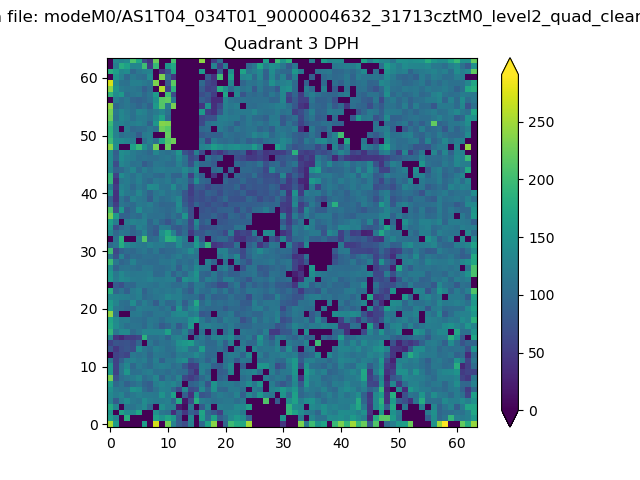 |
 |
Quadrant C |
| Plot type | Count rate plots | Images |
|---|---|---|
| Comparison with Poisson distribution Blue bars denote a histogram of data divided into 1 sec bins. Red curve is a Poisson curve with rate = median count rate of data. |
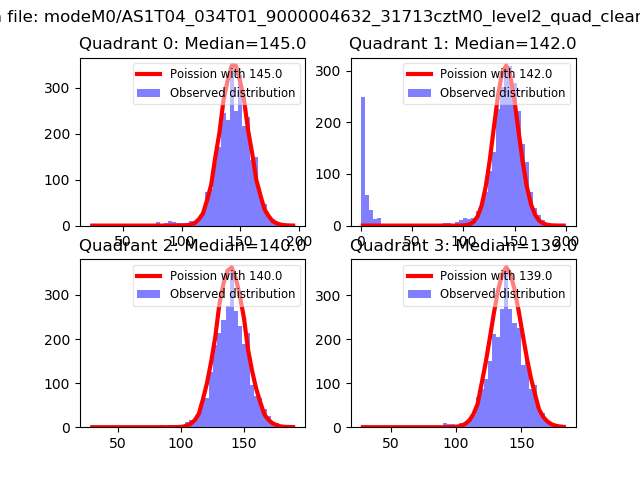 |
 |
| Quadrant-wise count rates Data is divided into 100 sec bins |
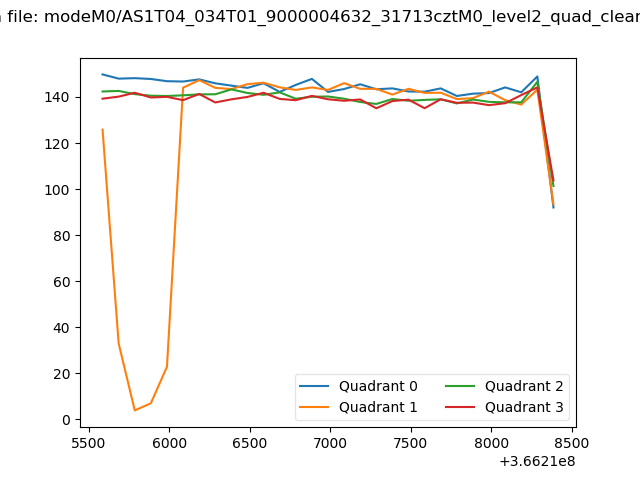 |
|
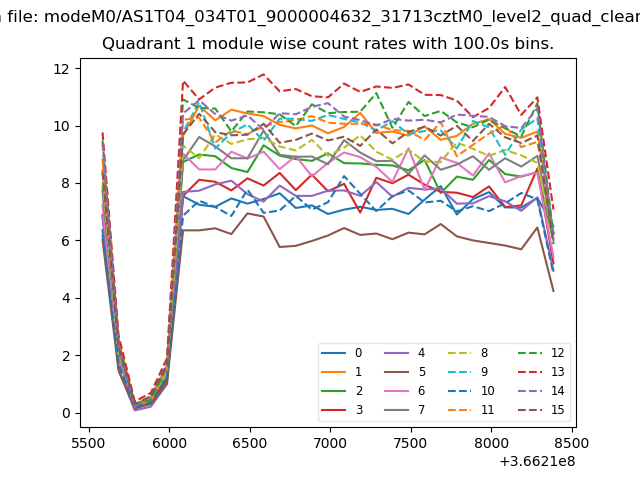
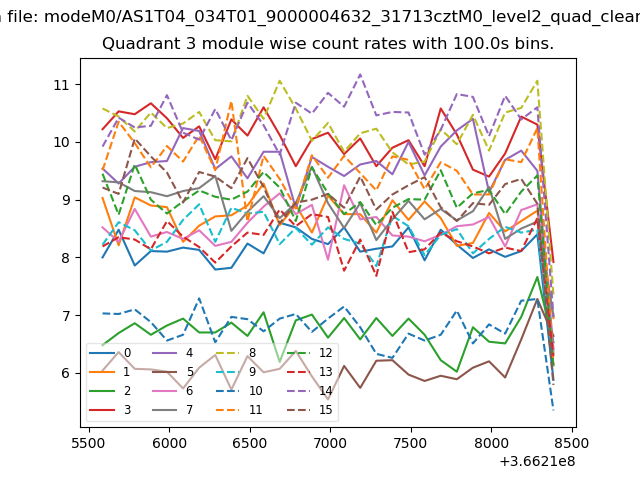
| Module-wise count rates for Quadrant A Data is divided into 100 sec bins |
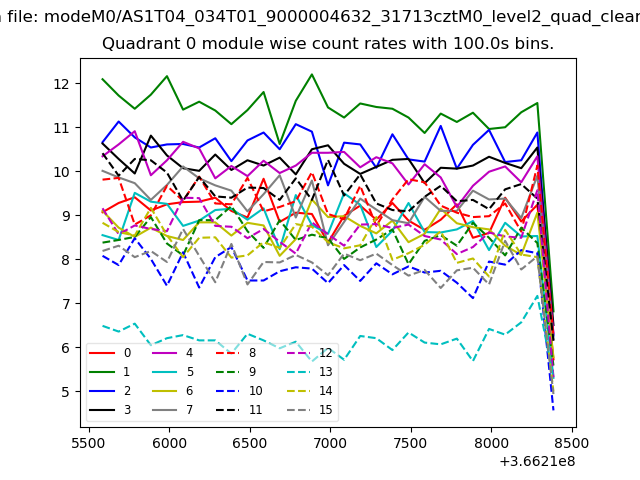 |
 |
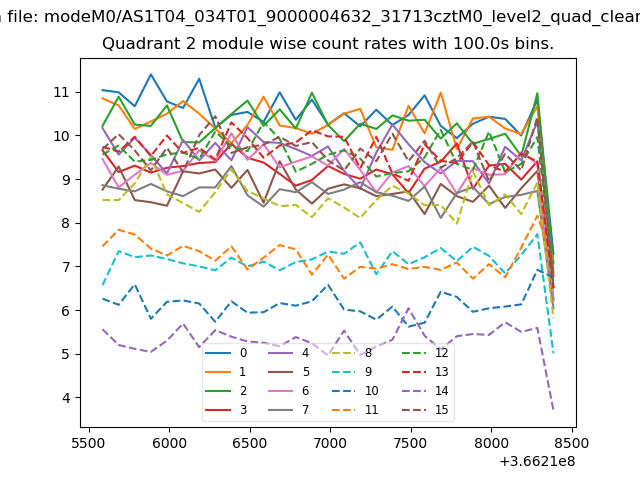
| Module-wise count rates for Quadrant B Data is divided into 100 sec bins |
 |
 |
| Module-wise count rates for Quadrant C Data is divided into 100 sec bins |
 |
 |
| Module-wise count rates for Quadrant D Data is divided into 100 sec bins |
 |
 |
| Parameter | Plot |
|---|---|
| CZT HV Monitor | 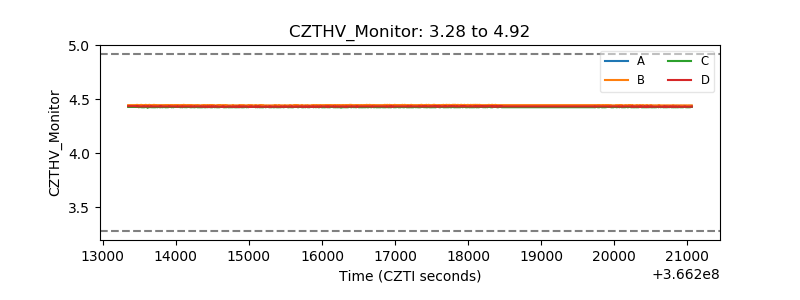 |
| D_VDD | 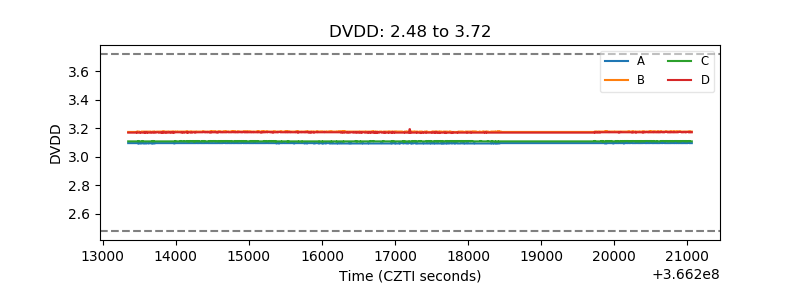 |
| Temperature 1 | 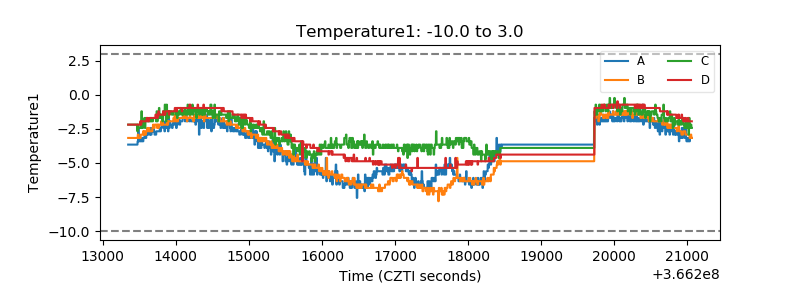 |
| Veto HV Monitor | 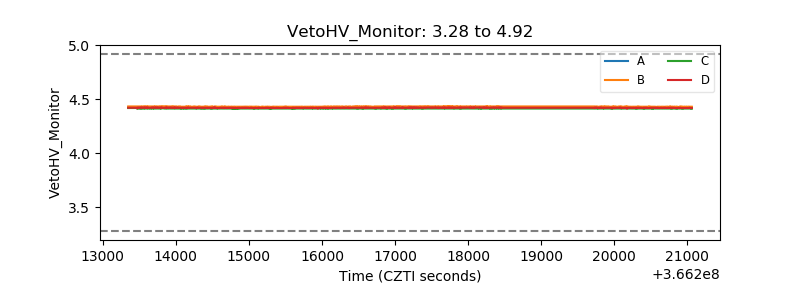 |
| Veto LLD | 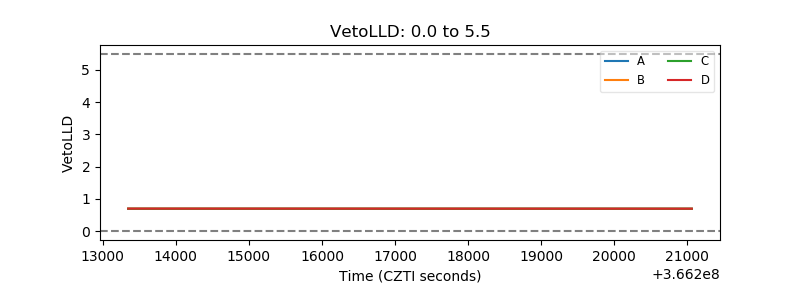 |
| Alpha Counter | 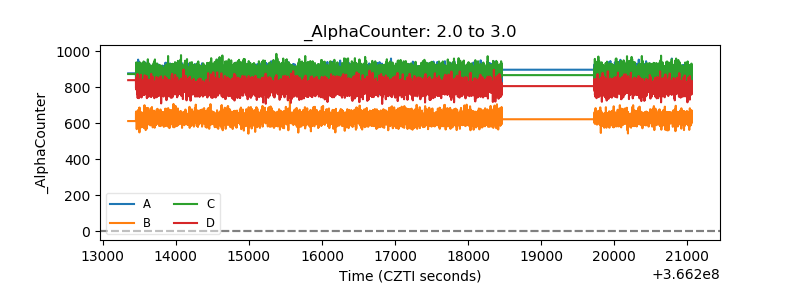 |
| _CPM_Rate | 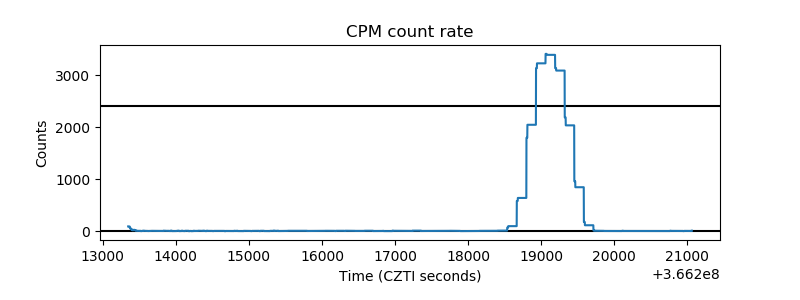 |
| CZT Counter | 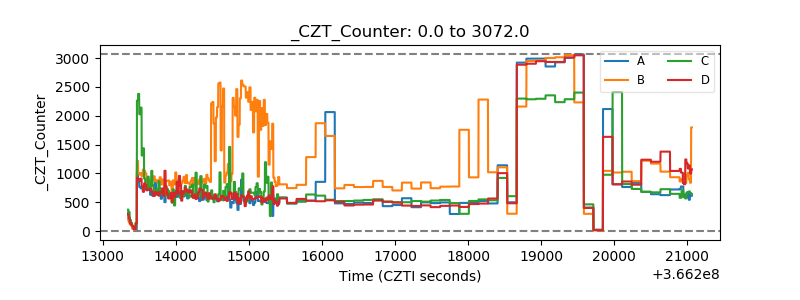 |
| +2.5 Volts monitor | 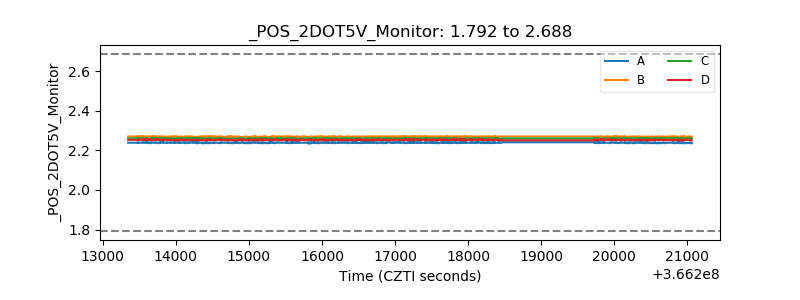 |
| +5 Volts monitor |  |
| _ROLL_ROT | 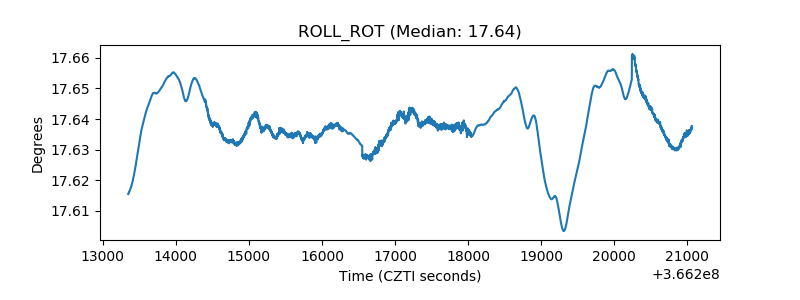 |
| _Roll_DEC | 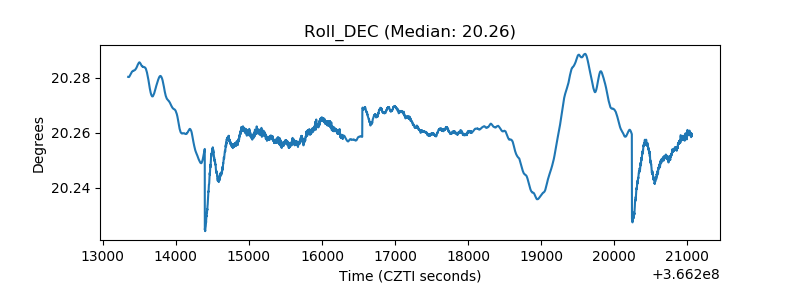 |
| _Roll_RA | 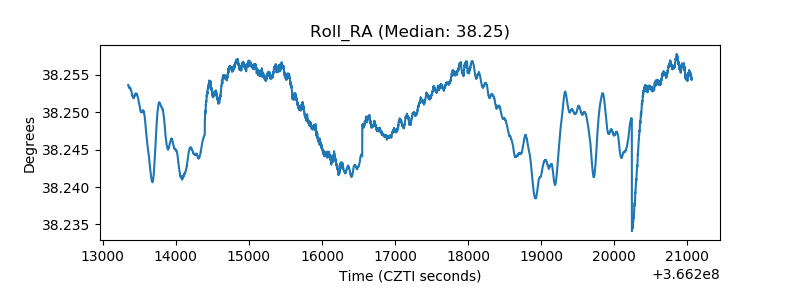 |
| Veto Counter | 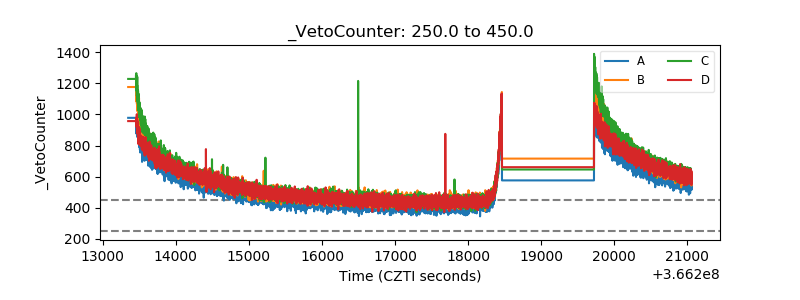 |