| Param | Original file | Final file |
|---|---|---|
| Filename | modeM0/AS1T04_034T01_9000004632_31714cztM0_level2.evt | modeM0/AS1T04_034T01_9000004632_31714cztM0_level2_quad_clean.evt |
| Size (bytes) | 731,727,360 | 76,651,200 |
| Size | 697.8 MB | 73.1 MB |
| Events in quadrant A | 4,910,106 | 469,338 |
| Events in quadrant B | 5,794,043 | 486,735 |
| Events in quadrant C | 4,666,639 | 475,557 |
| Events in quadrant D | 6,373,247 | 457,318 |
| Mode M9 | |||
|---|---|---|---|
| Quadrant | BADHDUFLAG | Total packets | Discarded packets |
| A | 0 | 18 | 0 |
| B | 0 | 19 | 0 |
| C | 0 | 19 | 0 |
| D | 0 | 19 | 0 |
| Mode SS | |||
|---|---|---|---|
| Quadrant | BADHDUFLAG | Total packets | Discarded packets |
| A | 0 | 126 | 0 |
| B | 0 | 126 | 0 |
| C | 0 | 126 | 0 |
| D | 0 | 126 | 0 |
| Mode M0 | |||
|---|---|---|---|
| Quadrant | BADHDUFLAG | Total packets | Discarded packets |
| A | 0 | 18852 | 2 |
| B | 0 | 21631 | 5 |
| C | 0 | 18055 | 2 |
| D | 0 | 23405 | 2 |
| Quadrant | Total seconds | Saturated seconds | Saturation percentage |
|---|---|---|---|
| A | 6188 | 417 | 6.738849% |
| B | 6187 | 269 | 4.347826% |
| C | 6187 | 415 | 6.707613% |
| D | 6187 | 546 | 8.824956% |
Noise dominated data is calculated using 1-second bins in cleaned event files. If a bin has >2000 counts, and if more than 50% of those come from <1% of pixels, then it is considered to be noise-dominated and hence unusable.
| Quadrant | # 1 sec bins | Bins with >0 counts | Bins with >2000 counts | High rate bins dominated by noise | Noise dominated (total time) | Noise dominated (detector-on time) | Marked lightcurve |
|---|---|---|---|---|---|---|---|
| A | 7538 | 6189 | 236 | 236 | 3.13% | 3.81% | 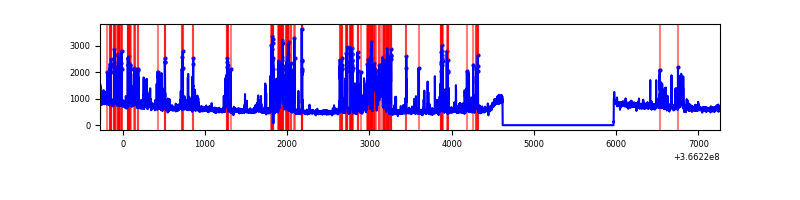 |
| B | 7537 | 6188 | 42 | 42 | 0.56% | 0.68% |  |
| C | 7537 | 6188 | 131 | 131 | 1.74% | 2.12% | 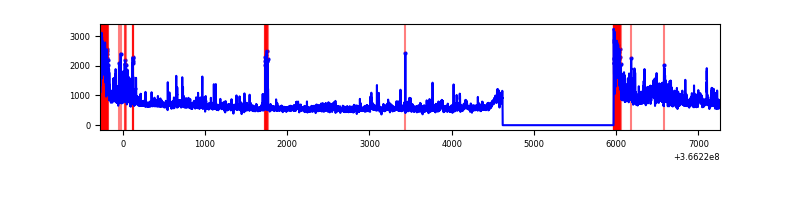 |
| D | 7537 | 6188 | 363 | 363 | 4.82% | 5.87% | 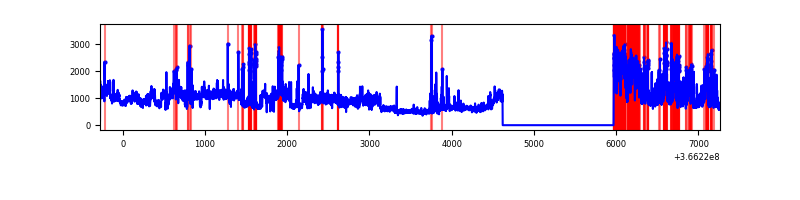 |
Top three noisy pixels from each quadrant. If the there are fewer than three noisy pixels in the level2.evt file, extra rows are filled as -1
| Pixel properties | Quadrant properties | ||||||
|---|---|---|---|---|---|---|---|
| Quadrant | DetID | PixID | Counts | Sigma | Mean | Median | Sigma |
| A | 0 | 13 | 1369656 | 7553.73 | 915 | 902 | 181.2 |
| A | 13 | 254 | 12163 | 62.15 | 915 | 902 | 181.2 |
| A | 3 | 137 | 7998 | 39.16 | 915 | 902 | 181.2 |
| B | 6 | 159 | 1775437 | 10584.83 | 912 | 893 | 167.6 |
| B | 4 | 80 | 192343 | 1141.96 | 912 | 893 | 167.6 |
| B | 0 | 229 | 122363 | 724.55 | 912 | 893 | 167.6 |
| C | 0 | 10 | 844619 | 4224.07 | 876 | 888 | 199.7 |
| C | 14 | 238 | 145176 | 722.37 | 876 | 888 | 199.7 |
| C | 3 | 233 | 119407 | 593.36 | 876 | 888 | 199.7 |
| D | 8 | 195 | 1755943 | 8462.18 | 885 | 867 | 207.4 |
| D | 12 | 233 | 946335 | 4558.62 | 885 | 867 | 207.4 |
| D | 13 | 249 | 284949 | 1369.71 | 885 | 867 | 207.4 |
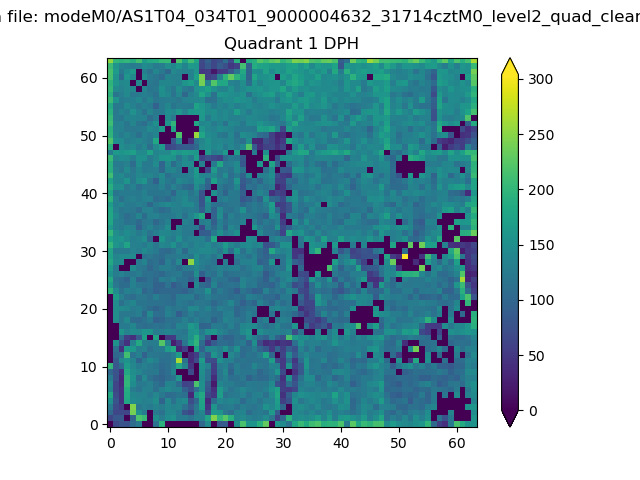
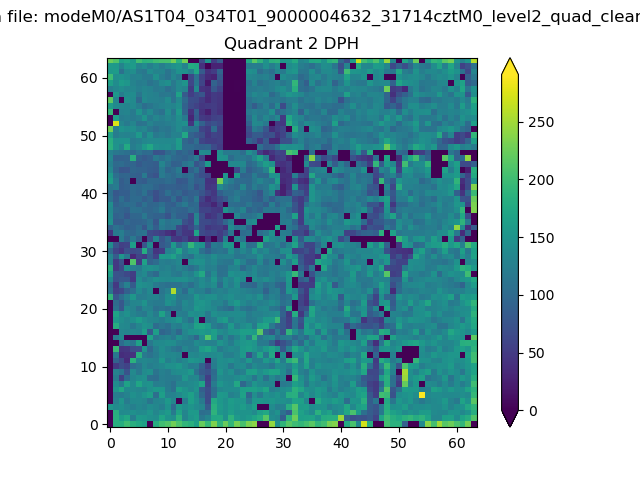
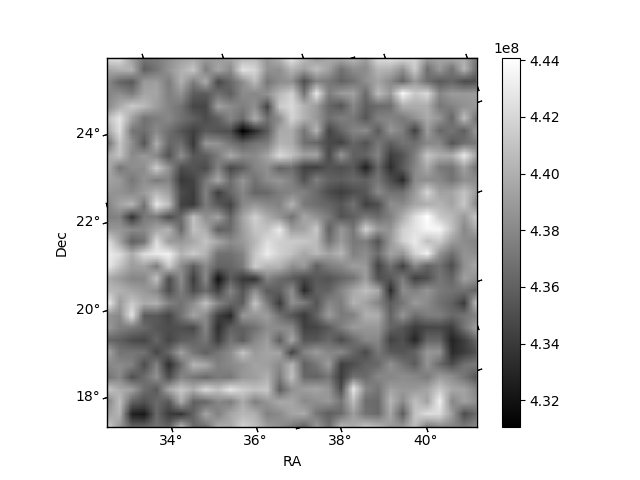
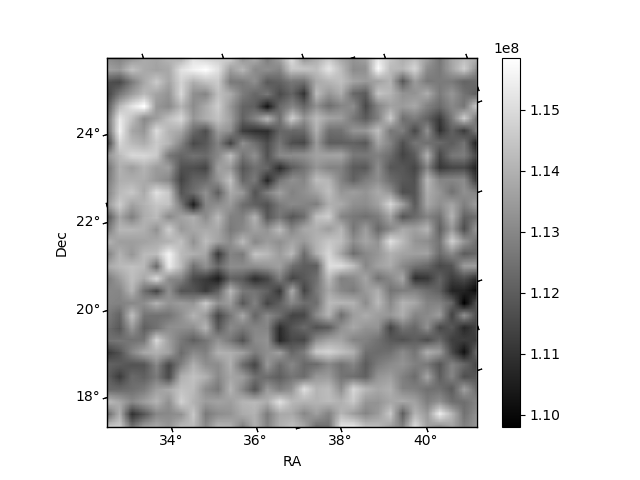
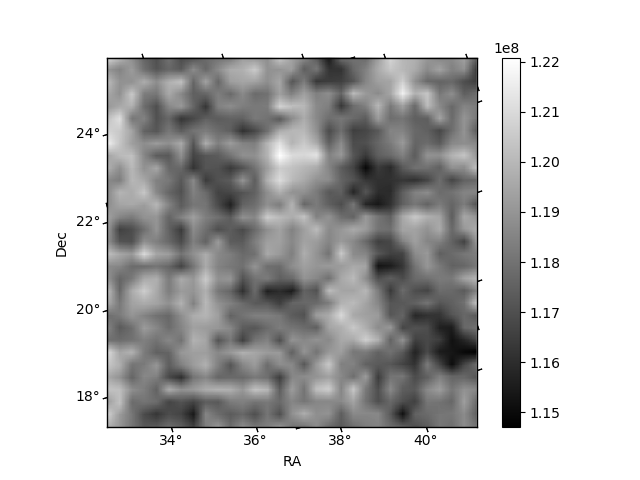
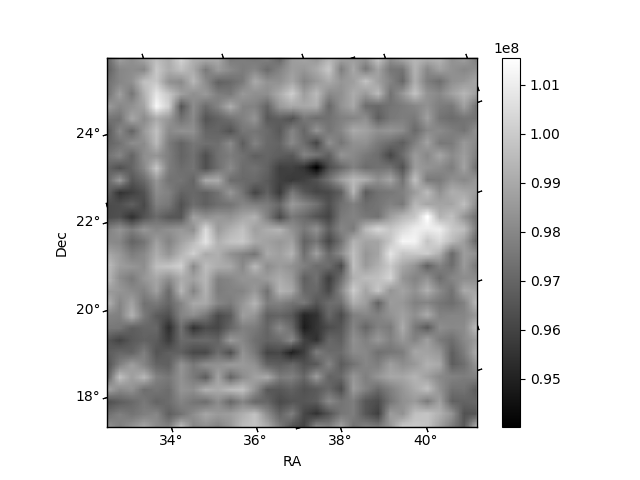
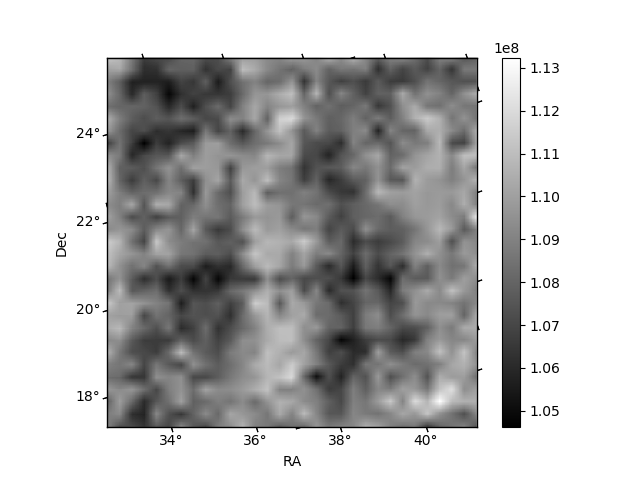
Histogram calculated using DETX and DETY for each event in the final _common_clean file
| Quadrant A | 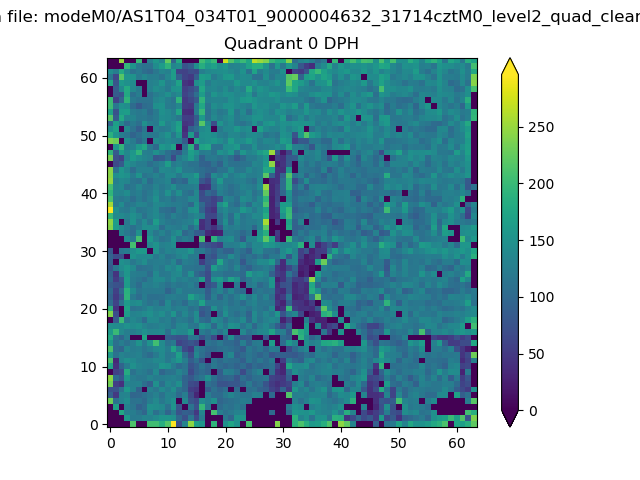 |
 |
Quadrant B |
|---|---|---|---|
| Quadrant D | 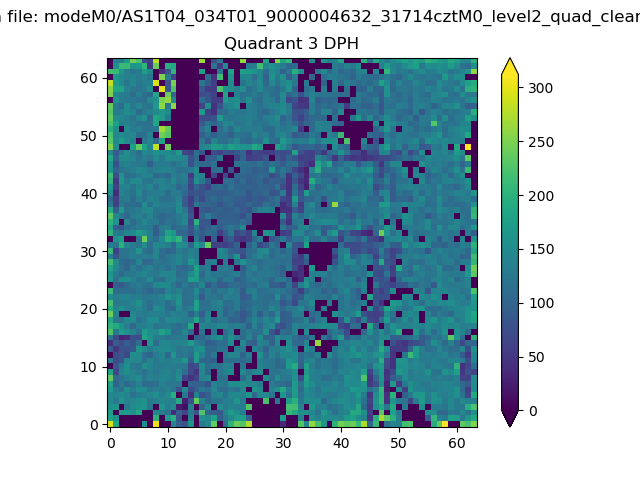 |
 |
Quadrant C |
| Plot type | Count rate plots | Images |
|---|---|---|
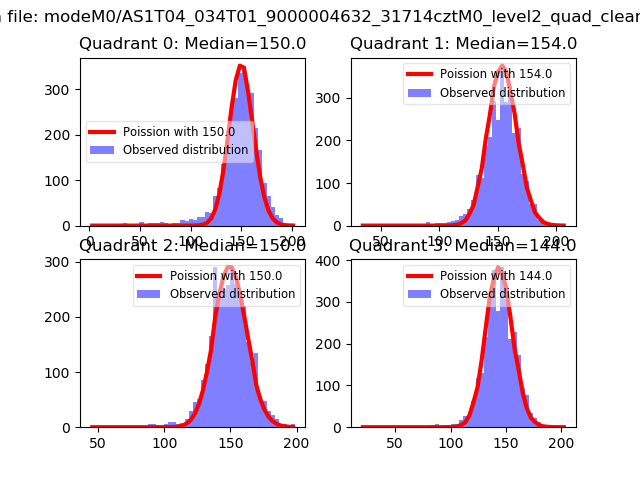
| Comparison with Poisson distribution Blue bars denote a histogram of data divided into 1 sec bins. Red curve is a Poisson curve with rate = median count rate of data. |
 |
 |
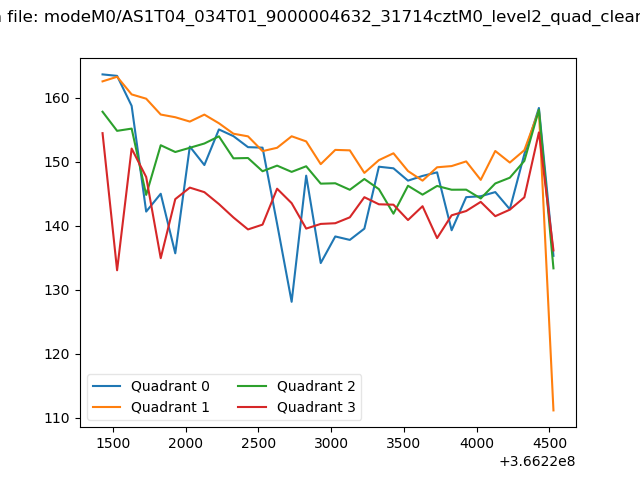
| Quadrant-wise count rates Data is divided into 100 sec bins |
 |
|
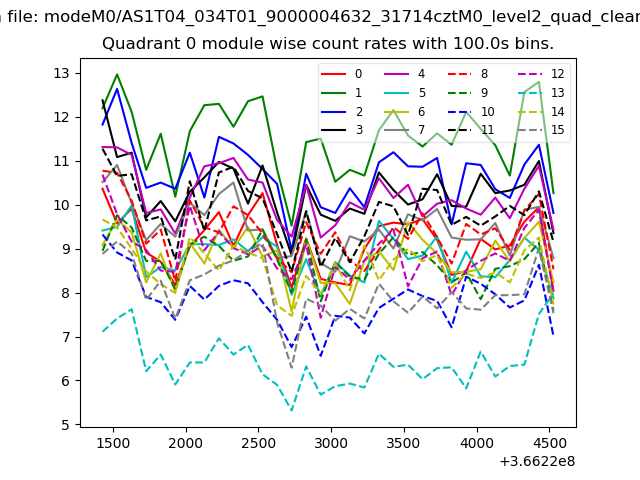
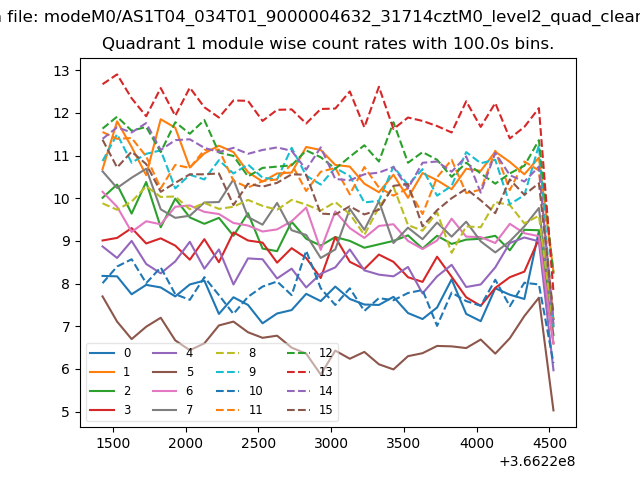
| Module-wise count rates for Quadrant A Data is divided into 100 sec bins |
 |
 |
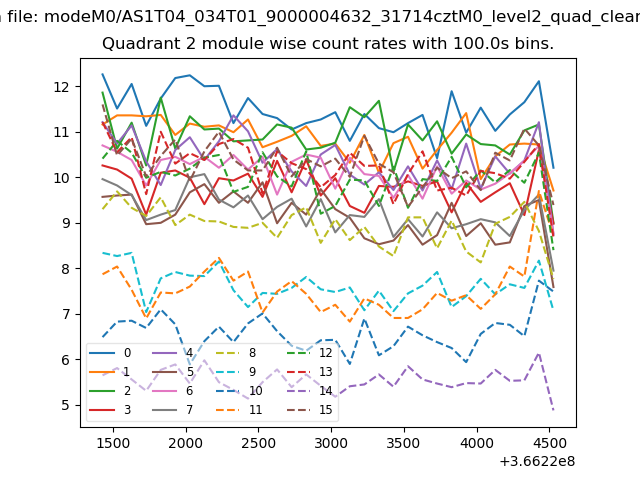
| Module-wise count rates for Quadrant B Data is divided into 100 sec bins |
 |
 |
| Module-wise count rates for Quadrant C Data is divided into 100 sec bins |
 |
 |
| Module-wise count rates for Quadrant D Data is divided into 100 sec bins |
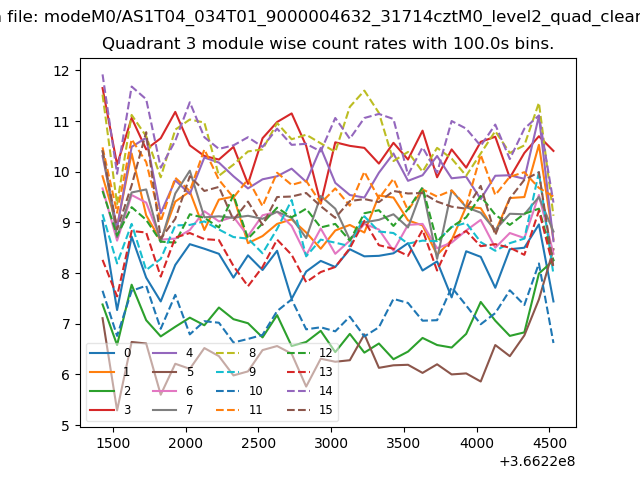 |
 |
| Parameter | Plot |
|---|---|
| CZT HV Monitor | 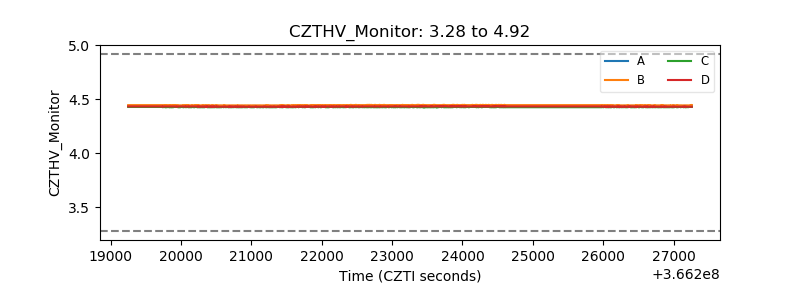 |
| D_VDD | 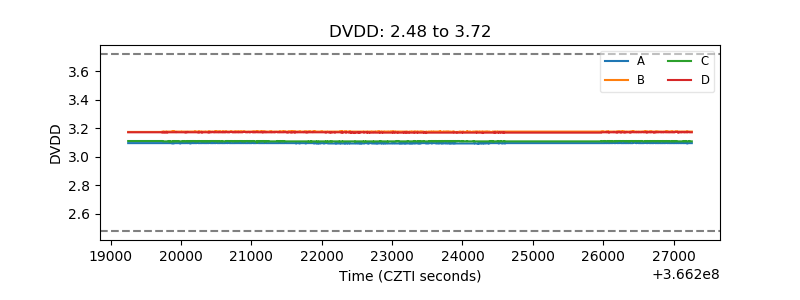 |
| Temperature 1 | 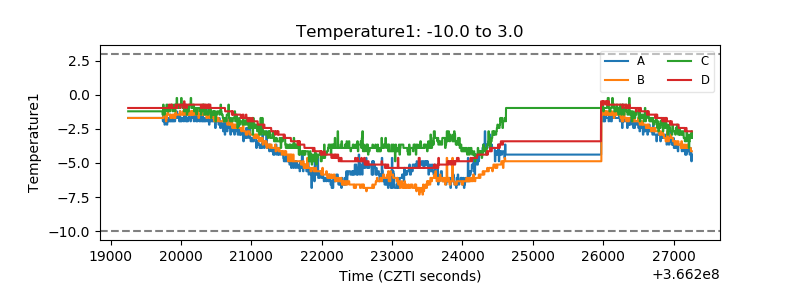 |
| Veto HV Monitor | 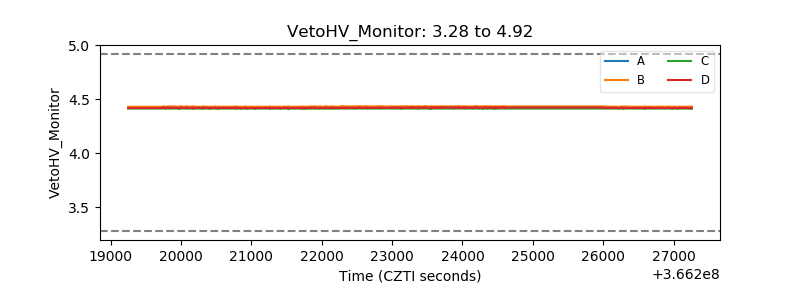 |
| Veto LLD | 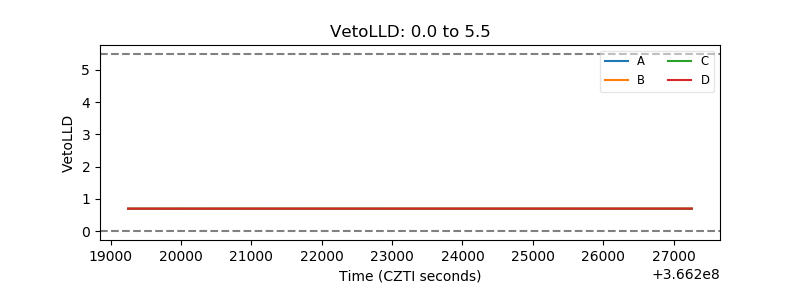 |
| Alpha Counter | 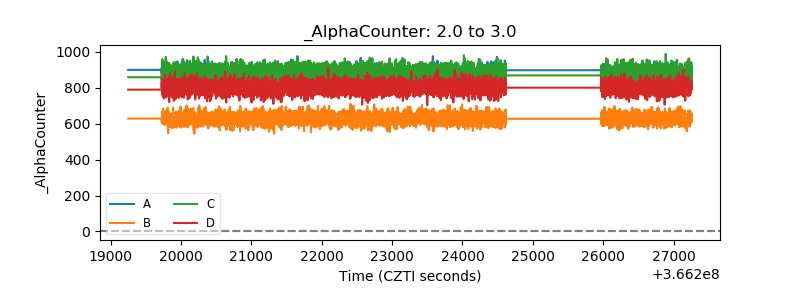 |
| _CPM_Rate | 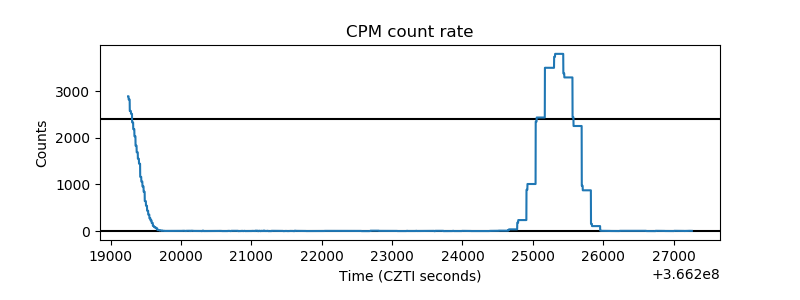 |
| CZT Counter | 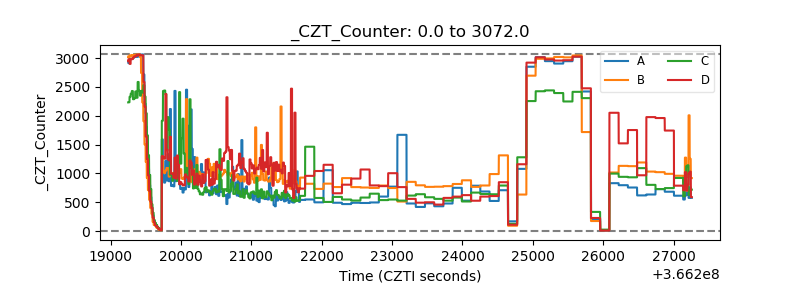 |
| +2.5 Volts monitor |  |
| +5 Volts monitor |  |
| _ROLL_ROT | 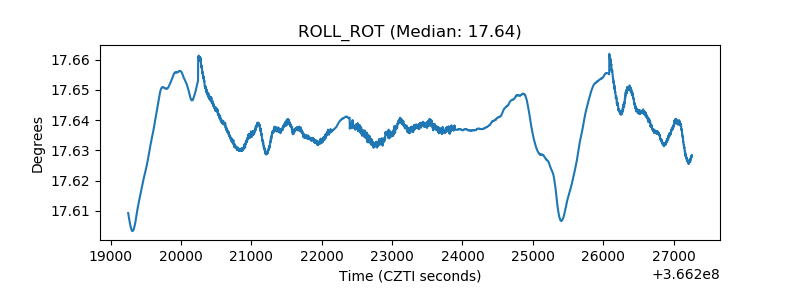 |
| _Roll_DEC | 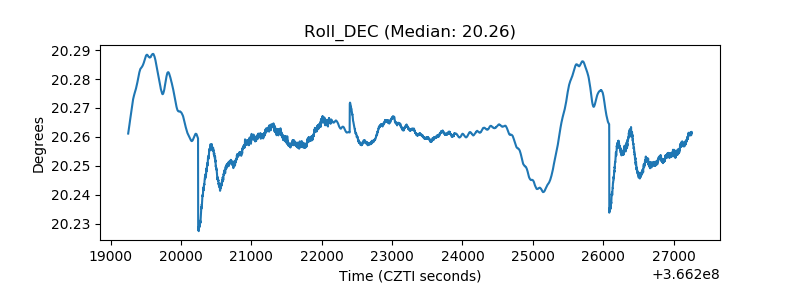 |
| _Roll_RA | 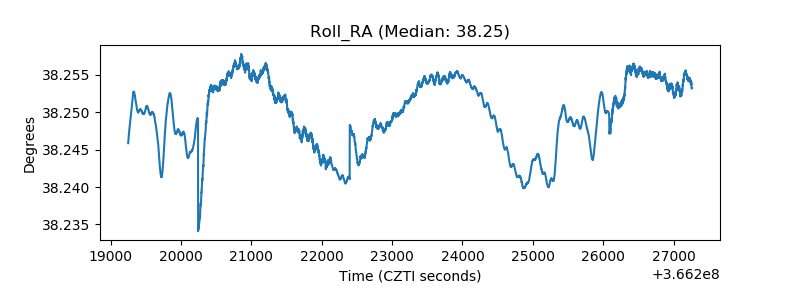 |
| Veto Counter | 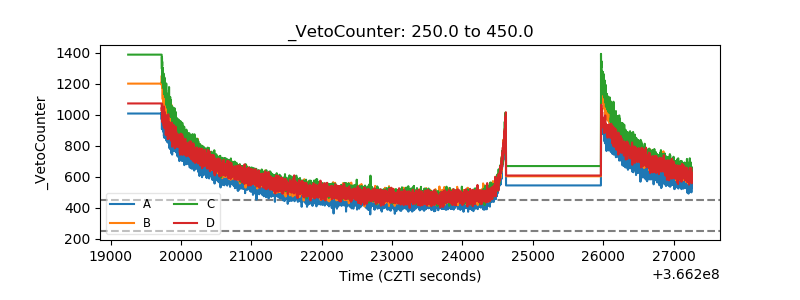 |