| Param | Original file | Final file |
|---|---|---|
| Filename | modeM0/AS1T04_034T01_9000004632_31716cztM0_level2.evt | modeM0/AS1T04_034T01_9000004632_31716cztM0_level2_quad_clean.evt |
| Size (bytes) | 644,207,040 | 99,771,840 |
| Size | 614.4 MB | 95.1 MB |
| Events in quadrant A | 5,545,217 | 634,608 |
| Events in quadrant B | 5,422,939 | 665,758 |
| Events in quadrant C | 4,099,779 | 653,631 |
| Events in quadrant D | 4,026,997 | 638,594 |
| Mode M9 | |||
|---|---|---|---|
| Quadrant | BADHDUFLAG | Total packets | Discarded packets |
| A | 0 | 13 | 0 |
| B | 0 | 13 | 0 |
| C | 0 | 13 | 0 |
| D | 0 | 13 | 0 |
| Mode SS | |||
|---|---|---|---|
| Quadrant | BADHDUFLAG | Total packets | Discarded packets |
| A | 0 | 124 | 0 |
| B | 0 | 124 | 0 |
| C | 0 | 124 | 0 |
| D | 0 | 124 | 0 |
| Mode M0 | |||
|---|---|---|---|
| Quadrant | BADHDUFLAG | Total packets | Discarded packets |
| A | 0 | 20611 | 1 |
| B | 0 | 20169 | 1 |
| C | 0 | 16386 | 1 |
| D | 0 | 16040 | 1 |
| Quadrant | Total seconds | Saturated seconds | Saturation percentage |
|---|---|---|---|
| A | 6147 | 938 | 15.259476% |
| B | 6147 | 219 | 3.562714% |
| C | 6147 | 322 | 5.238328% |
| D | 6147 | 110 | 1.789491% |
Noise dominated data is calculated using 1-second bins in cleaned event files. If a bin has >2000 counts, and if more than 50% of those come from <1% of pixels, then it is considered to be noise-dominated and hence unusable.
| Quadrant | # 1 sec bins | Bins with >0 counts | Bins with >2000 counts | High rate bins dominated by noise | Noise dominated (total time) | Noise dominated (detector-on time) | Marked lightcurve |
|---|---|---|---|---|---|---|---|
| A | 7447 | 6148 | 668 | 668 | 8.97% | 10.87% | 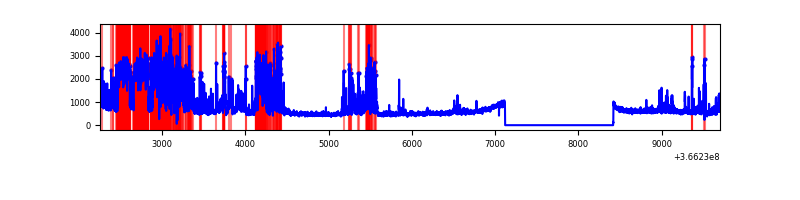 |
| B | 7447 | 6148 | 26 | 26 | 0.35% | 0.42% |  |
| C | 7447 | 6148 | 92 | 92 | 1.24% | 1.50% | 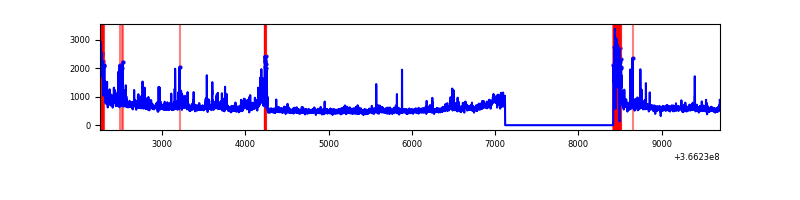 |
| D | 7447 | 6148 | 39 | 39 | 0.52% | 0.63% | 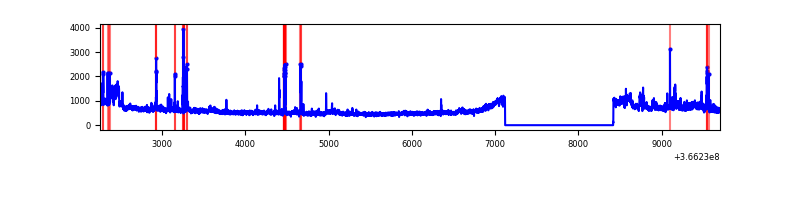 |
Top three noisy pixels from each quadrant. If the there are fewer than three noisy pixels in the level2.evt file, extra rows are filled as -1
| Pixel properties | Quadrant properties | ||||||
|---|---|---|---|---|---|---|---|
| Quadrant | DetID | PixID | Counts | Sigma | Mean | Median | Sigma |
| A | 0 | 13 | 1472770 | 9200.89 | 805 | 793 | 160.0 |
| A | 12 | 96 | 957467 | 5979.88 | 805 | 793 | 160.0 |
| A | 13 | 254 | 10991 | 63.74 | 805 | 793 | 160.0 |
| B | 6 | 159 | 1742118 | 10795.01 | 854 | 836 | 161.3 |
| B | 4 | 80 | 106473 | 654.89 | 854 | 836 | 161.3 |
| B | 15 | 33 | 61567 | 376.5 | 854 | 836 | 161.3 |
| C | 0 | 10 | 447149 | 2329.75 | 830 | 841 | 191.6 |
| C | 3 | 233 | 206000 | 1070.94 | 830 | 841 | 191.6 |
| C | 14 | 238 | 135324 | 702.01 | 830 | 841 | 191.6 |
| D | 8 | 195 | 610810 | 3023.75 | 851 | 829 | 201.7 |
| D | 1 | 52 | 93617 | 459.96 | 851 | 829 | 201.7 |
| D | 13 | 249 | 53638 | 261.78 | 851 | 829 | 201.7 |
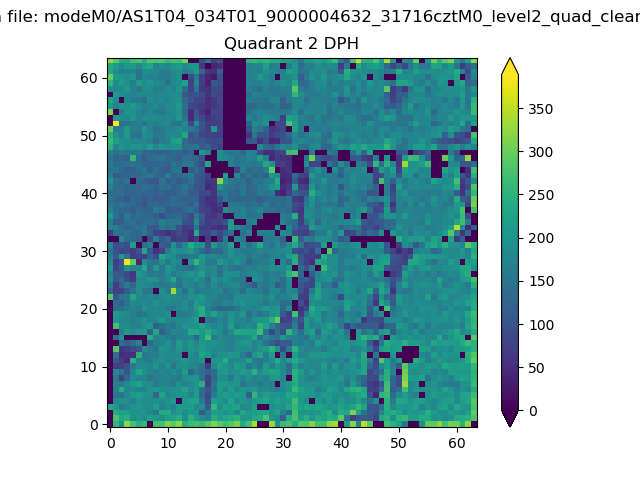
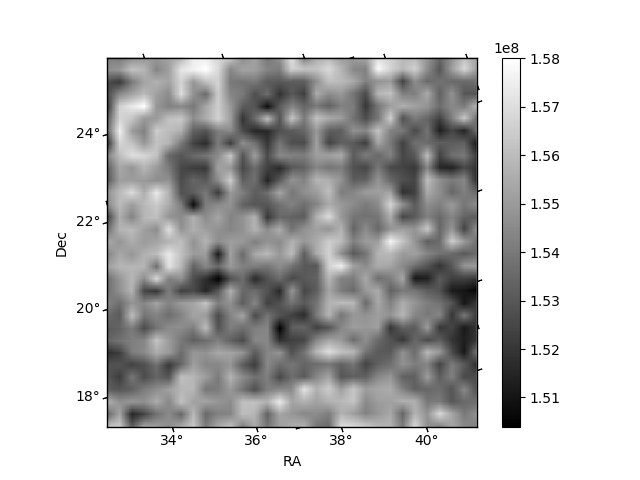
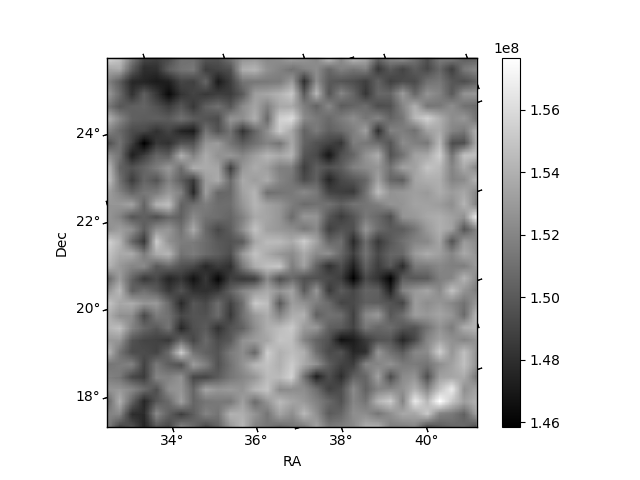
Histogram calculated using DETX and DETY for each event in the final _common_clean file
| Quadrant A | 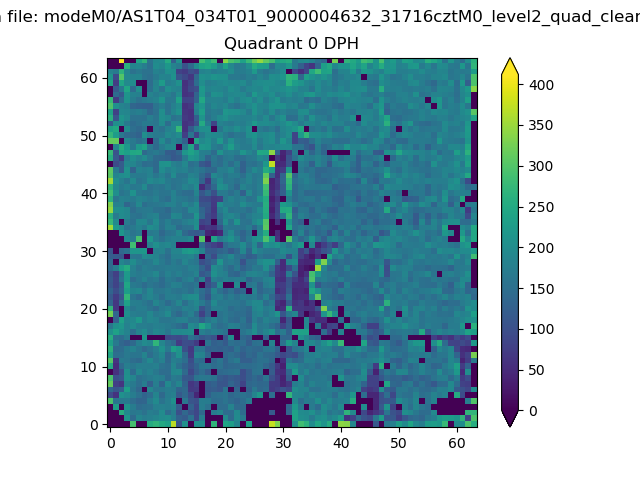 |
 |
Quadrant B |
|---|---|---|---|
| Quadrant D | 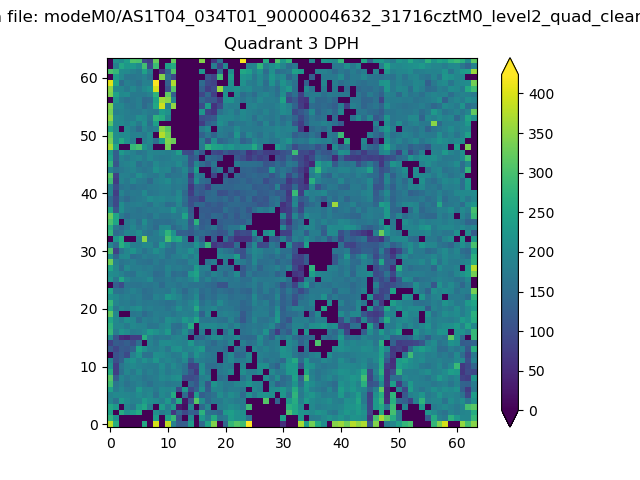 |
 |
Quadrant C |
| Plot type | Count rate plots | Images |
|---|---|---|
| Comparison with Poisson distribution Blue bars denote a histogram of data divided into 1 sec bins. Red curve is a Poisson curve with rate = median count rate of data. |
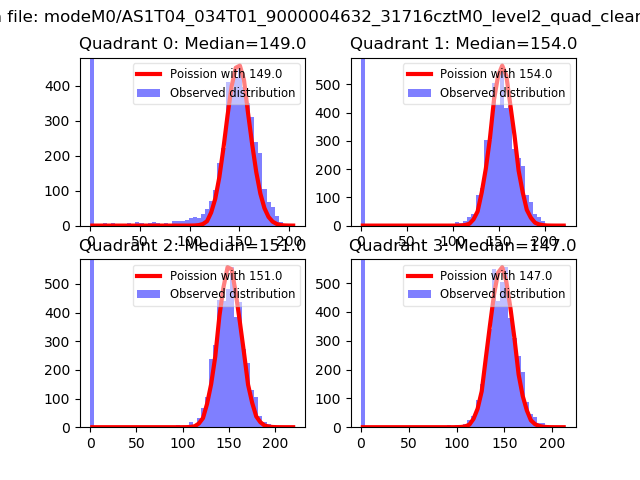 |
 |
| Quadrant-wise count rates Data is divided into 100 sec bins |
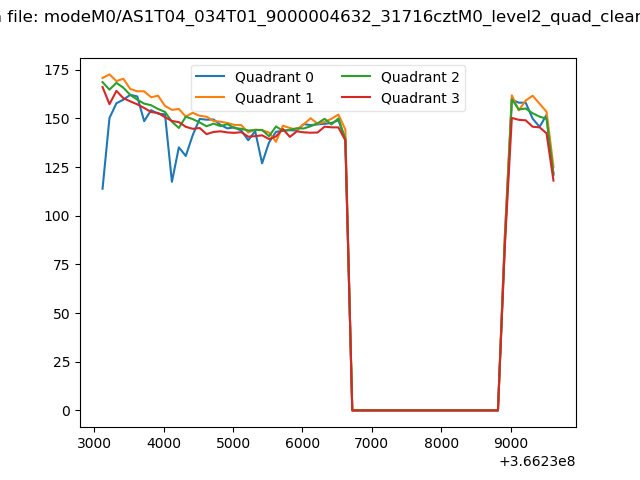 |
|
| Module-wise count rates for Quadrant A Data is divided into 100 sec bins |
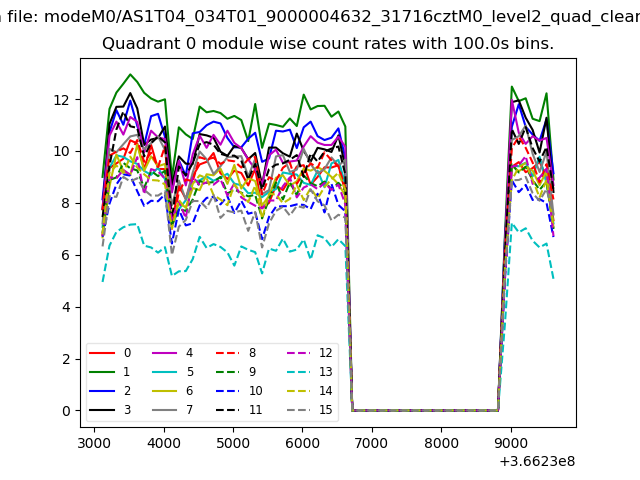 |
 |
| Module-wise count rates for Quadrant B Data is divided into 100 sec bins |
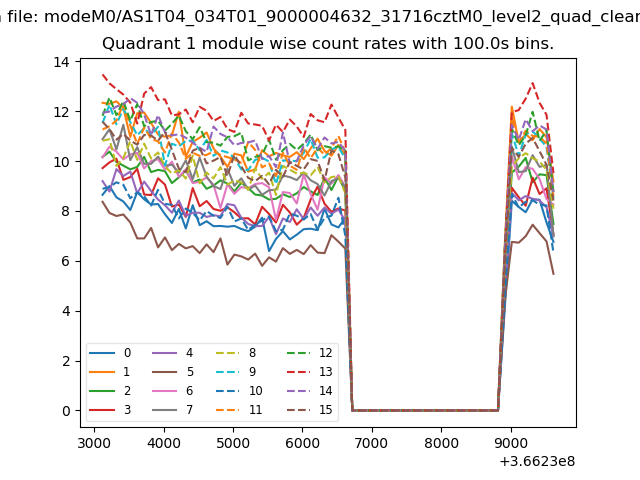 |
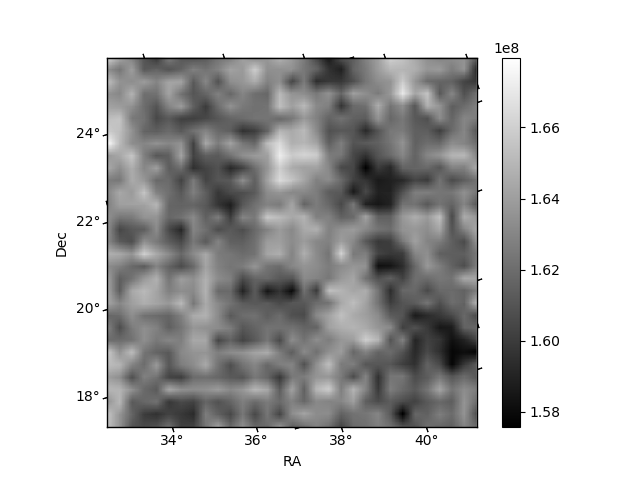 |
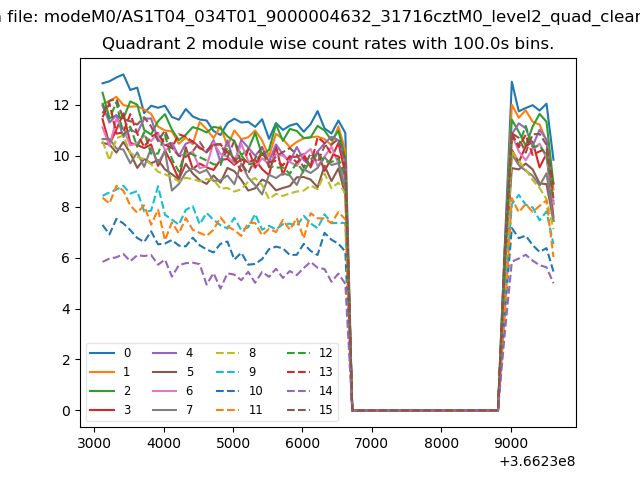
| Module-wise count rates for Quadrant C Data is divided into 100 sec bins |
 |
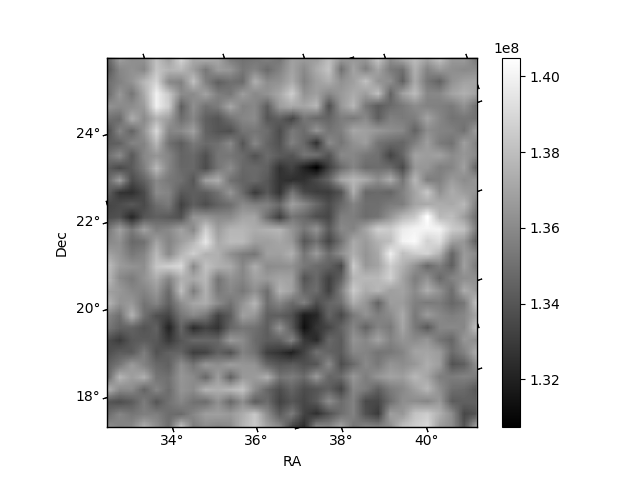 |
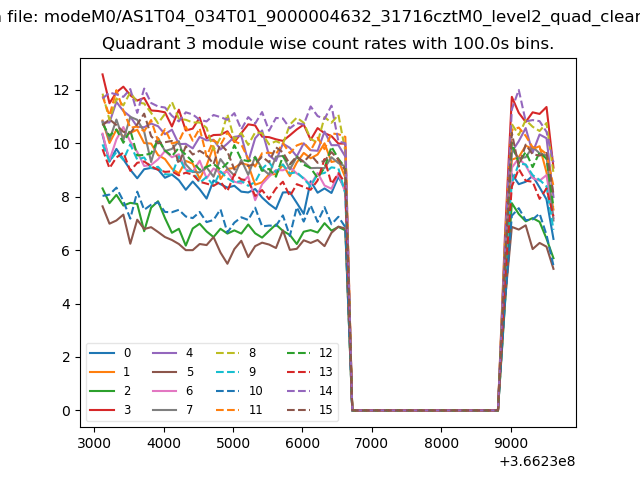
| Module-wise count rates for Quadrant D Data is divided into 100 sec bins |
 |
 |
| Parameter | Plot |
|---|---|
| CZT HV Monitor | 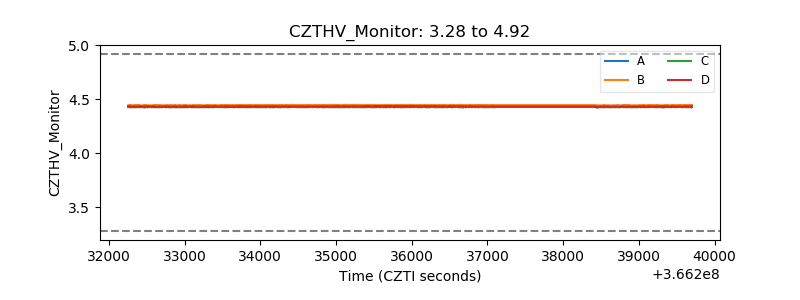 |
| D_VDD | 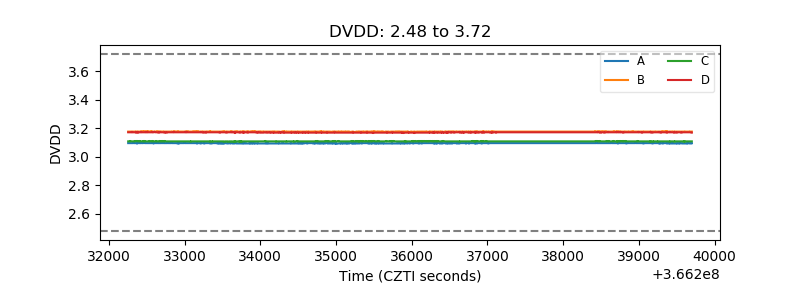 |
| Temperature 1 | 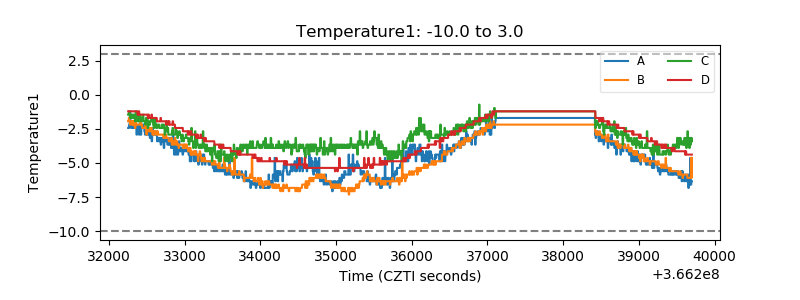 |
| Veto HV Monitor | 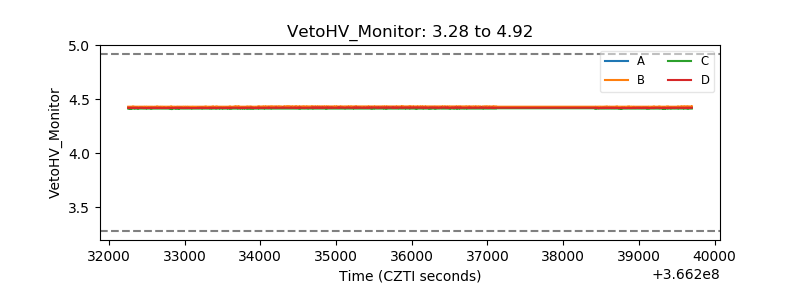 |
| Veto LLD | 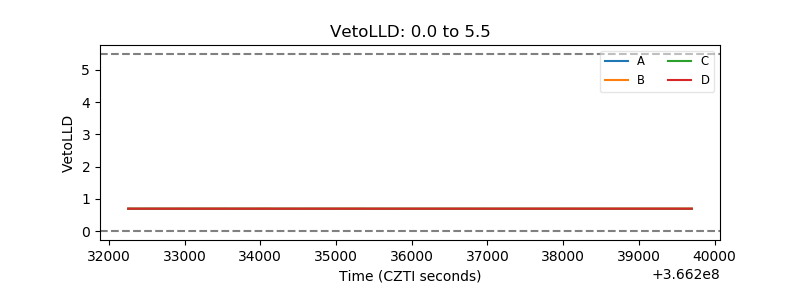 |
| Alpha Counter | 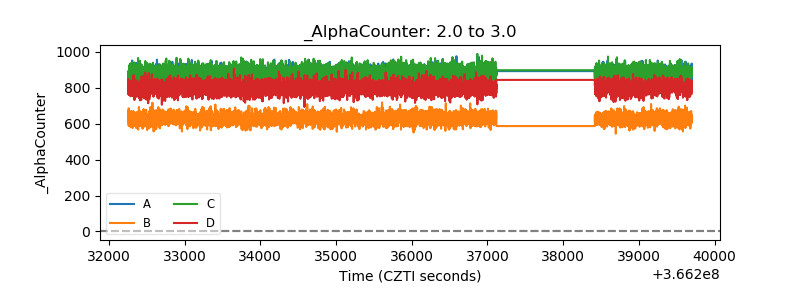 |
| _CPM_Rate | 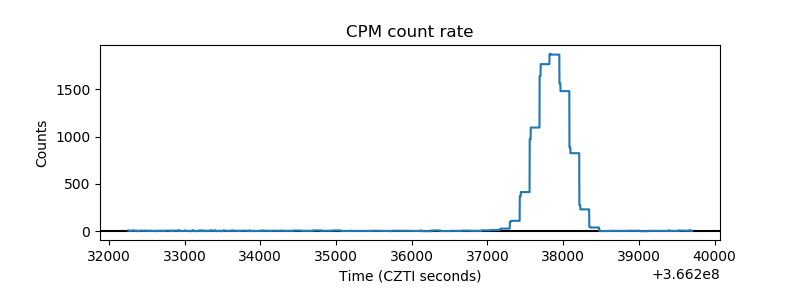 |
| CZT Counter | 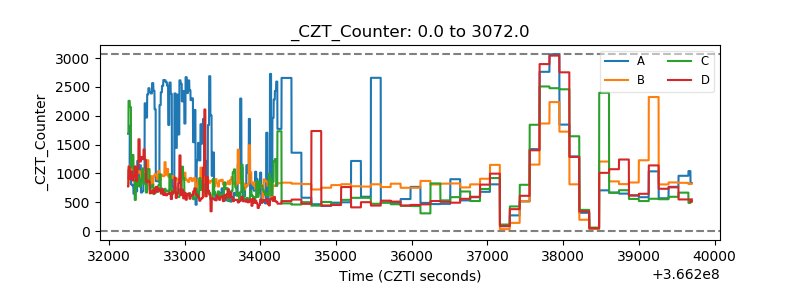 |
| +2.5 Volts monitor |  |
| +5 Volts monitor |  |
| _ROLL_ROT | 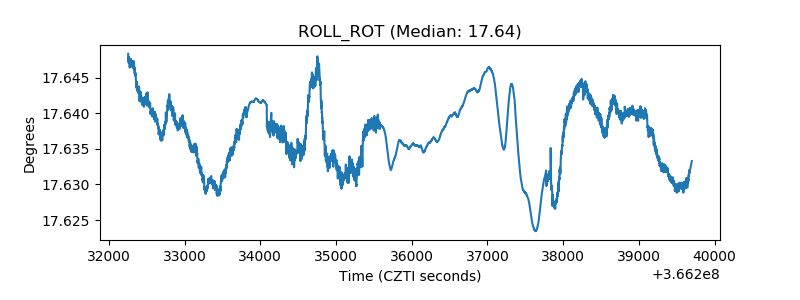 |
| _Roll_DEC | 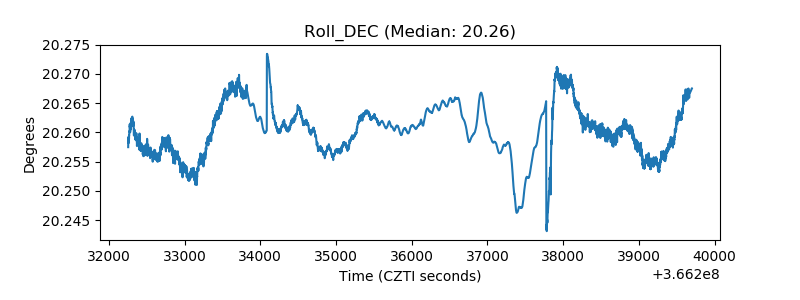 |
| _Roll_RA | 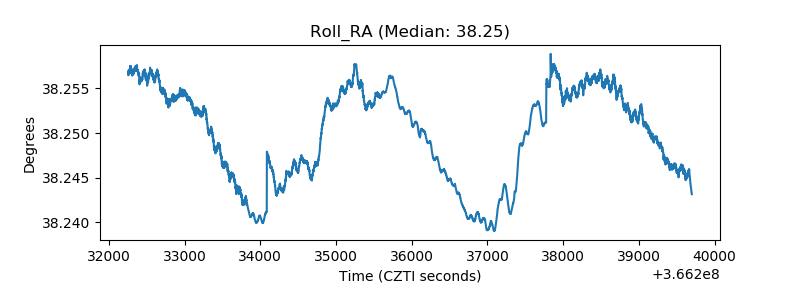 |
| Veto Counter | 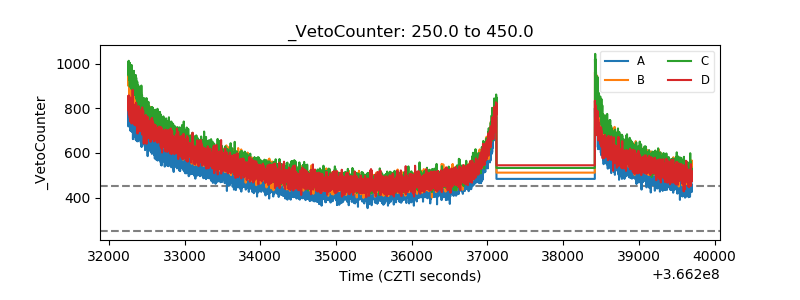 |