| Param | Original file | Final file |
|---|---|---|
| Filename | modeM0/AS1T04_034T01_9000004632_31717cztM0_level2.evt | modeM0/AS1T04_034T01_9000004632_31717cztM0_level2_quad_clean.evt |
| Size (bytes) | 698,362,560 | 103,734,720 |
| Size | 666.0 MB | 98.9 MB |
| Events in quadrant A | 5,918,982 | 647,325 |
| Events in quadrant B | 5,443,043 | 701,654 |
| Events in quadrant C | 5,226,421 | 662,106 |
| Events in quadrant D | 4,115,082 | 669,266 |
| Mode M9 | |||
|---|---|---|---|
| Quadrant | BADHDUFLAG | Total packets | Discarded packets |
| A | 0 | 13 | 0 |
| B | 0 | 14 | 0 |
| C | 0 | 14 | 0 |
| D | 0 | 14 | 0 |
| Mode SS | |||
|---|---|---|---|
| Quadrant | BADHDUFLAG | Total packets | Discarded packets |
| A | 0 | 136 | 0 |
| B | 0 | 136 | 0 |
| C | 0 | 136 | 0 |
| D | 0 | 136 | 0 |
| Mode M0 | |||
|---|---|---|---|
| Quadrant | BADHDUFLAG | Total packets | Discarded packets |
| A | 0 | 22122 | 2 |
| B | 0 | 20725 | 2 |
| C | 0 | 19821 | 2 |
| D | 0 | 16768 | 2 |
| Quadrant | Total seconds | Saturated seconds | Saturation percentage |
|---|---|---|---|
| A | 6605 | 929 | 14.065102% |
| B | 6605 | 181 | 2.740348% |
| C | 6605 | 703 | 10.643452% |
| D | 6605 | 37 | 0.560182% |
Noise dominated data is calculated using 1-second bins in cleaned event files. If a bin has >2000 counts, and if more than 50% of those come from <1% of pixels, then it is considered to be noise-dominated and hence unusable.
| Quadrant | # 1 sec bins | Bins with >0 counts | Bins with >2000 counts | High rate bins dominated by noise | Noise dominated (total time) | Noise dominated (detector-on time) | Marked lightcurve |
|---|---|---|---|---|---|---|---|
| A | 7690 | 6606 | 640 | 640 | 8.32% | 9.69% | 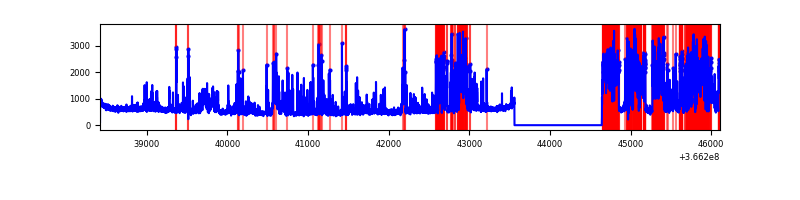 |
| B | 7690 | 6606 | 18 | 18 | 0.23% | 0.27% | 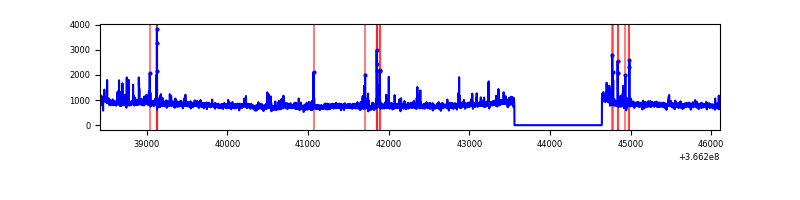 |
| C | 7690 | 6606 | 481 | 481 | 6.25% | 7.28% | 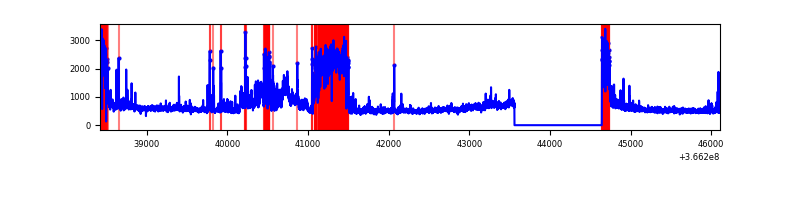 |
| D | 7690 | 6606 | 8 | 8 | 0.10% | 0.12% | 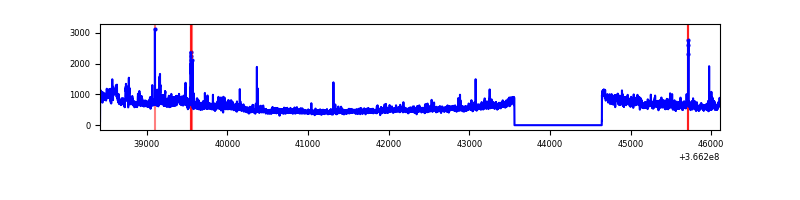 |
Top three noisy pixels from each quadrant. If the there are fewer than three noisy pixels in the level2.evt file, extra rows are filled as -1
| Pixel properties | Quadrant properties | ||||||
|---|---|---|---|---|---|---|---|
| Quadrant | DetID | PixID | Counts | Sigma | Mean | Median | Sigma |
| A | 0 | 13 | 2774444 | 17193.07 | 810 | 795 | 161.3 |
| A | 13 | 254 | 12024 | 69.61 | 810 | 795 | 161.3 |
| A | 14 | 238 | 10001 | 57.07 | 810 | 795 | 161.3 |
| B | 6 | 159 | 1815647 | 11052.38 | 861 | 839 | 164.2 |
| B | 0 | 229 | 95668 | 577.52 | 861 | 839 | 164.2 |
| B | 5 | 172 | 58441 | 350.8 | 861 | 839 | 164.2 |
| C | 10 | 22 | 1237147 | 6611.65 | 803 | 809 | 187.0 |
| C | 0 | 10 | 608472 | 3249.64 | 803 | 809 | 187.0 |
| C | 14 | 238 | 131353 | 698.12 | 803 | 809 | 187.0 |
| D | 8 | 195 | 829531 | 4119.67 | 849 | 827 | 201.2 |
| D | 2 | 234 | 26619 | 128.22 | 849 | 827 | 201.2 |
| D | 13 | 249 | 21913 | 104.82 | 849 | 827 | 201.2 |
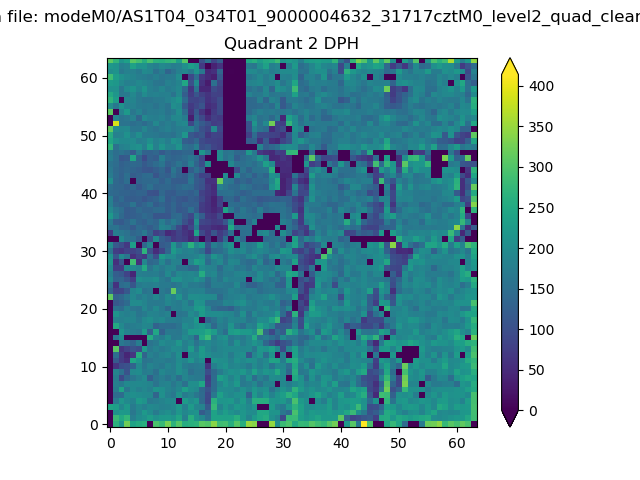
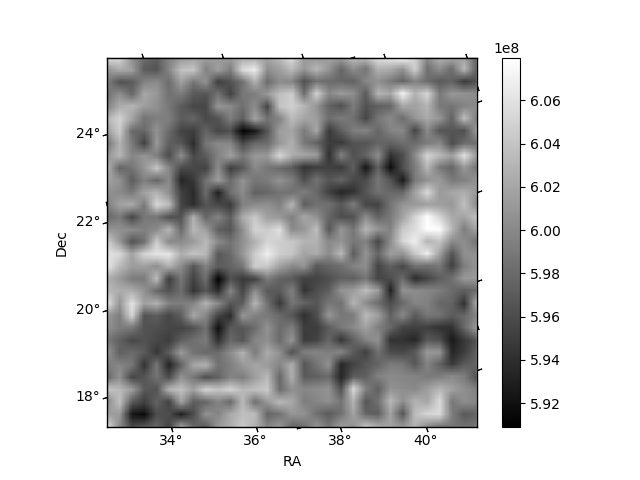
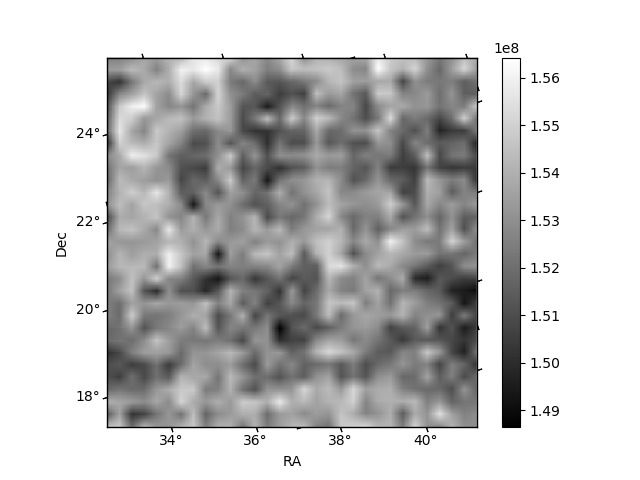
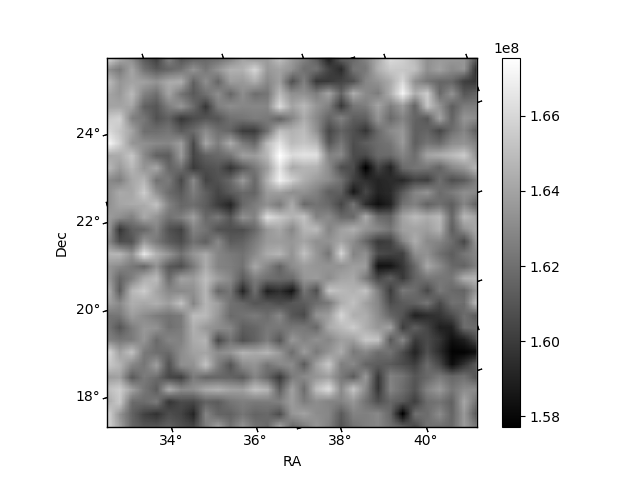
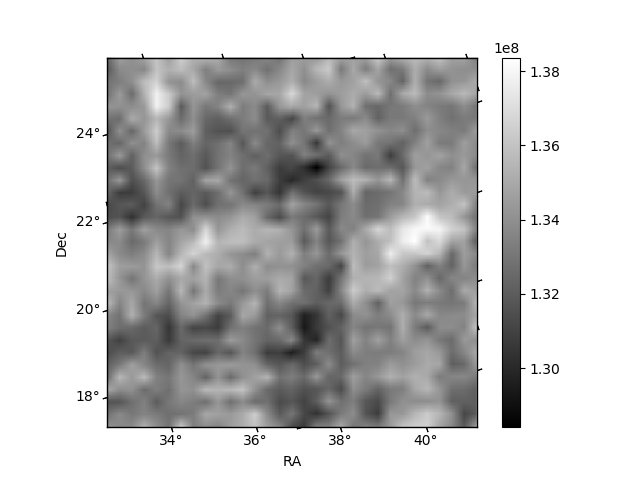
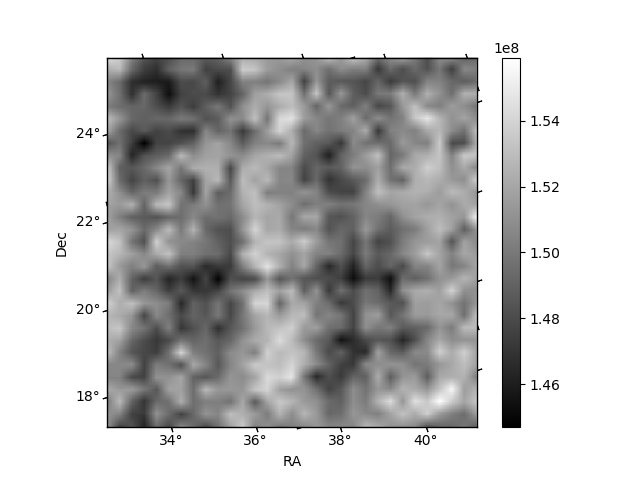
Histogram calculated using DETX and DETY for each event in the final _common_clean file
| Quadrant A | 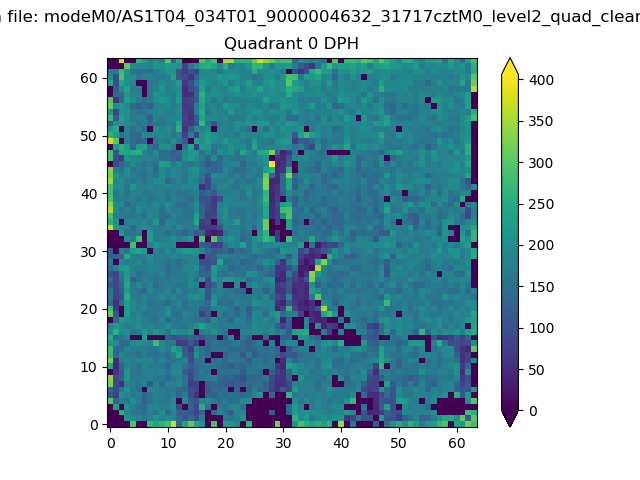 |
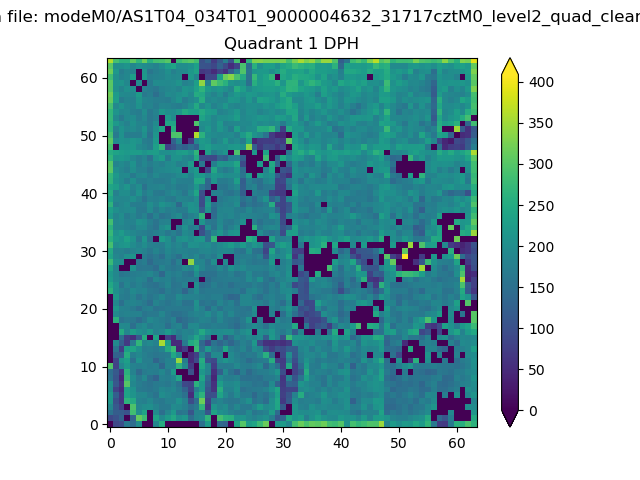 |
Quadrant B |
|---|---|---|---|
| Quadrant D | 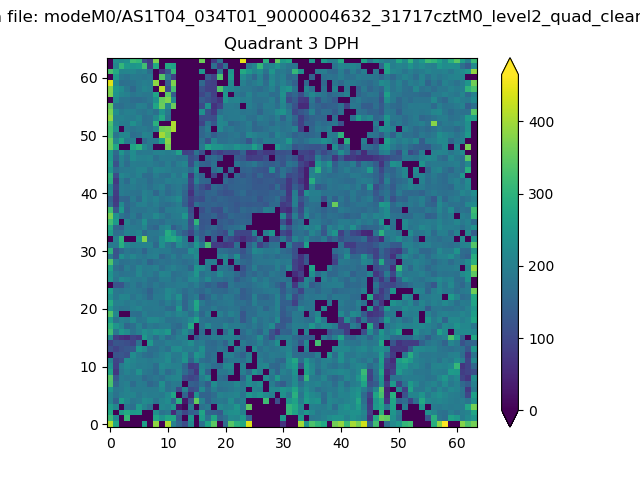 |
 |
Quadrant C |
| Plot type | Count rate plots | Images |
|---|---|---|
| Comparison with Poisson distribution Blue bars denote a histogram of data divided into 1 sec bins. Red curve is a Poisson curve with rate = median count rate of data. |
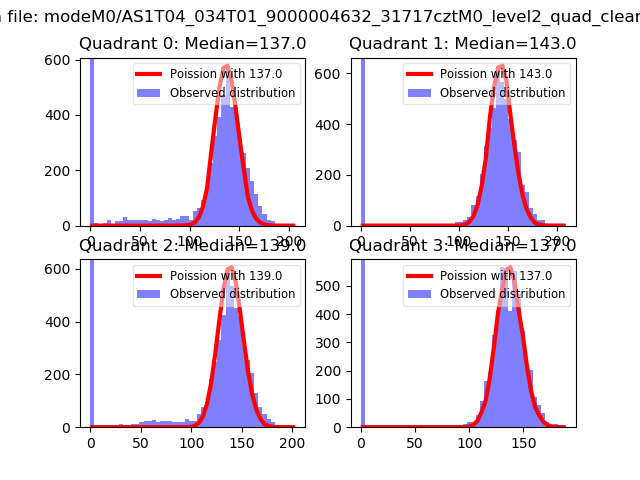 |
 |
| Quadrant-wise count rates Data is divided into 100 sec bins |
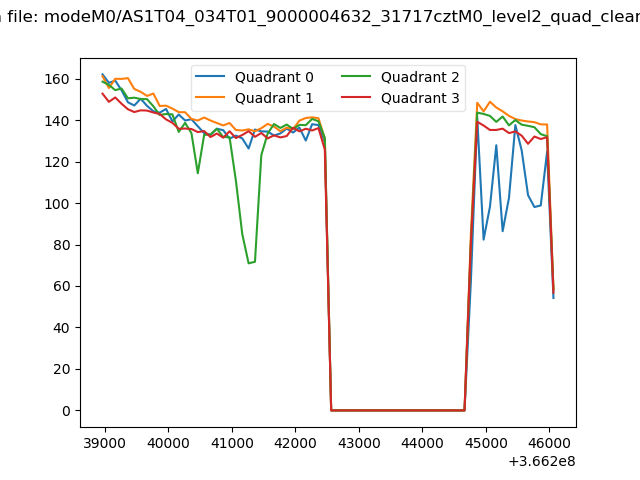 |
|
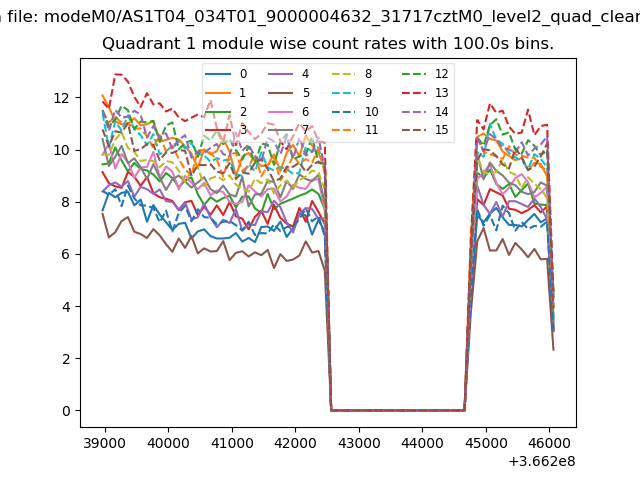
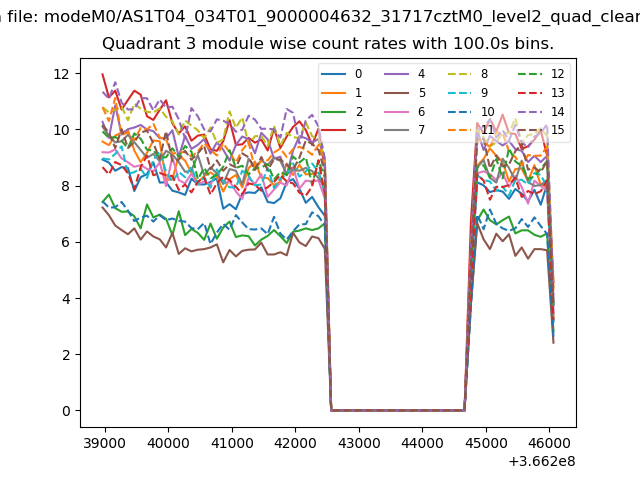
| Module-wise count rates for Quadrant A Data is divided into 100 sec bins |
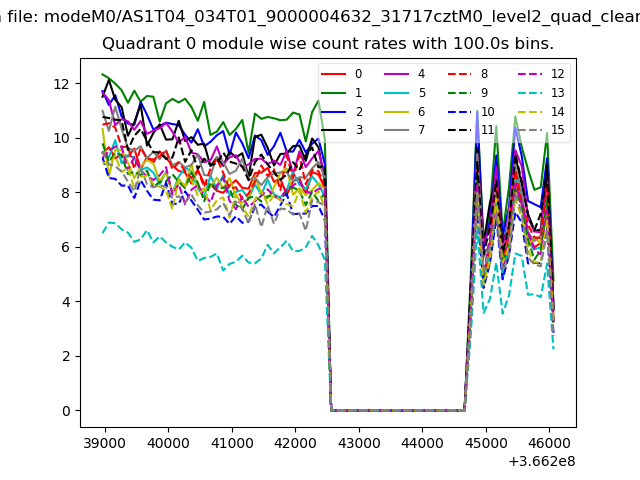 |
 |
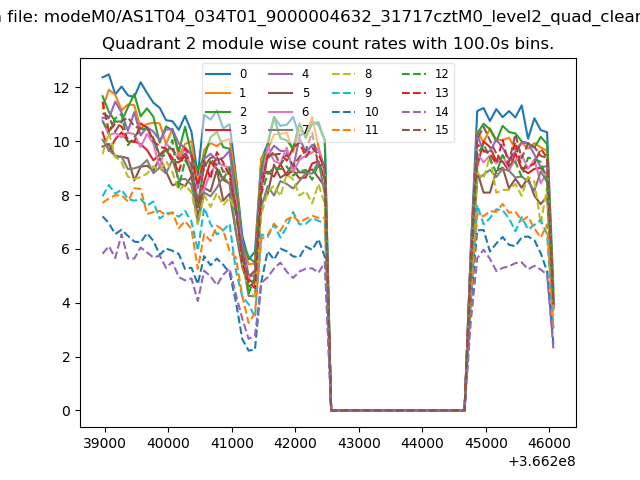
| Module-wise count rates for Quadrant B Data is divided into 100 sec bins |
 |
 |
| Module-wise count rates for Quadrant C Data is divided into 100 sec bins |
 |
 |
| Module-wise count rates for Quadrant D Data is divided into 100 sec bins |
 |
 |
| Parameter | Plot |
|---|---|
| CZT HV Monitor | 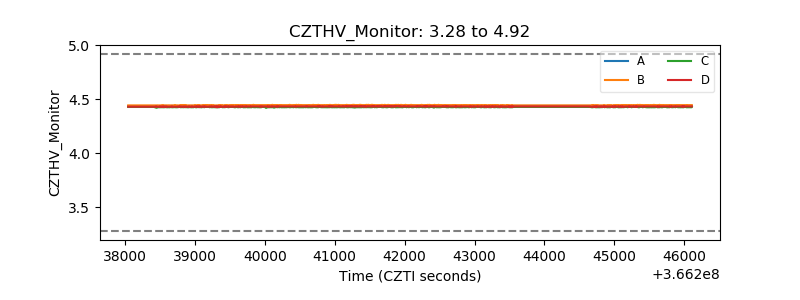 |
| D_VDD | 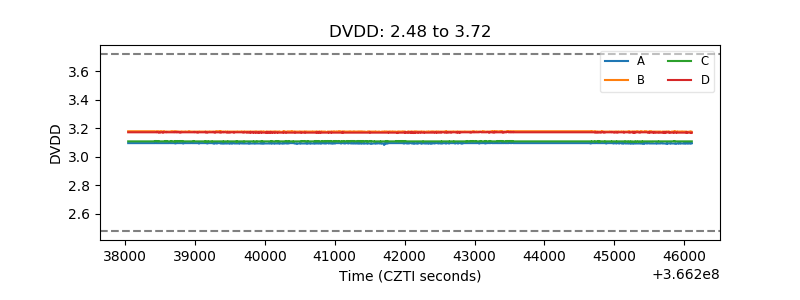 |
| Temperature 1 | 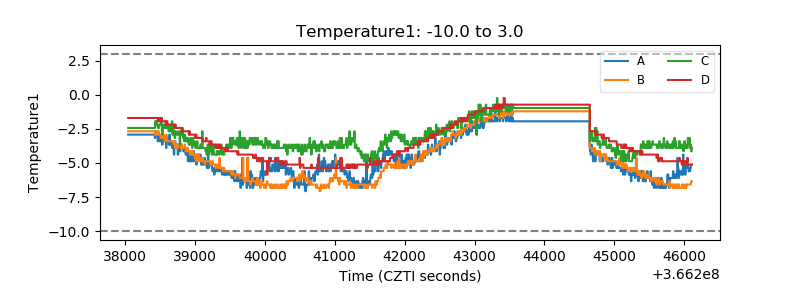 |
| Veto HV Monitor | 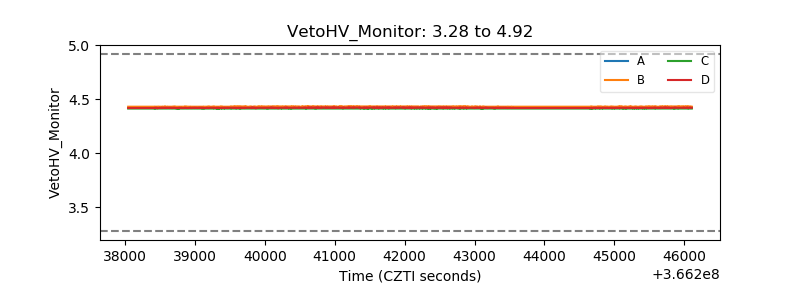 |
| Veto LLD | 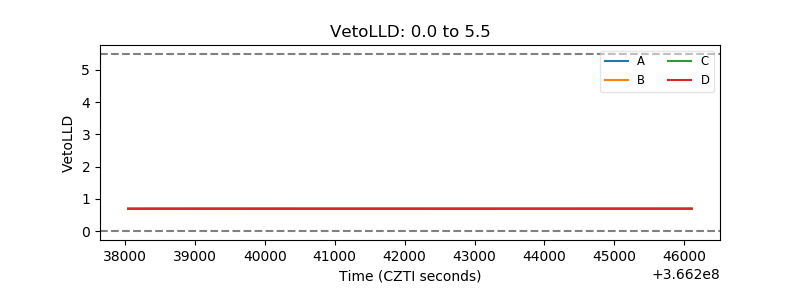 |
| Alpha Counter | 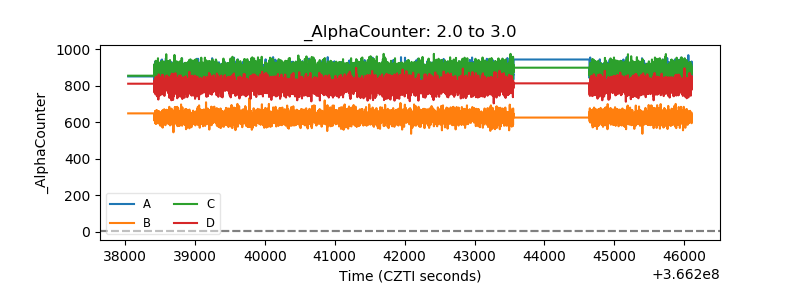 |
| _CPM_Rate | 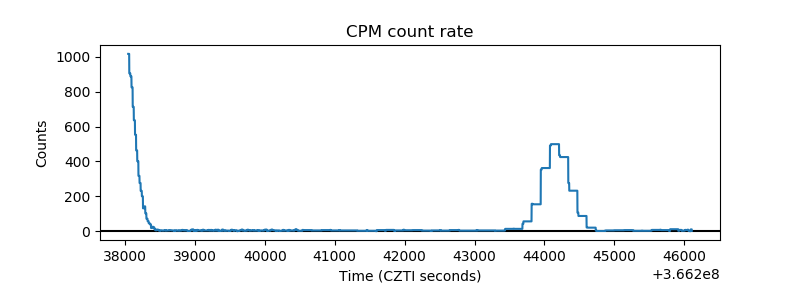 |
| CZT Counter | 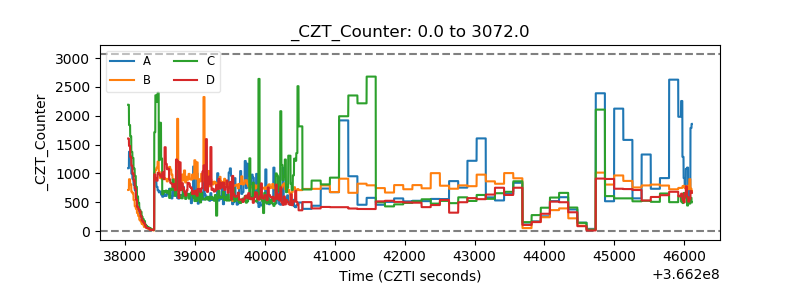 |
| +2.5 Volts monitor |  |
| +5 Volts monitor |  |
| _ROLL_ROT | 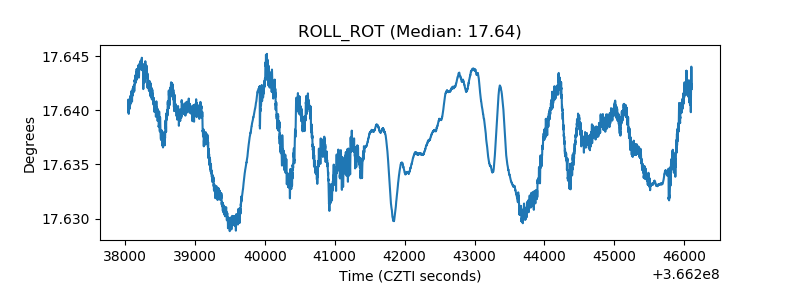 |
| _Roll_DEC | 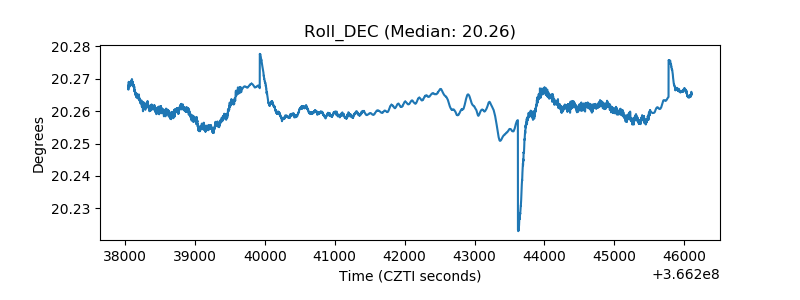 |
| _Roll_RA | 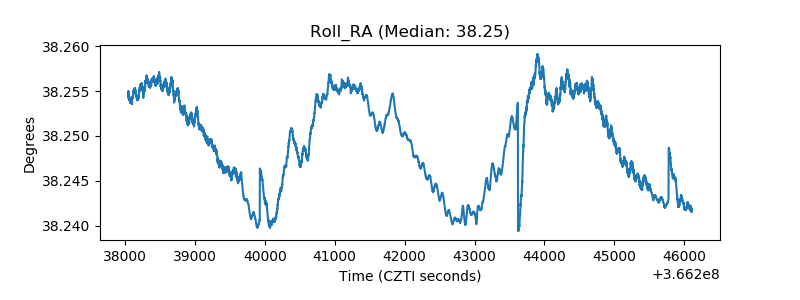 |
| Veto Counter | 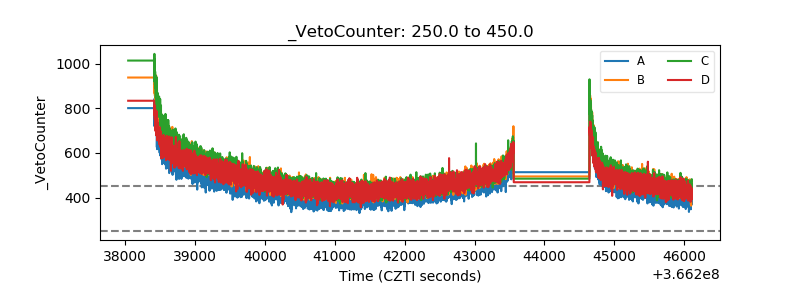 |