| Param | Original file | Final file |
|---|---|---|
| Filename | modeM0/AS1T04_034T01_9000004632_31718cztM0_level2.evt | modeM0/AS1T04_034T01_9000004632_31718cztM0_level2_quad_clean.evt |
| Size (bytes) | 725,800,320 | 100,238,400 |
| Size | 692.2 MB | 95.6 MB |
| Events in quadrant A | 7,642,573 | 588,848 |
| Events in quadrant B | 5,541,418 | 671,552 |
| Events in quadrant C | 4,155,023 | 647,755 |
| Events in quadrant D | 4,170,577 | 640,978 |
| Mode M9 | |||
|---|---|---|---|
| Quadrant | BADHDUFLAG | Total packets | Discarded packets |
| A | 0 | 17 | 0 |
| B | 0 | 17 | 0 |
| C | 0 | 17 | 0 |
| D | 0 | 17 | 0 |
| Mode SS | |||
|---|---|---|---|
| Quadrant | BADHDUFLAG | Total packets | Discarded packets |
| A | 0 | 144 | 0 |
| B | 0 | 144 | 0 |
| C | 0 | 144 | 0 |
| D | 0 | 144 | 0 |
| Mode M0 | |||
|---|---|---|---|
| Quadrant | BADHDUFLAG | Total packets | Discarded packets |
| A | 0 | 27381 | 2 |
| B | 0 | 21563 | 2 |
| C | 0 | 16629 | 2 |
| D | 0 | 17117 | 2 |
| Quadrant | Total seconds | Saturated seconds | Saturation percentage |
|---|---|---|---|
| A | 6975 | 1721 | 24.673835% |
| B | 6975 | 221 | 3.168459% |
| C | 6975 | 332 | 4.759857% |
| D | 6974 | 84 | 1.204474% |
Noise dominated data is calculated using 1-second bins in cleaned event files. If a bin has >2000 counts, and if more than 50% of those come from <1% of pixels, then it is considered to be noise-dominated and hence unusable.
| Quadrant | # 1 sec bins | Bins with >0 counts | Bins with >2000 counts | High rate bins dominated by noise | Noise dominated (total time) | Noise dominated (detector-on time) | Marked lightcurve |
|---|---|---|---|---|---|---|---|
| A | 8750 | 6977 | 1158 | 1158 | 13.23% | 16.60% | 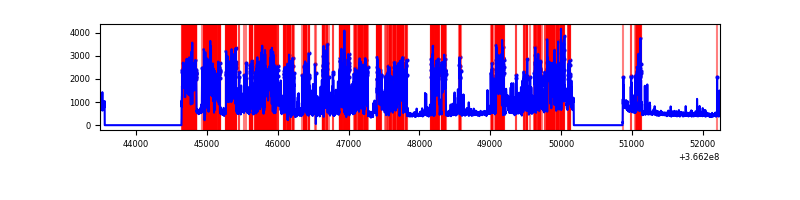 |
| B | 8750 | 6977 | 15 | 15 | 0.17% | 0.21% | 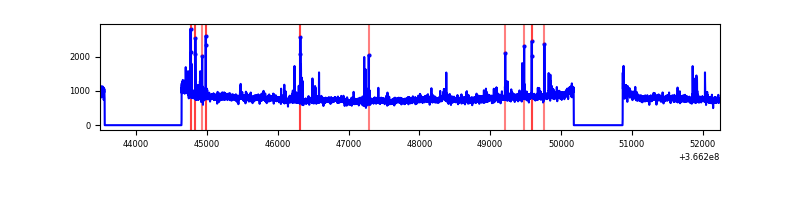 |
| C | 8750 | 6977 | 129 | 129 | 1.47% | 1.85% |  |
| D | 8749 | 6976 | 31 | 31 | 0.35% | 0.44% | 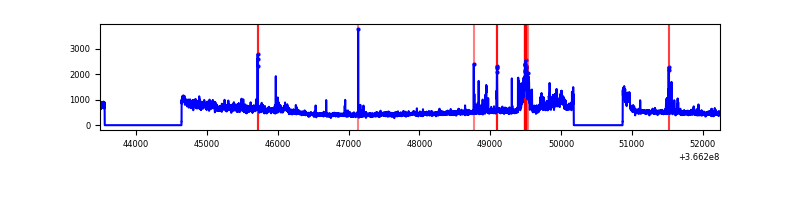 |
Top three noisy pixels from each quadrant. If the there are fewer than three noisy pixels in the level2.evt file, extra rows are filled as -1
| Pixel properties | Quadrant properties | ||||||
|---|---|---|---|---|---|---|---|
| Quadrant | DetID | PixID | Counts | Sigma | Mean | Median | Sigma |
| A | 0 | 13 | 4600728 | 29264.14 | 782 | 767 | 157.2 |
| A | 12 | 96 | 16302 | 98.83 | 782 | 767 | 157.2 |
| A | 13 | 254 | 11642 | 69.18 | 782 | 767 | 157.2 |
| B | 6 | 159 | 1913389 | 11339.27 | 879 | 856 | 168.7 |
| B | 0 | 229 | 77988 | 457.31 | 879 | 856 | 168.7 |
| B | 5 | 172 | 35356 | 204.55 | 879 | 856 | 168.7 |
| C | 0 | 10 | 546363 | 2781.48 | 837 | 846 | 196.1 |
| C | 14 | 238 | 134877 | 683.4 | 837 | 846 | 196.1 |
| C | 10 | 22 | 110334 | 558.26 | 837 | 846 | 196.1 |
| D | 8 | 195 | 545143 | 2642.53 | 861 | 839 | 206.0 |
| D | 12 | 227 | 271221 | 1312.67 | 861 | 839 | 206.0 |
| D | 2 | 250 | 64302 | 308.1 | 861 | 839 | 206.0 |
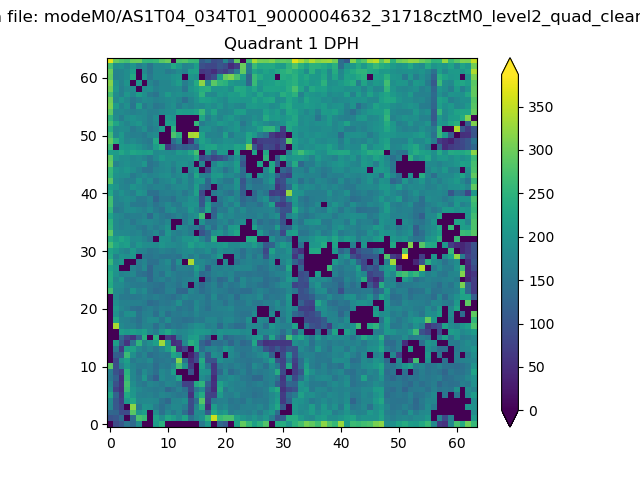
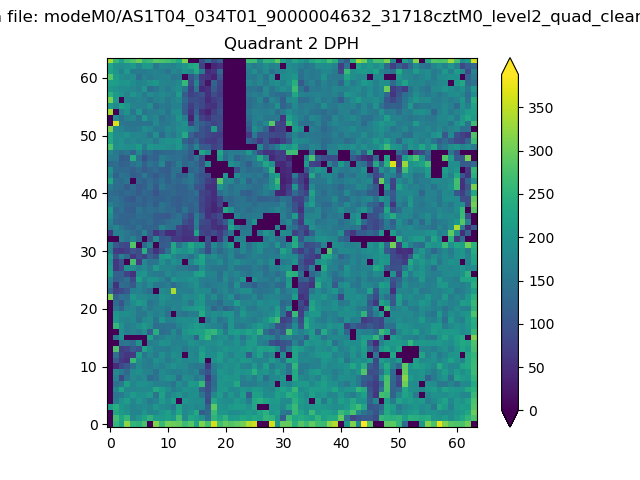
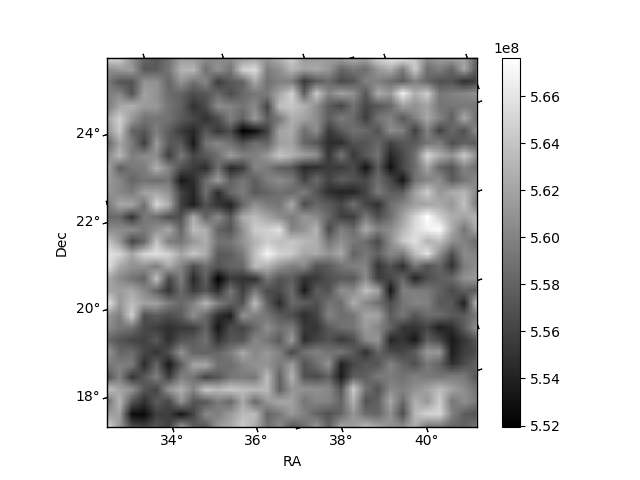
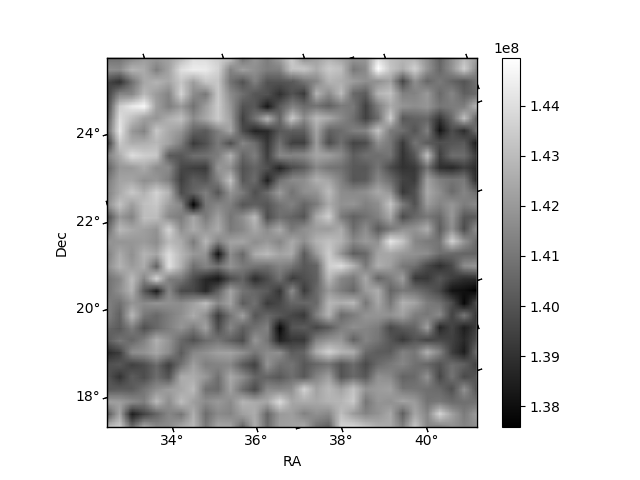
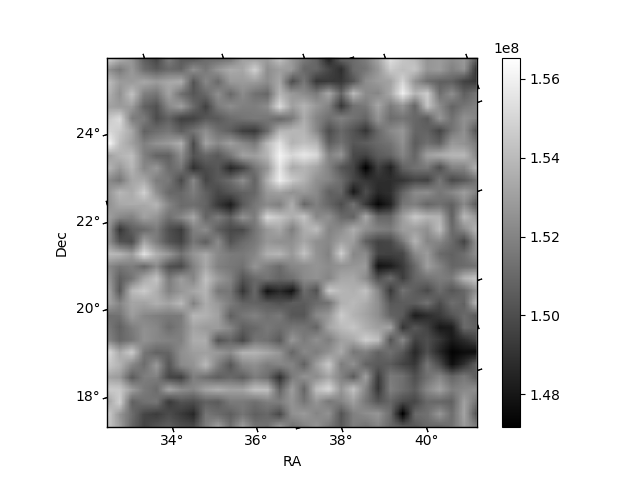
Histogram calculated using DETX and DETY for each event in the final _common_clean file
| Quadrant A | 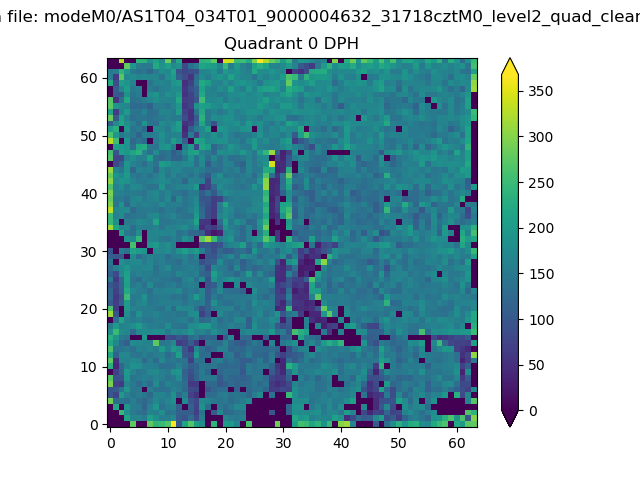 |
 |
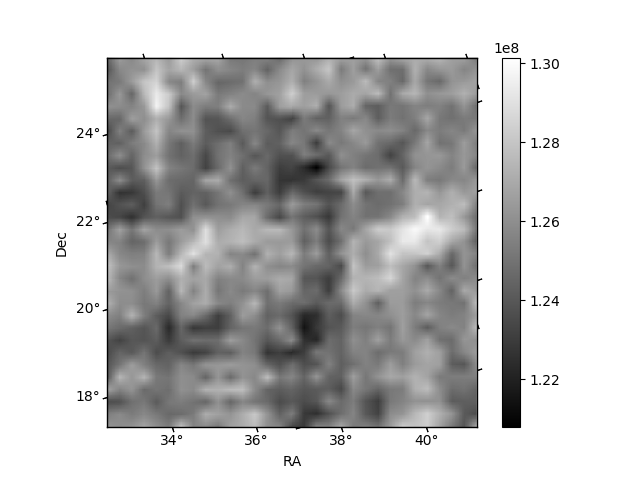
Quadrant B |
|---|---|---|---|
| Quadrant D | 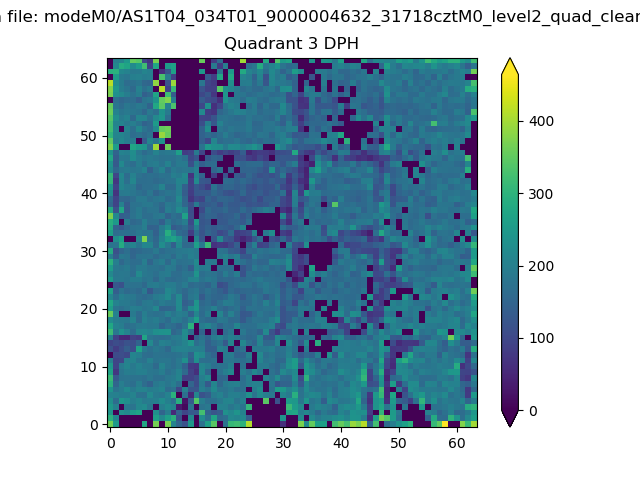 |
 |
Quadrant C |
| Plot type | Count rate plots | Images |
|---|---|---|
| Comparison with Poisson distribution Blue bars denote a histogram of data divided into 1 sec bins. Red curve is a Poisson curve with rate = median count rate of data. |
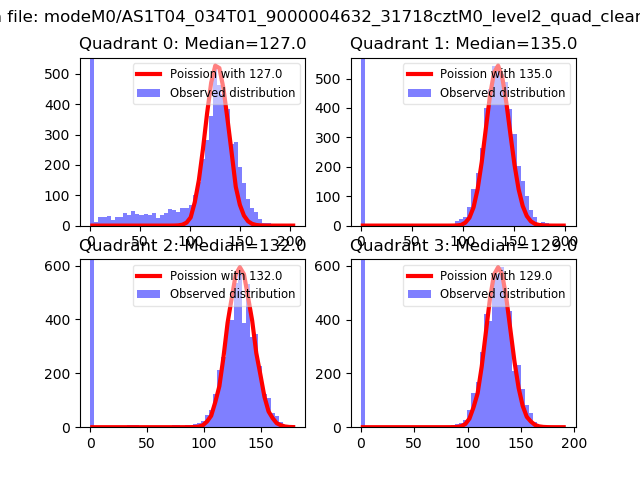 |
 |
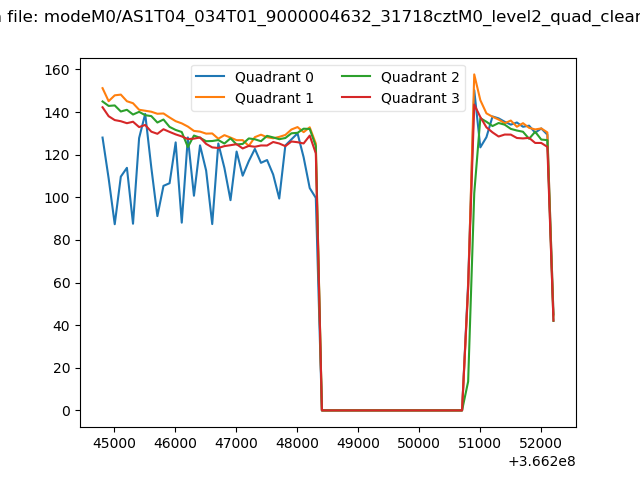
| Quadrant-wise count rates Data is divided into 100 sec bins |
 |
|
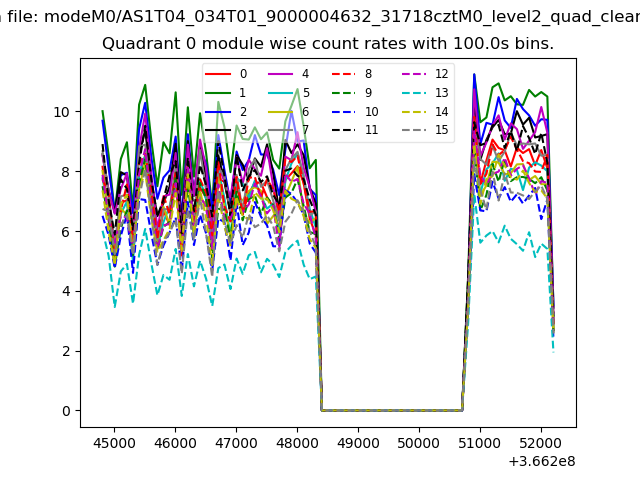
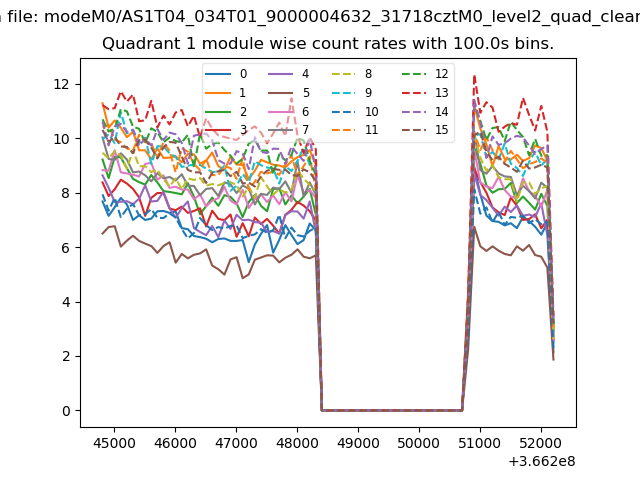
| Module-wise count rates for Quadrant A Data is divided into 100 sec bins |
 |
 |
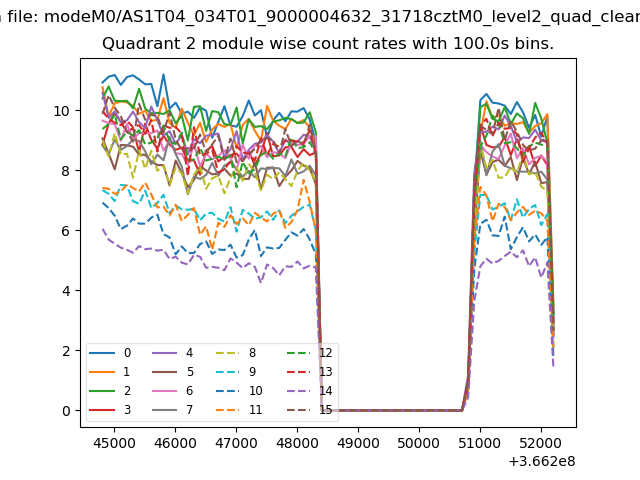
| Module-wise count rates for Quadrant B Data is divided into 100 sec bins |
 |
 |
| Module-wise count rates for Quadrant C Data is divided into 100 sec bins |
 |
 |
| Module-wise count rates for Quadrant D Data is divided into 100 sec bins |
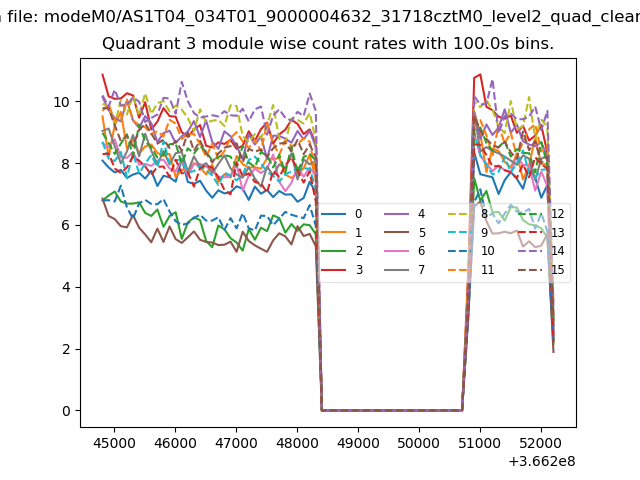 |
 |
| Parameter | Plot |
|---|---|
| CZT HV Monitor | 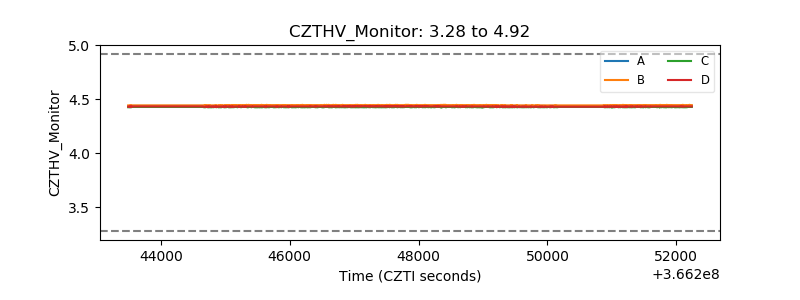 |
| D_VDD | 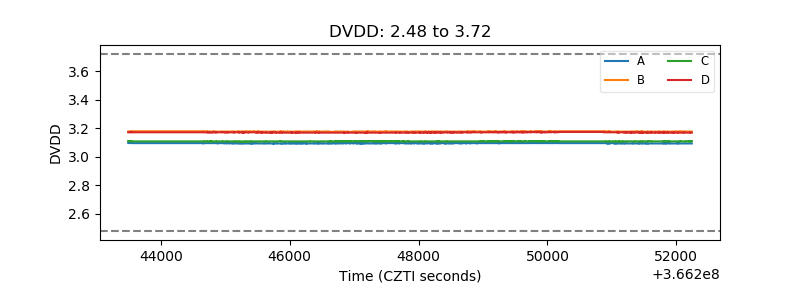 |
| Temperature 1 | 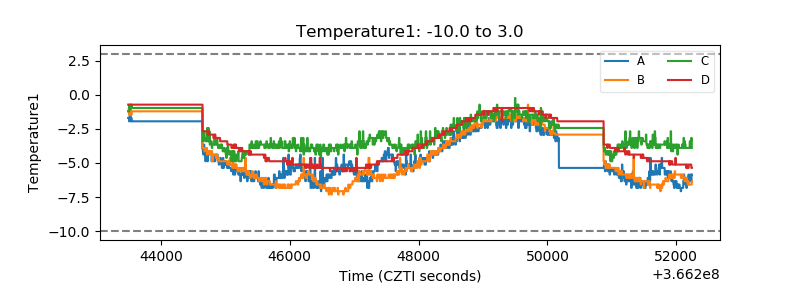 |
| Veto HV Monitor | 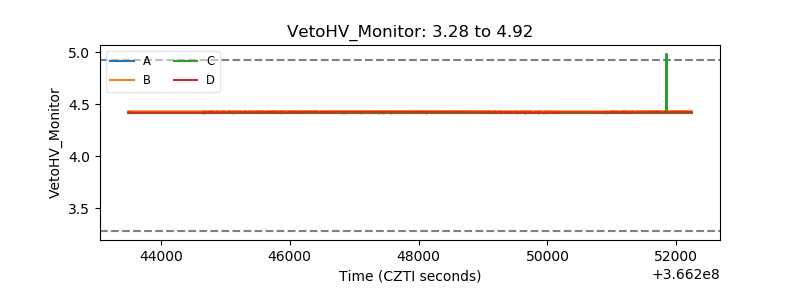 |
| Veto LLD | 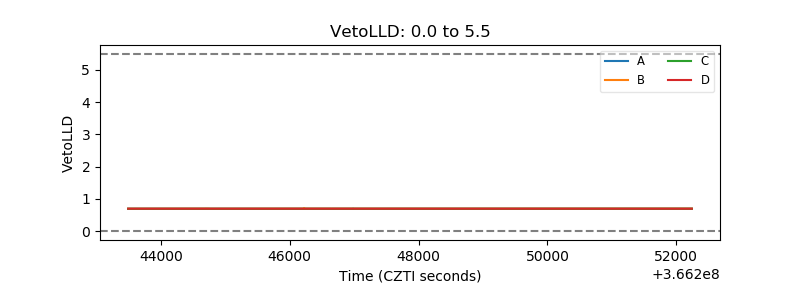 |
| Alpha Counter | 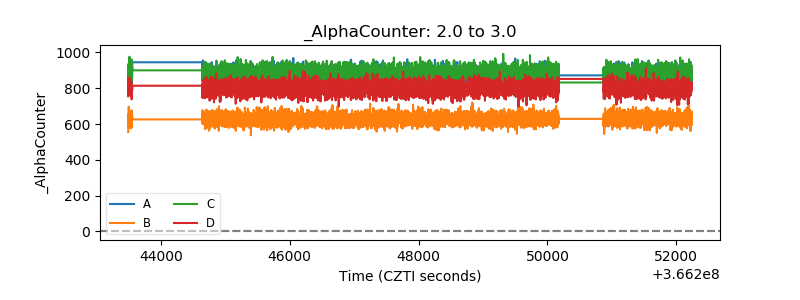 |
| _CPM_Rate | 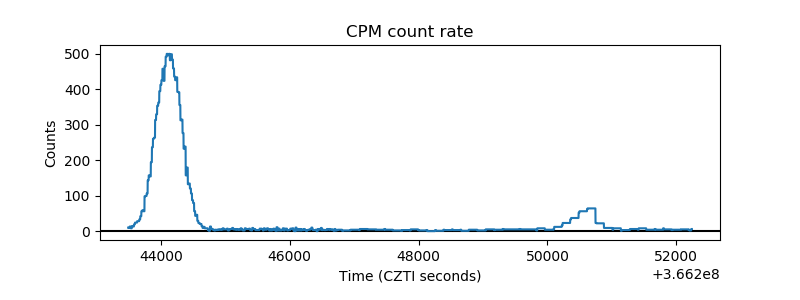 |
| CZT Counter | 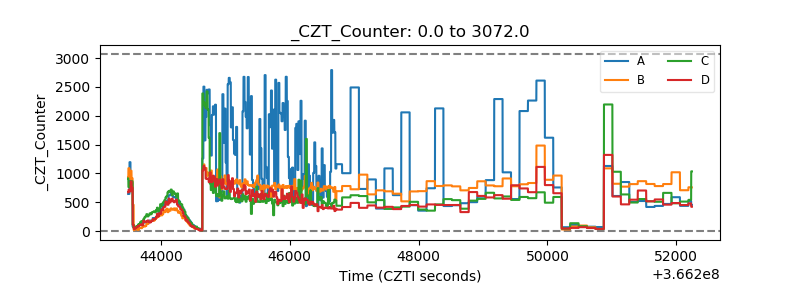 |
| +2.5 Volts monitor |  |
| +5 Volts monitor |  |
| _ROLL_ROT | 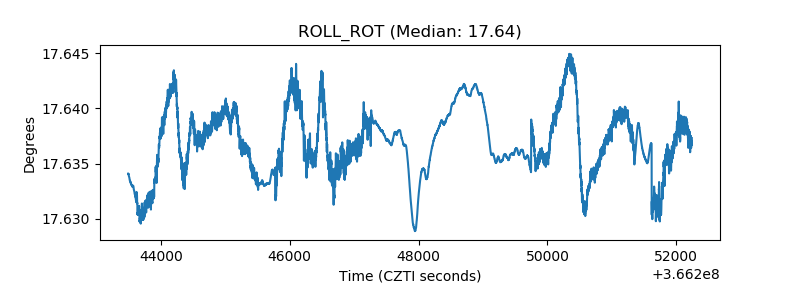 |
| _Roll_DEC | 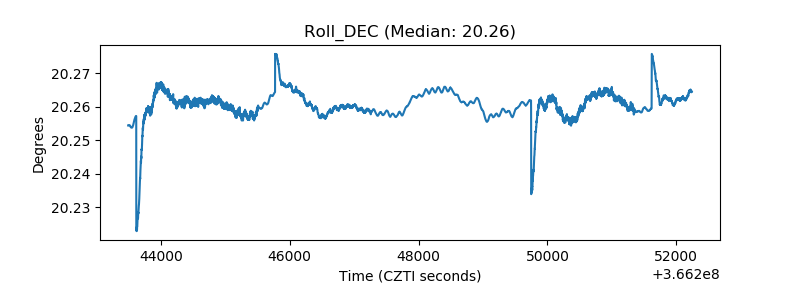 |
| _Roll_RA | 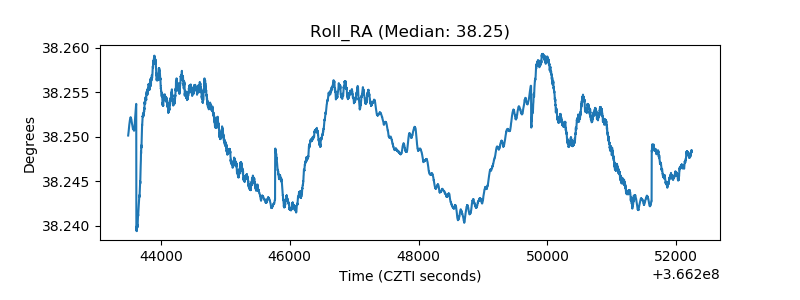 |
| Veto Counter | 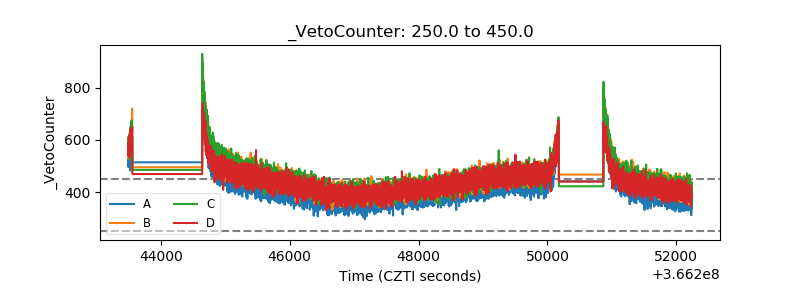 |