| Param | Original file | Final file |
|---|---|---|
| Filename | modeM0/AS1T04_034T01_9000004632_31719cztM0_level2.evt | modeM0/AS1T04_034T01_9000004632_31719cztM0_level2_quad_clean.evt |
| Size (bytes) | 734,745,600 | 105,295,680 |
| Size | 700.7 MB | 100.4 MB |
| Events in quadrant A | 4,814,242 | 671,931 |
| Events in quadrant B | 7,212,249 | 666,472 |
| Events in quadrant C | 4,745,141 | 661,605 |
| Events in quadrant D | 4,968,150 | 661,043 |
| Mode M9 | |||
|---|---|---|---|
| Quadrant | BADHDUFLAG | Total packets | Discarded packets |
| A | 0 | 8 | 0 |
| B | 0 | 8 | 0 |
| C | 0 | 8 | 0 |
| D | 0 | 8 | 0 |
| Mode SS | |||
|---|---|---|---|
| Quadrant | BADHDUFLAG | Total packets | Discarded packets |
| A | 0 | 158 | 0 |
| B | 0 | 158 | 0 |
| C | 0 | 158 | 0 |
| D | 0 | 158 | 0 |
| Mode M0 | |||
|---|---|---|---|
| Quadrant | BADHDUFLAG | Total packets | Discarded packets |
| A | 0 | 19271 | 3 |
| B | 0 | 26916 | 3 |
| C | 0 | 19088 | 3 |
| D | 0 | 19867 | 3 |
| Quadrant | Total seconds | Saturated seconds | Saturation percentage |
|---|---|---|---|
| A | 7570 | 414 | 5.468956% |
| B | 7569 | 952 | 12.577619% |
| C | 7570 | 392 | 5.178336% |
| D | 7570 | 123 | 1.624835% |
Noise dominated data is calculated using 1-second bins in cleaned event files. If a bin has >2000 counts, and if more than 50% of those come from <1% of pixels, then it is considered to be noise-dominated and hence unusable.
| Quadrant | # 1 sec bins | Bins with >0 counts | Bins with >2000 counts | High rate bins dominated by noise | Noise dominated (total time) | Noise dominated (detector-on time) | Marked lightcurve |
|---|---|---|---|---|---|---|---|
| A | 8440 | 7573 | 172 | 172 | 2.04% | 2.27% | 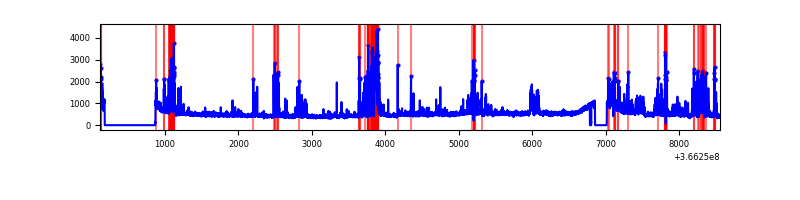 |
| B | 8439 | 7572 | 483 | 483 | 5.72% | 6.38% | 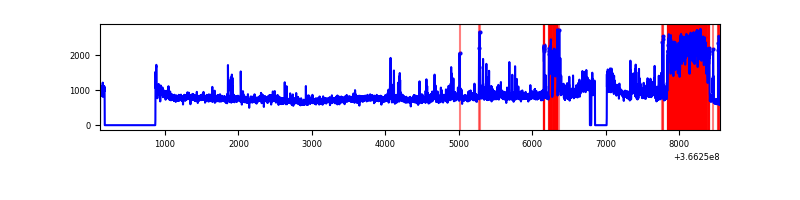 |
| C | 8440 | 7573 | 85 | 85 | 1.01% | 1.12% | 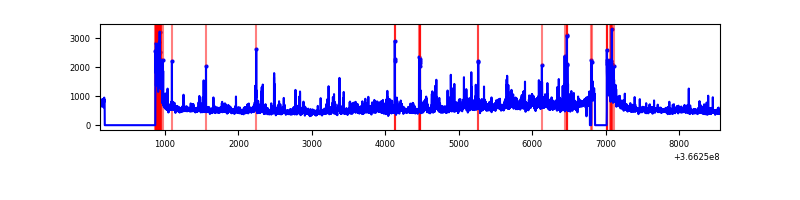 |
| D | 8440 | 7573 | 17 | 17 | 0.20% | 0.22% | 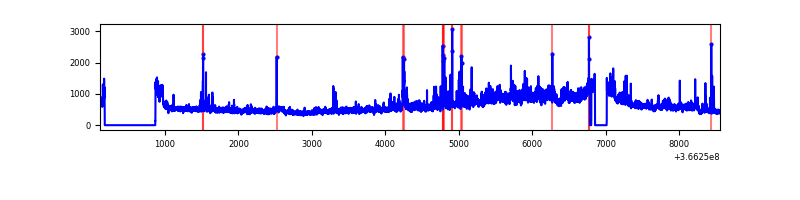 |
Top three noisy pixels from each quadrant. If the there are fewer than three noisy pixels in the level2.evt file, extra rows are filled as -1
| Pixel properties | Quadrant properties | ||||||
|---|---|---|---|---|---|---|---|
| Quadrant | DetID | PixID | Counts | Sigma | Mean | Median | Sigma |
| A | 0 | 13 | 1168456 | 6113.57 | 943 | 922 | 191.0 |
| A | 13 | 254 | 13745 | 67.15 | 943 | 922 | 191.0 |
| A | 3 | 137 | 9739 | 46.17 | 943 | 922 | 191.0 |
| B | 6 | 159 | 2038656 | 11377.38 | 926 | 903 | 179.1 |
| B | 4 | 80 | 1272132 | 7097.65 | 926 | 903 | 179.1 |
| B | 0 | 229 | 117494 | 650.96 | 926 | 903 | 179.1 |
| C | 0 | 10 | 671089 | 3112.5 | 911 | 919 | 215.3 |
| C | 3 | 233 | 237191 | 1097.33 | 911 | 919 | 215.3 |
| C | 14 | 238 | 145865 | 673.18 | 911 | 919 | 215.3 |
| D | 8 | 195 | 1233696 | 5513.5 | 932 | 908 | 223.6 |
| D | 12 | 233 | 123097 | 546.48 | 932 | 908 | 223.6 |
| D | 2 | 250 | 59481 | 261.96 | 932 | 908 | 223.6 |
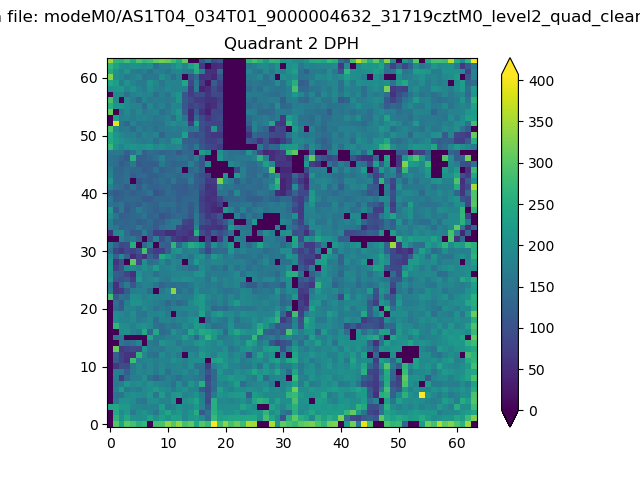
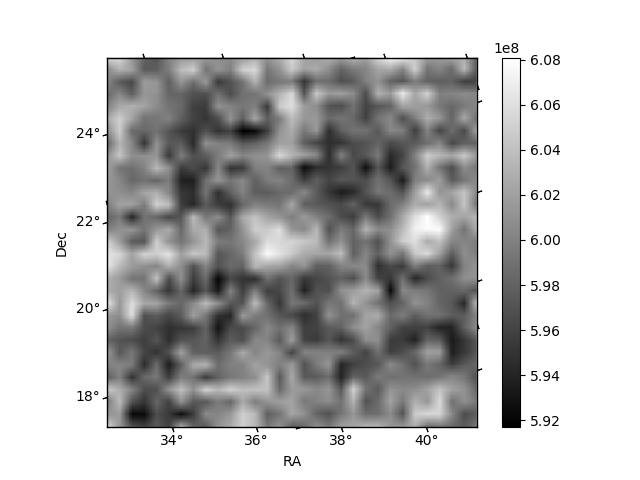
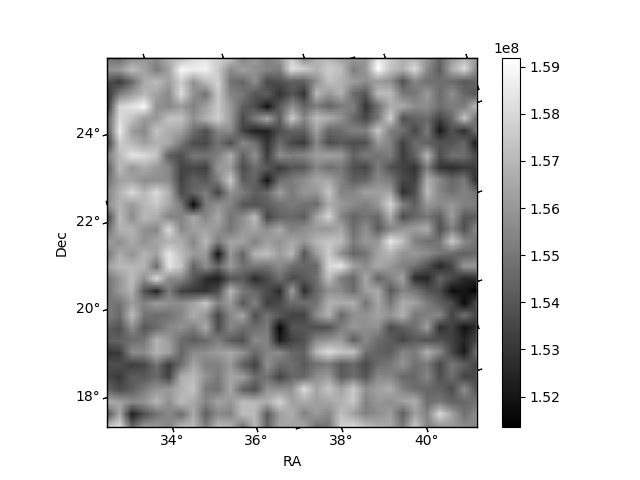
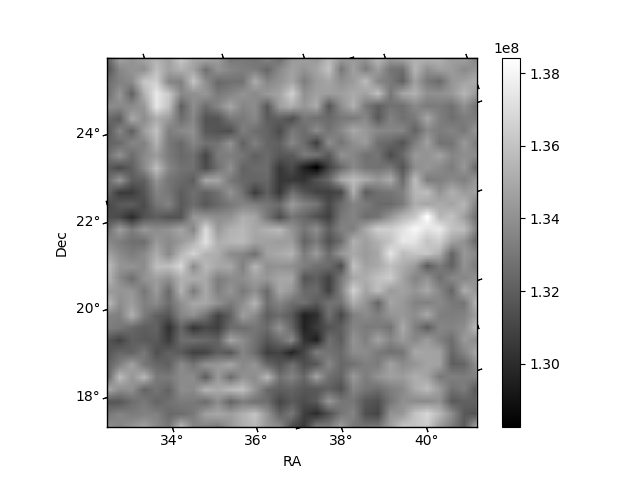
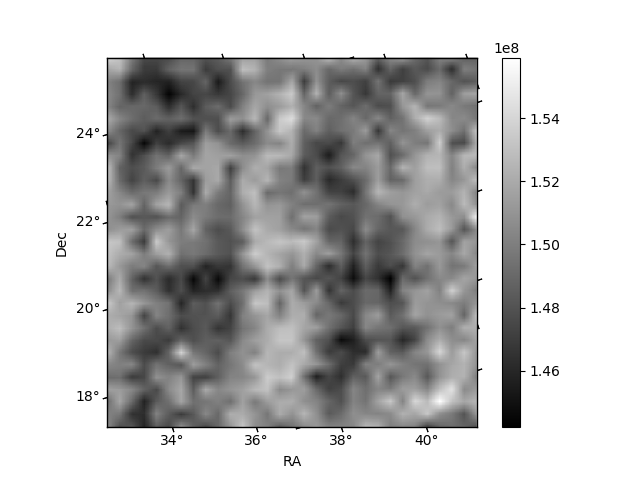
Histogram calculated using DETX and DETY for each event in the final _common_clean file
| Quadrant A | 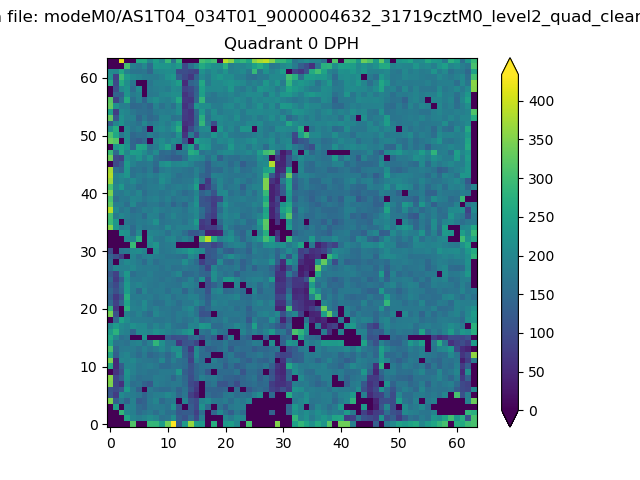 |
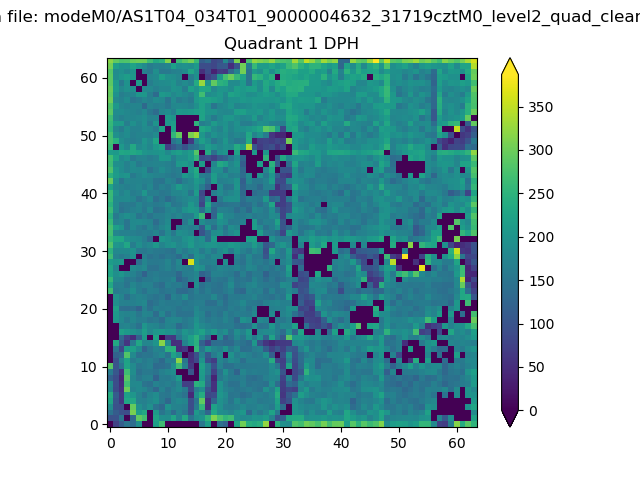 |
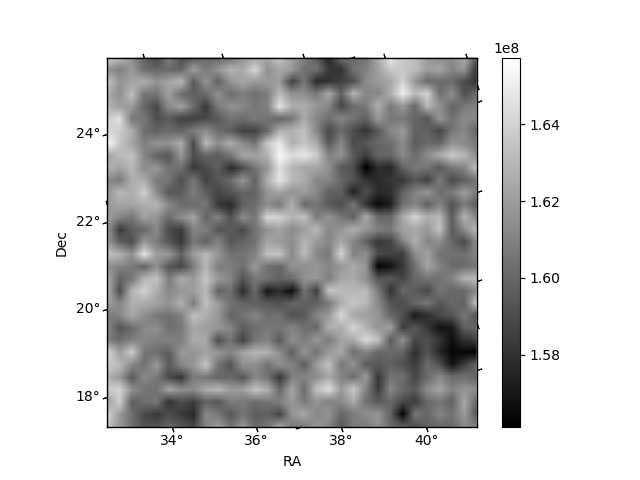
Quadrant B |
|---|---|---|---|
| Quadrant D | 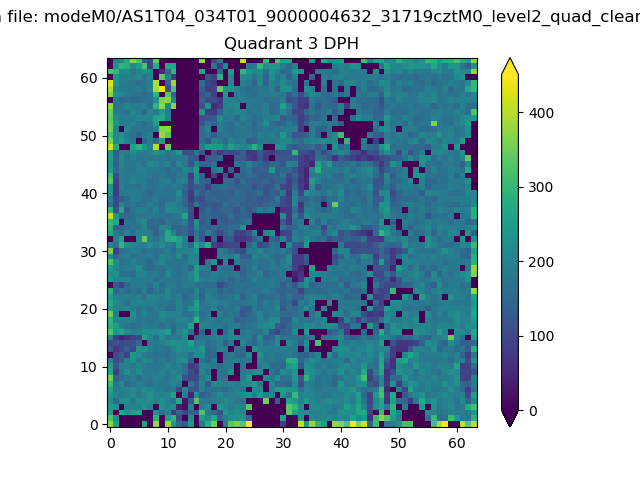 |
 |
Quadrant C |
| Plot type | Count rate plots | Images |
|---|---|---|
| Comparison with Poisson distribution Blue bars denote a histogram of data divided into 1 sec bins. Red curve is a Poisson curve with rate = median count rate of data. |
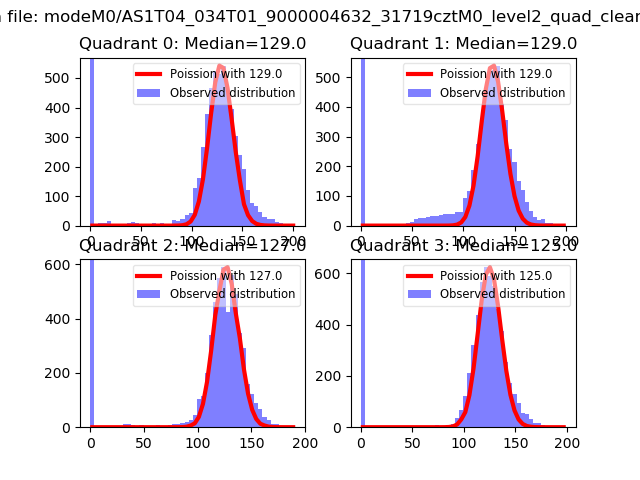 |
 |
| Quadrant-wise count rates Data is divided into 100 sec bins |
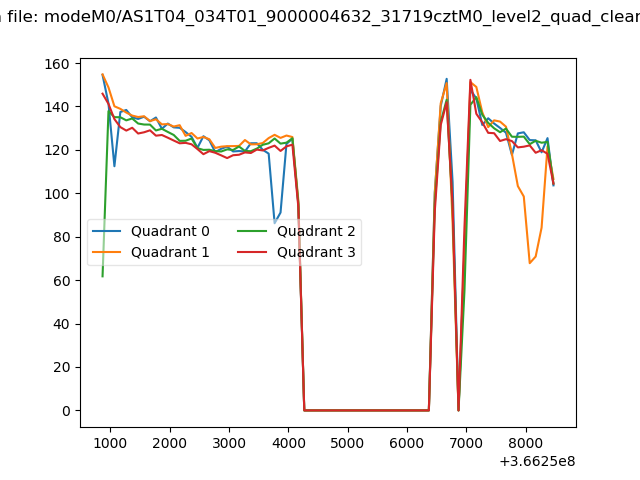 |
|
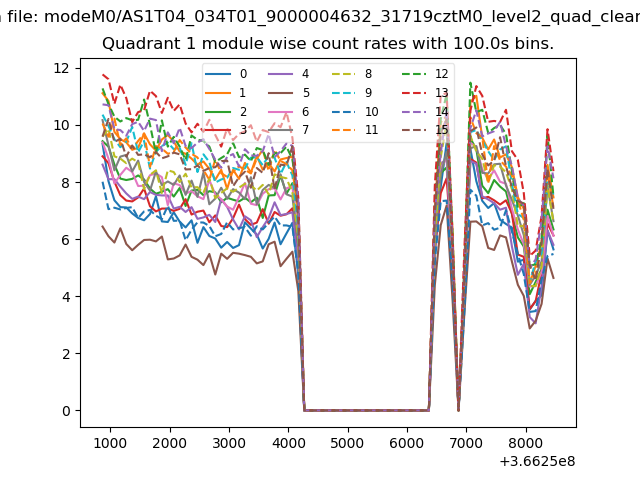
| Module-wise count rates for Quadrant A Data is divided into 100 sec bins |
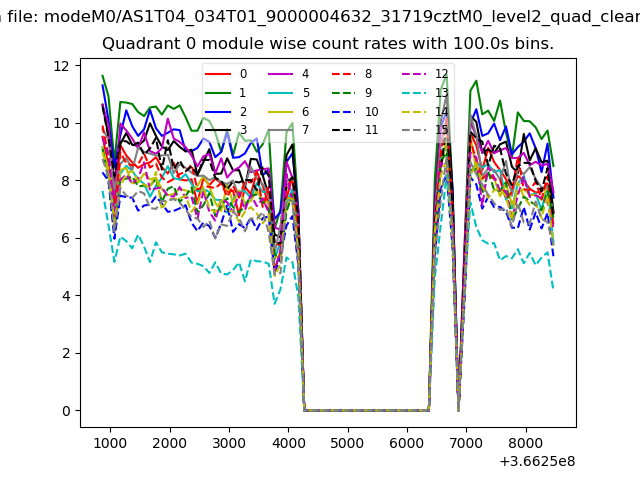 |
 |
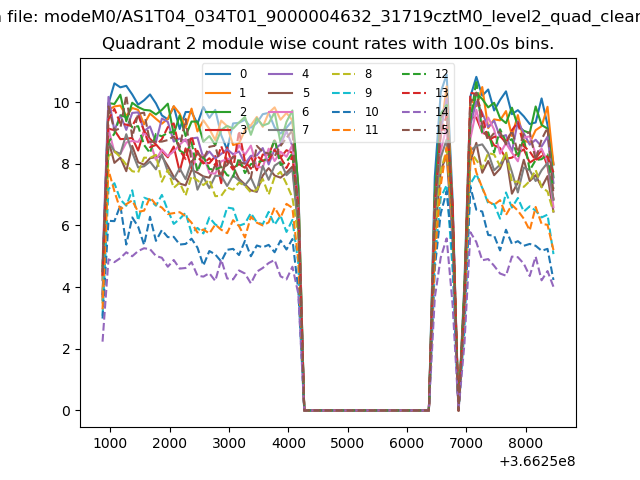
| Module-wise count rates for Quadrant B Data is divided into 100 sec bins |
 |
 |
| Module-wise count rates for Quadrant C Data is divided into 100 sec bins |
 |
 |
| Module-wise count rates for Quadrant D Data is divided into 100 sec bins |
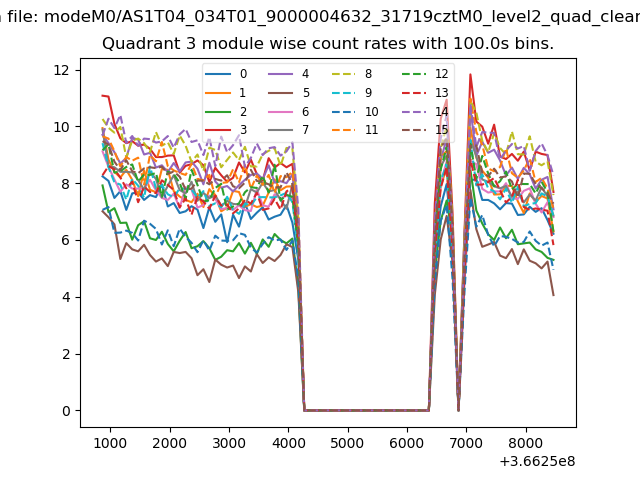 |
 |
| Parameter | Plot |
|---|---|
| CZT HV Monitor | 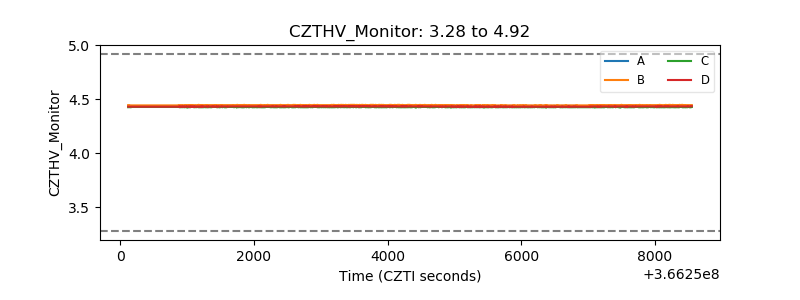 |
| D_VDD | 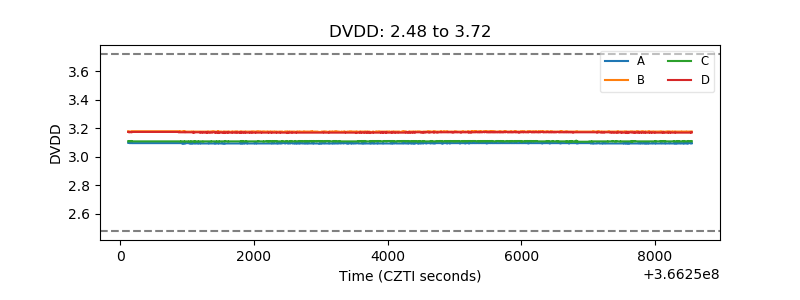 |
| Temperature 1 | 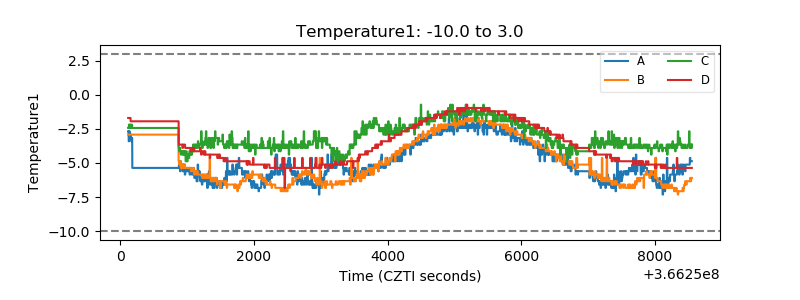 |
| Veto HV Monitor | 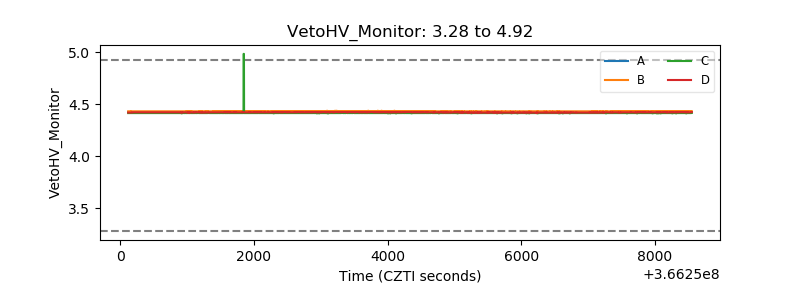 |
| Veto LLD | 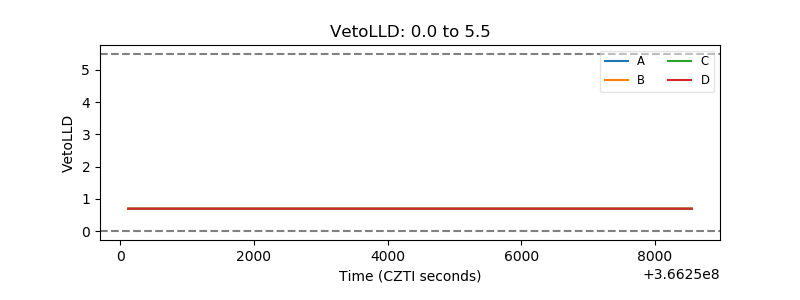 |
| Alpha Counter | 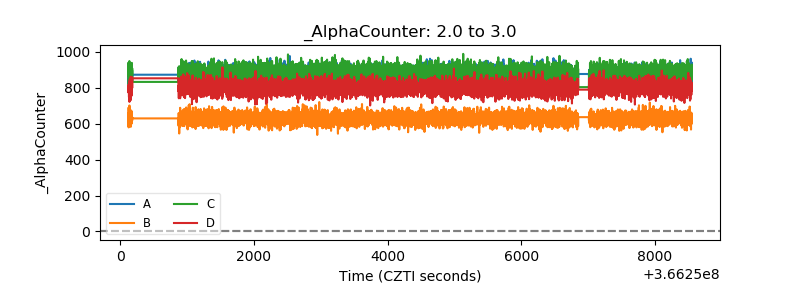 |
| _CPM_Rate | 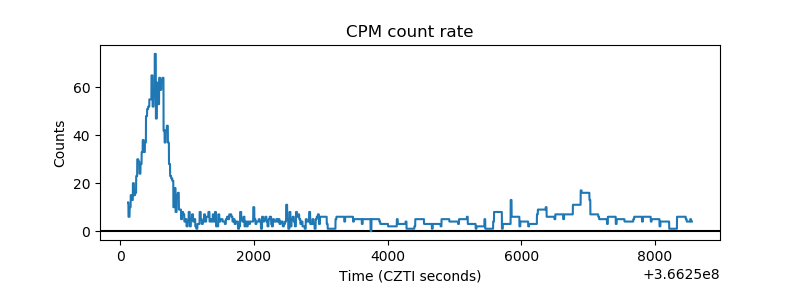 |
| CZT Counter | 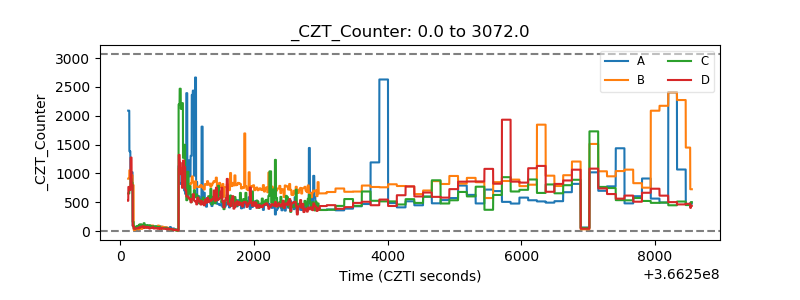 |
| +2.5 Volts monitor |  |
| +5 Volts monitor |  |
| _ROLL_ROT | 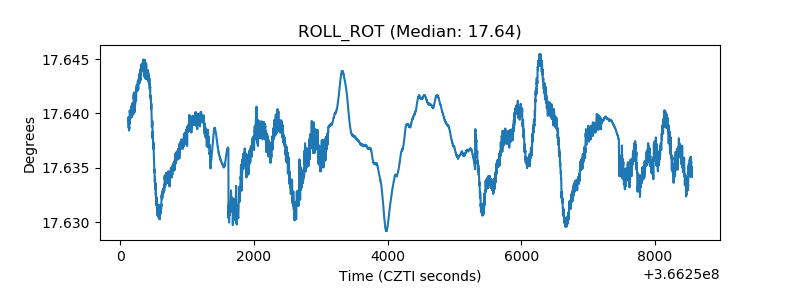 |
| _Roll_DEC | 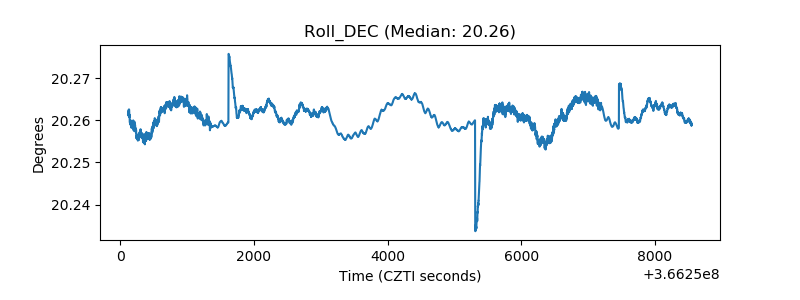 |
| _Roll_RA | 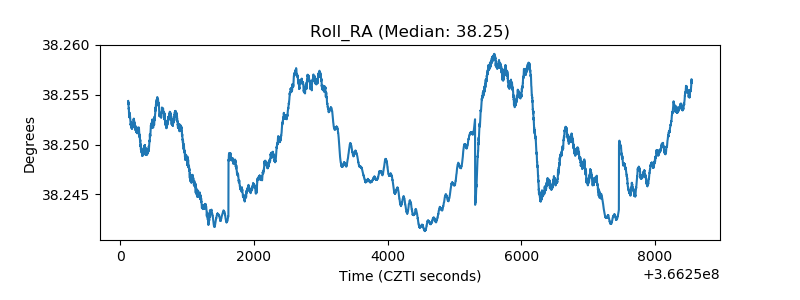 |
| Veto Counter | 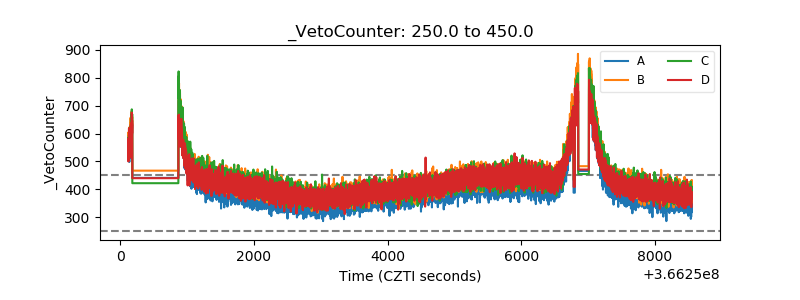 |