| Param | Original file | Final file |
|---|---|---|
| Filename | modeM0/AS1T04_034T01_9000004632_31720cztM0_level2.evt | modeM0/AS1T04_034T01_9000004632_31720cztM0_level2_quad_clean.evt |
| Size (bytes) | 813,035,520 | 107,320,320 |
| Size | 775.4 MB | 102.3 MB |
| Events in quadrant A | 5,954,432 | 685,771 |
| Events in quadrant B | 8,425,841 | 670,818 |
| Events in quadrant C | 4,389,224 | 694,690 |
| Events in quadrant D | 5,330,035 | 658,900 |
| Mode SS | |||
|---|---|---|---|
| Quadrant | BADHDUFLAG | Total packets | Discarded packets |
| A | 0 | 156 | 0 |
| B | 0 | 156 | 0 |
| C | 0 | 156 | 0 |
| D | 0 | 156 | 0 |
| Mode M0 | |||
|---|---|---|---|
| Quadrant | BADHDUFLAG | Total packets | Discarded packets |
| A | 0 | 22912 | 1 |
| B | 0 | 30472 | 1 |
| C | 0 | 18099 | 1 |
| D | 0 | 21229 | 2 |
| Quadrant | Total seconds | Saturated seconds | Saturation percentage |
|---|---|---|---|
| A | 7749 | 865 | 11.162731% |
| B | 7750 | 1124 | 14.503226% |
| C | 7750 | 278 | 3.587097% |
| D | 7749 | 475 | 6.129823% |
Noise dominated data is calculated using 1-second bins in cleaned event files. If a bin has >2000 counts, and if more than 50% of those come from <1% of pixels, then it is considered to be noise-dominated and hence unusable.
| Quadrant | # 1 sec bins | Bins with >0 counts | Bins with >2000 counts | High rate bins dominated by noise | Noise dominated (total time) | Noise dominated (detector-on time) | Marked lightcurve |
|---|---|---|---|---|---|---|---|
| A | 7764 | 7750 | 378 | 378 | 4.87% | 4.88% | 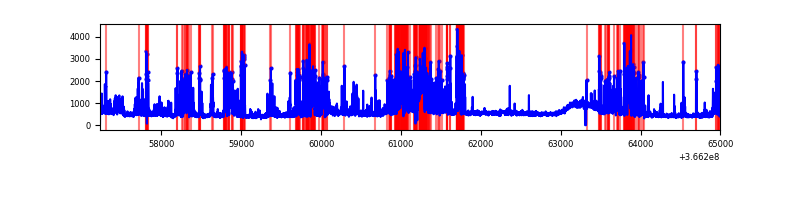 |
| B | 7765 | 7751 | 678 | 678 | 8.73% | 8.75% | 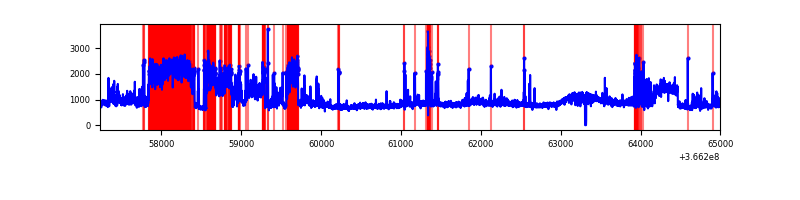 |
| C | 7765 | 7751 | 13 | 13 | 0.17% | 0.17% | 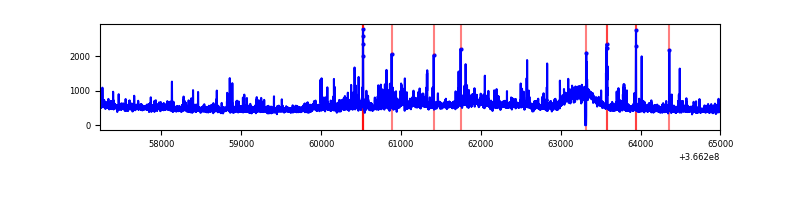 |
| D | 7764 | 7750 | 245 | 245 | 3.16% | 3.16% | 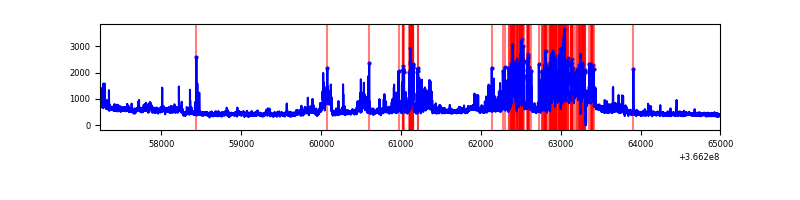 |
Top three noisy pixels from each quadrant. If the there are fewer than three noisy pixels in the level2.evt file, extra rows are filled as -1
| Pixel properties | Quadrant properties | ||||||
|---|---|---|---|---|---|---|---|
| Quadrant | DetID | PixID | Counts | Sigma | Mean | Median | Sigma |
| A | 0 | 13 | 2360992 | 12423.24 | 929 | 910 | 190.0 |
| A | 13 | 254 | 14006 | 68.94 | 929 | 910 | 190.0 |
| A | 3 | 137 | 9786 | 46.72 | 929 | 910 | 190.0 |
| B | 4 | 80 | 2564396 | 14314.95 | 926 | 901 | 179.1 |
| B | 6 | 159 | 2084465 | 11634.94 | 926 | 901 | 179.1 |
| B | 5 | 172 | 54577 | 299.73 | 926 | 901 | 179.1 |
| C | 0 | 10 | 353966 | 1577.37 | 932 | 937 | 223.8 |
| C | 3 | 233 | 199054 | 885.21 | 932 | 937 | 223.8 |
| C | 14 | 238 | 149533 | 663.94 | 932 | 937 | 223.8 |
| D | 12 | 233 | 1130635 | 5151.65 | 915 | 890 | 219.3 |
| D | 8 | 195 | 514124 | 2340.35 | 915 | 890 | 219.3 |
| D | 12 | 227 | 183536 | 832.87 | 915 | 890 | 219.3 |
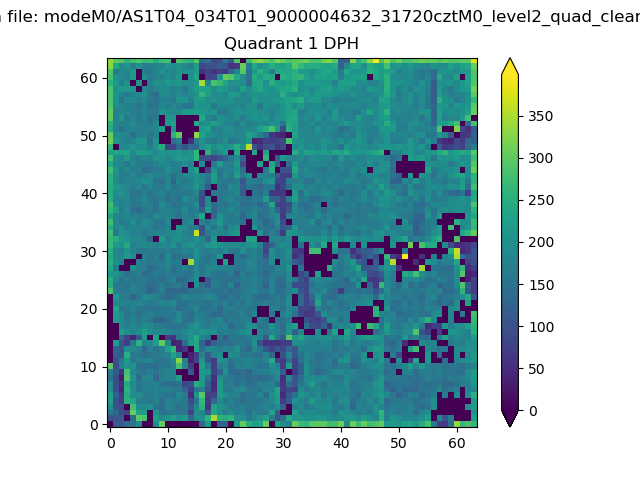
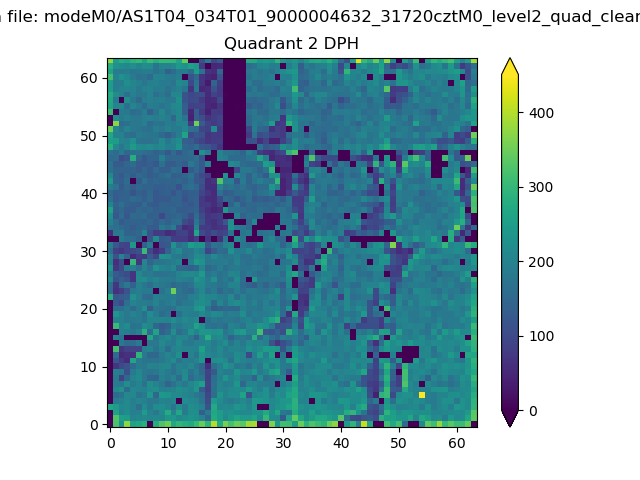
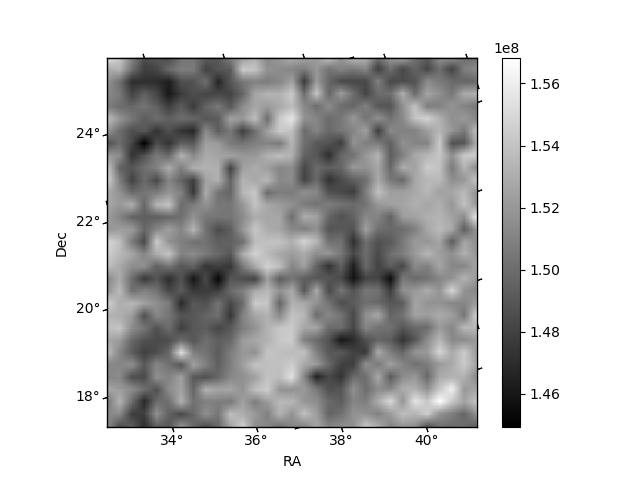
Histogram calculated using DETX and DETY for each event in the final _common_clean file
| Quadrant A |  |
 |
Quadrant B |
|---|---|---|---|
| Quadrant D |  |
 |
Quadrant C |
| Plot type | Count rate plots | Images |
|---|---|---|
| Comparison with Poisson distribution Blue bars denote a histogram of data divided into 1 sec bins. Red curve is a Poisson curve with rate = median count rate of data. |
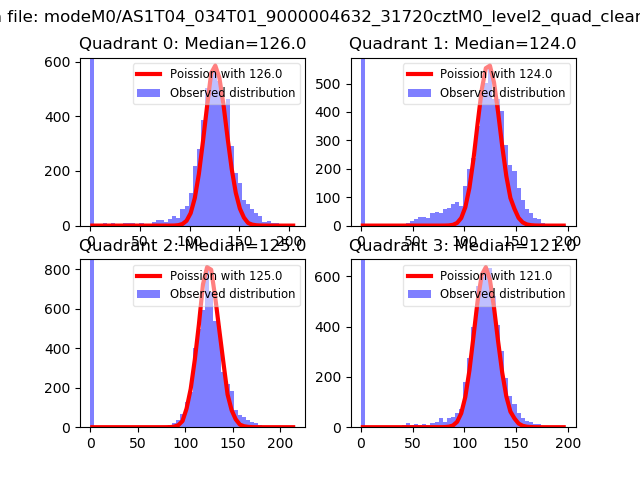 |
 |
| Quadrant-wise count rates Data is divided into 100 sec bins |
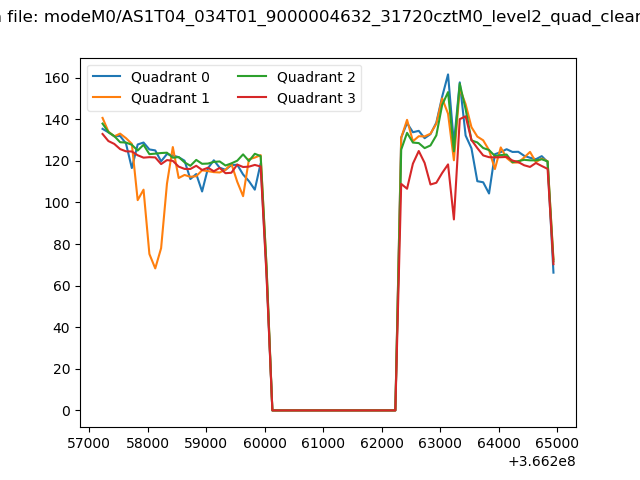 |
|
| Module-wise count rates for Quadrant A Data is divided into 100 sec bins |
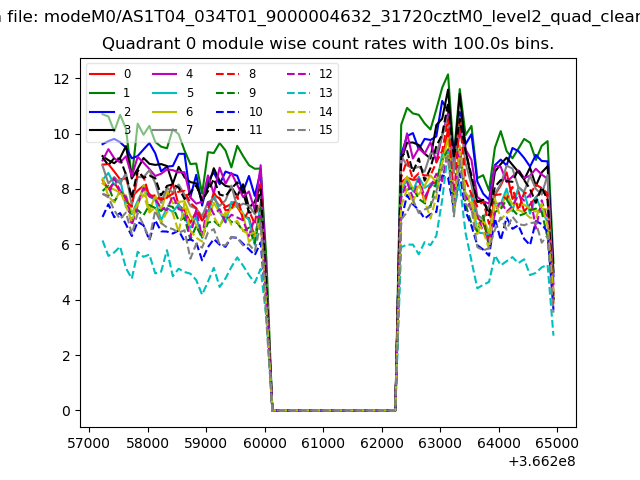 |
 |
| Module-wise count rates for Quadrant B Data is divided into 100 sec bins |
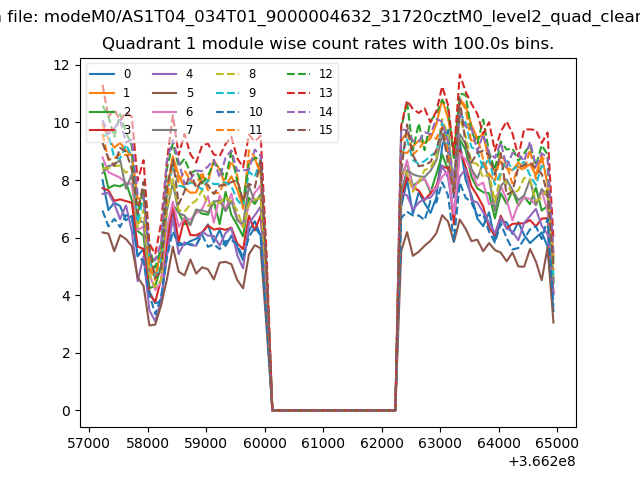 |
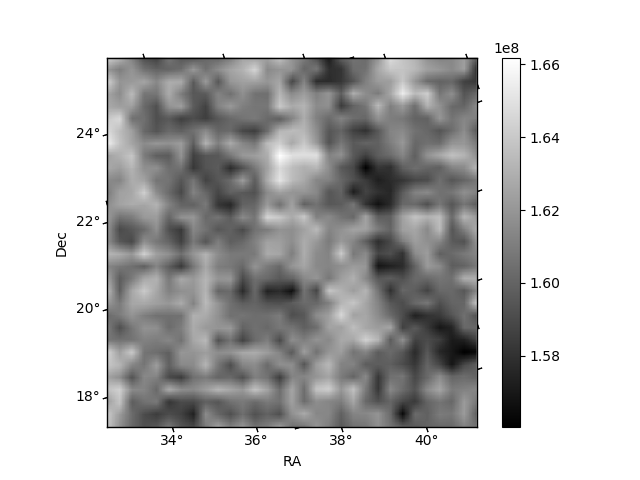 |
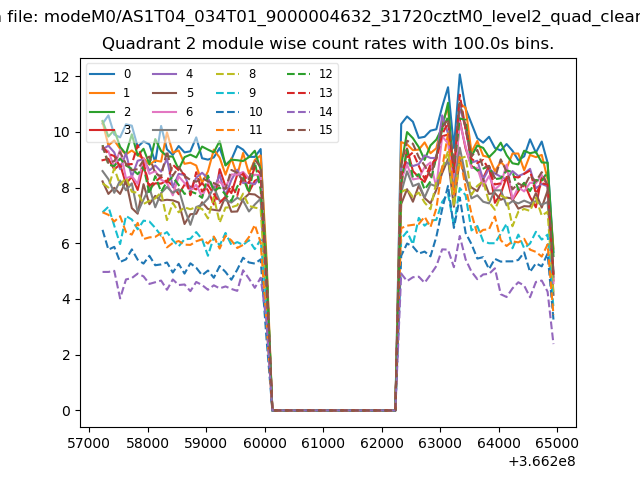
| Module-wise count rates for Quadrant C Data is divided into 100 sec bins |
 |
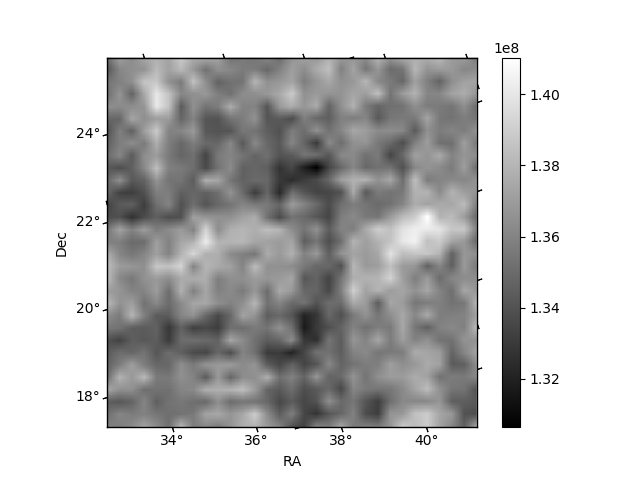 |
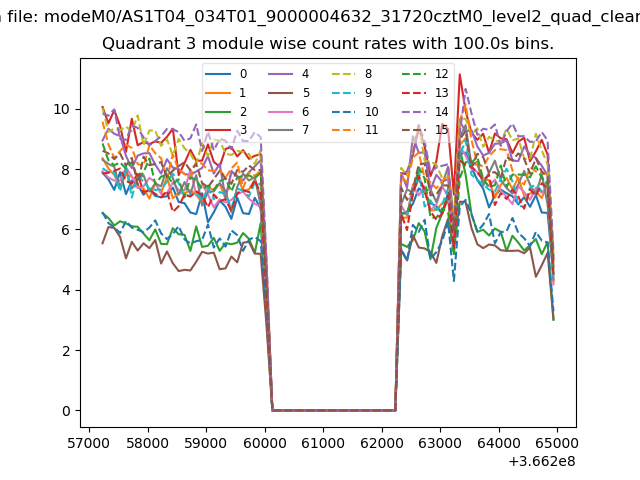
| Module-wise count rates for Quadrant D Data is divided into 100 sec bins |
 |
 |
| Parameter | Plot |
|---|---|
| CZT HV Monitor | 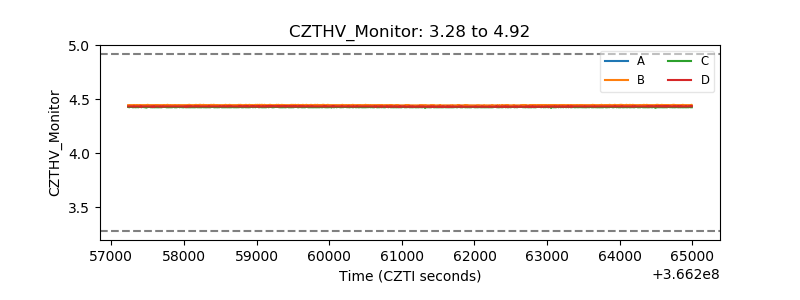 |
| D_VDD | 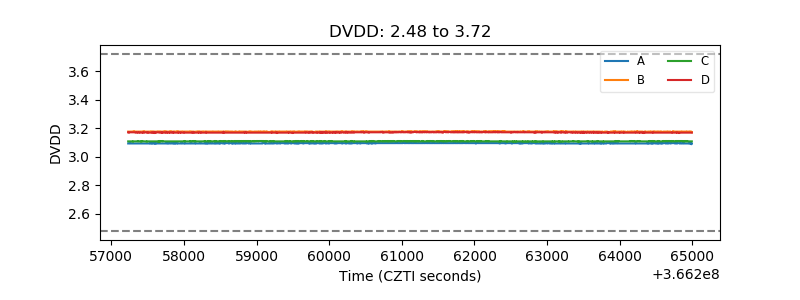 |
| Temperature 1 | 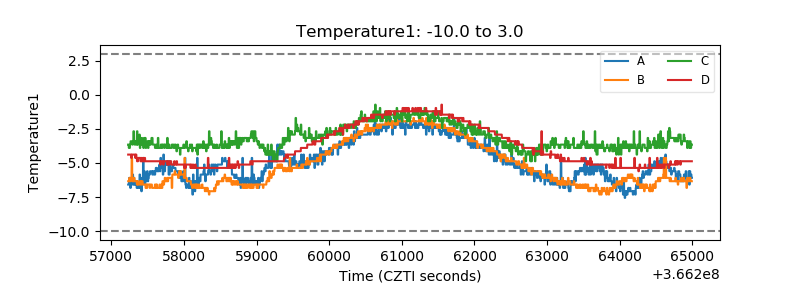 |
| Veto HV Monitor | 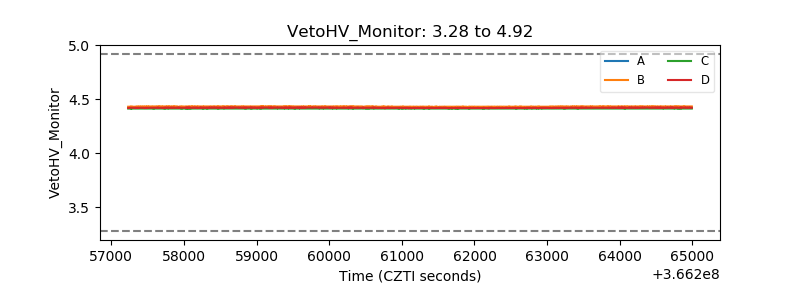 |
| Veto LLD | 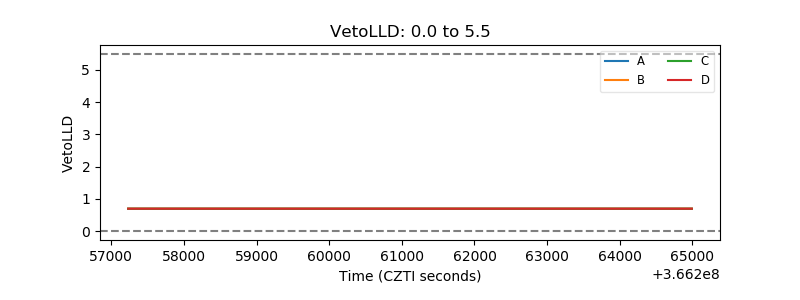 |
| Alpha Counter | 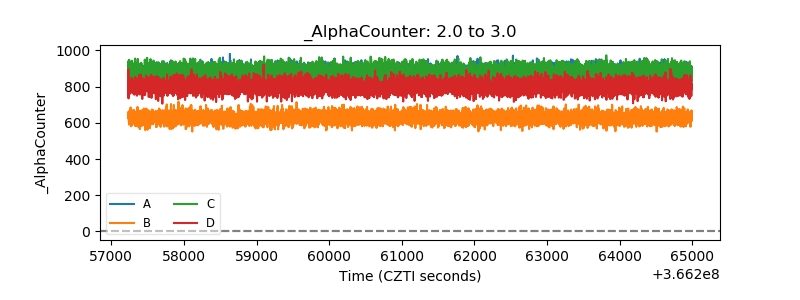 |
| _CPM_Rate | 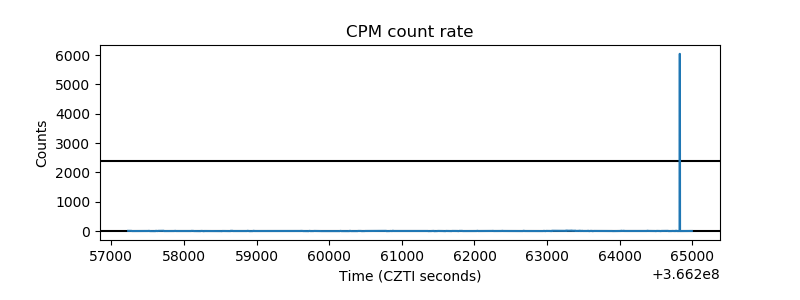 |
| CZT Counter |  |
| +2.5 Volts monitor |  |
| +5 Volts monitor |  |
| _ROLL_ROT | 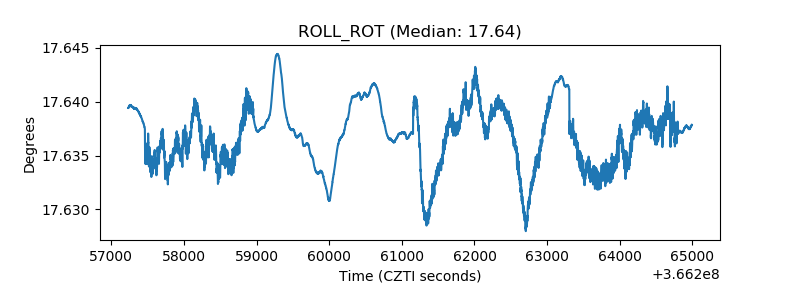 |
| _Roll_DEC | 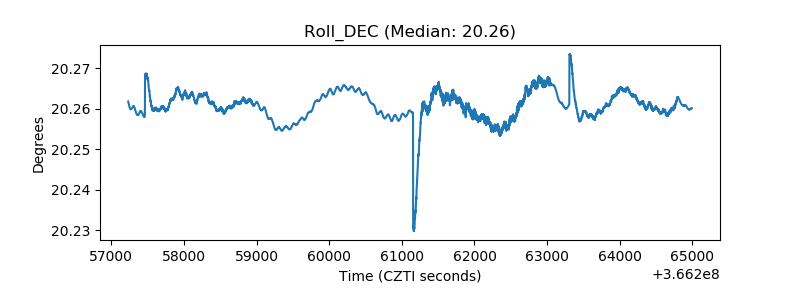 |
| _Roll_RA | 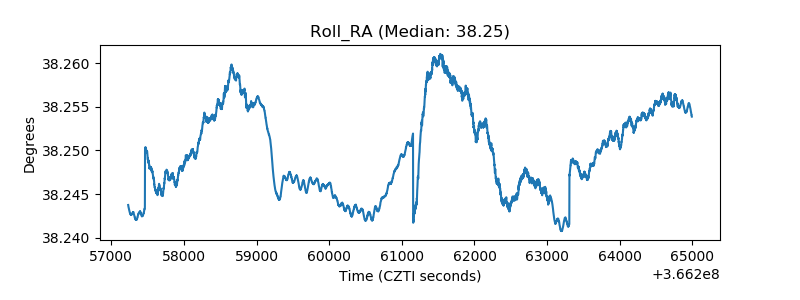 |
| Veto Counter | 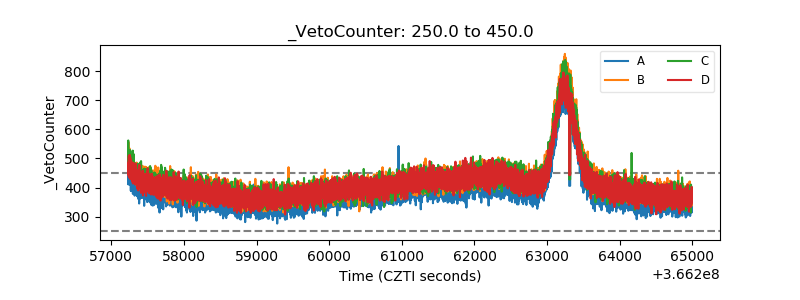 |