| Param | Original file | Final file |
|---|---|---|
| Filename | modeM0/AS1T04_034T01_9000004632_31721cztM0_level2.evt | modeM0/AS1T04_034T01_9000004632_31721cztM0_level2_quad_clean.evt |
| Size (bytes) | 327,355,200 | 52,179,840 |
| Size | 312.2 MB | 49.8 MB |
| Events in quadrant A | 2,008,013 | 344,346 |
| Events in quadrant B | 3,300,176 | 305,606 |
| Events in quadrant C | 2,056,102 | 333,779 |
| Events in quadrant D | 2,296,964 | 334,352 |
| Mode M9 | |||
|---|---|---|---|
| Quadrant | BADHDUFLAG | Total packets | Discarded packets |
| A | 0 | 4 | 0 |
| B | 0 | 4 | 0 |
| C | 0 | 6 | 2 |
| D | 0 | 7 | 3 |
| Mode SS | |||
|---|---|---|---|
| Quadrant | BADHDUFLAG | Total packets | Discarded packets |
| A | 0 | 116 | 36 |
| B | 0 | 115 | 34 |
| C | 0 | 120 | 40 |
| D | 0 | 116 | 36 |
| Mode M0 | |||
|---|---|---|---|
| Quadrant | BADHDUFLAG | Total packets | Discarded packets |
| A | 0 | 12305 | 4023 |
| B | 0 | 19021 | 6903 |
| C | 0 | 12912 | 4513 |
| D | 0 | 14325 | 5044 |
| Quadrant | Total seconds | Saturated seconds | Saturation percentage |
|---|---|---|---|
| A | 3794 | 69 | 1.818661% |
| B | 3545 | 375 | 10.578279% |
| C | 3727 | 129 | 3.461229% |
| D | 3666 | 37 | 1.009274% |
Noise dominated data is calculated using 1-second bins in cleaned event files. If a bin has >2000 counts, and if more than 50% of those come from <1% of pixels, then it is considered to be noise-dominated and hence unusable.
| Quadrant | # 1 sec bins | Bins with >0 counts | Bins with >2000 counts | High rate bins dominated by noise | Noise dominated (total time) | Noise dominated (detector-on time) | Marked lightcurve |
|---|---|---|---|---|---|---|---|
| A | 5971 | 4204 | 12 | 12 | 0.20% | 0.29% | 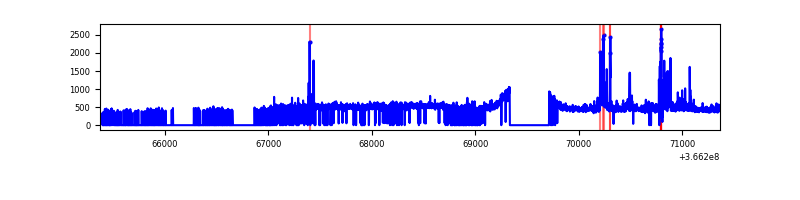 |
| B | 5962 | 3918 | 116 | 116 | 1.95% | 2.96% |  |
| C | 5990 | 4137 | 23 | 23 | 0.38% | 0.56% | 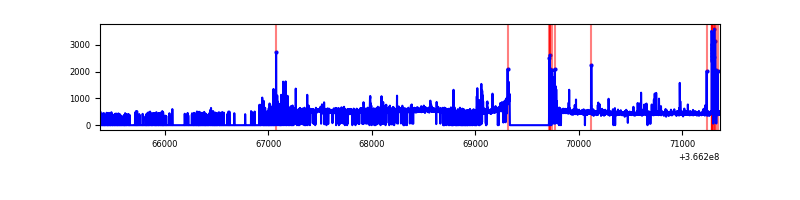 |
| D | 5993 | 4111 | 8 | 8 | 0.13% | 0.19% | 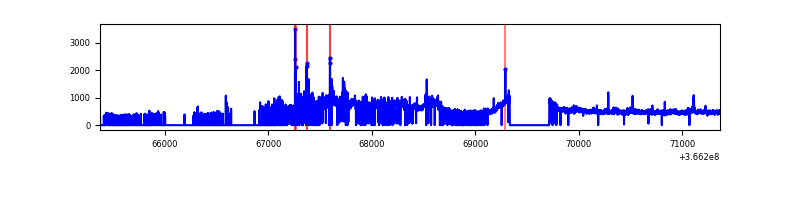 |
Top three noisy pixels from each quadrant. If the there are fewer than three noisy pixels in the level2.evt file, extra rows are filled as -1
| Pixel properties | Quadrant properties | ||||||
|---|---|---|---|---|---|---|---|
| Quadrant | DetID | PixID | Counts | Sigma | Mean | Median | Sigma |
| A | 0 | 13 | 188047 | 1918.6 | 471 | 460 | 97.8 |
| A | 13 | 254 | 7238 | 69.32 | 471 | 460 | 97.8 |
| A | 3 | 137 | 4997 | 46.4 | 471 | 460 | 97.8 |
| B | 6 | 159 | 911581 | 11157.86 | 411 | 399 | 81.7 |
| B | 4 | 80 | 710400 | 8694.3 | 411 | 399 | 81.7 |
| B | 15 | 33 | 26003 | 313.53 | 411 | 399 | 81.7 |
| C | 0 | 10 | 148519 | 1382.19 | 446 | 448 | 107.1 |
| C | 14 | 238 | 70783 | 656.55 | 446 | 448 | 107.1 |
| C | 10 | 22 | 50235 | 464.74 | 446 | 448 | 107.1 |
| D | 8 | 195 | 513804 | 4808.39 | 444 | 430 | 106.8 |
| D | 12 | 233 | 85302 | 794.93 | 444 | 430 | 106.8 |
| D | 2 | 234 | 15156 | 137.93 | 444 | 430 | 106.8 |
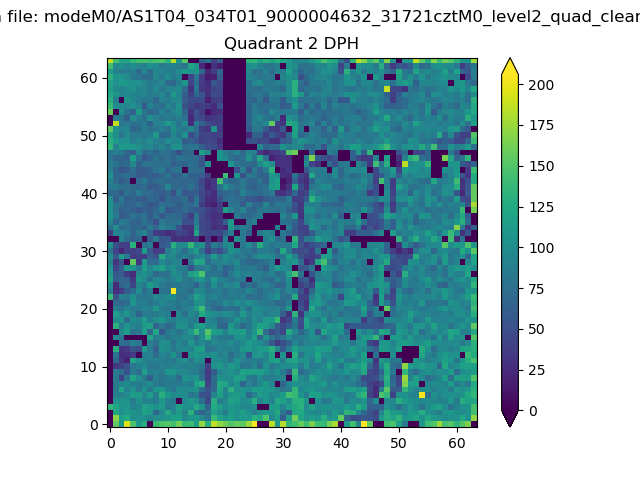
Histogram calculated using DETX and DETY for each event in the final _common_clean file
| Quadrant A | 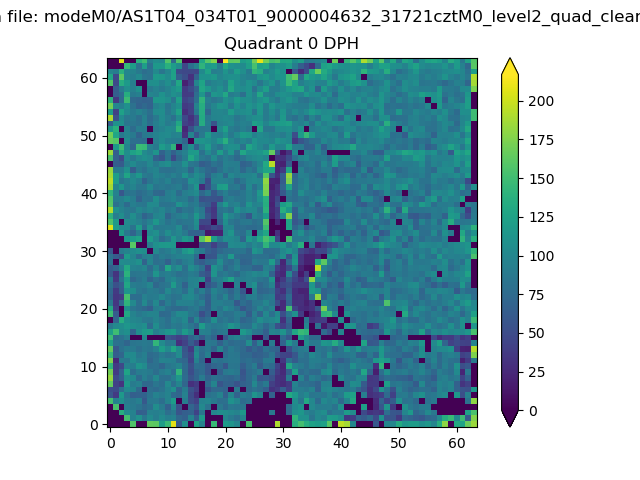 |
 |
Quadrant B |
|---|---|---|---|
| Quadrant D | 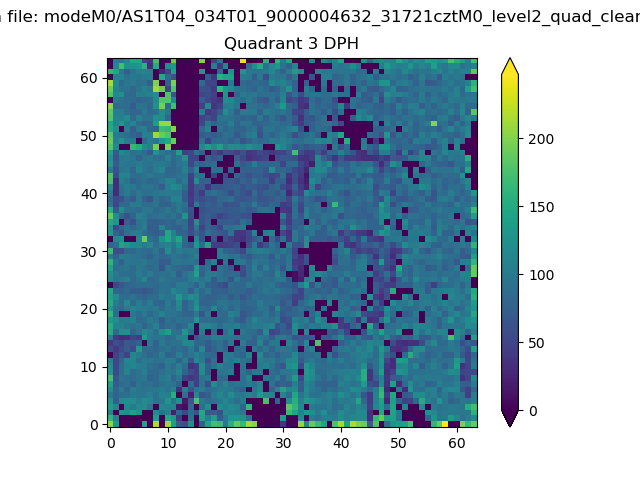 |
 |
Quadrant C |
| Plot type | Count rate plots | Images |
|---|---|---|
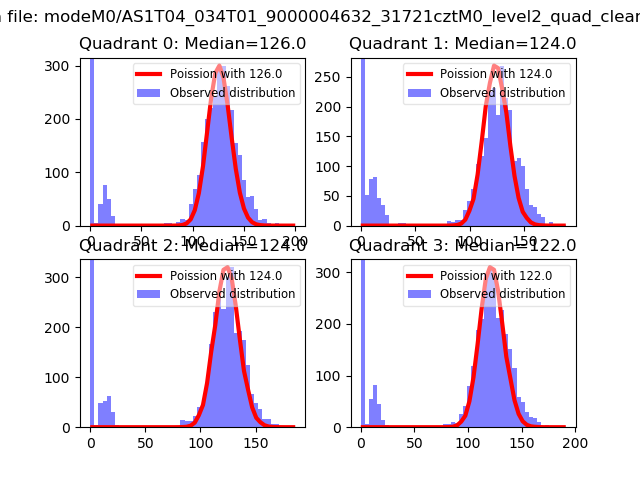
| Comparison with Poisson distribution Blue bars denote a histogram of data divided into 1 sec bins. Red curve is a Poisson curve with rate = median count rate of data. |
 |
 |
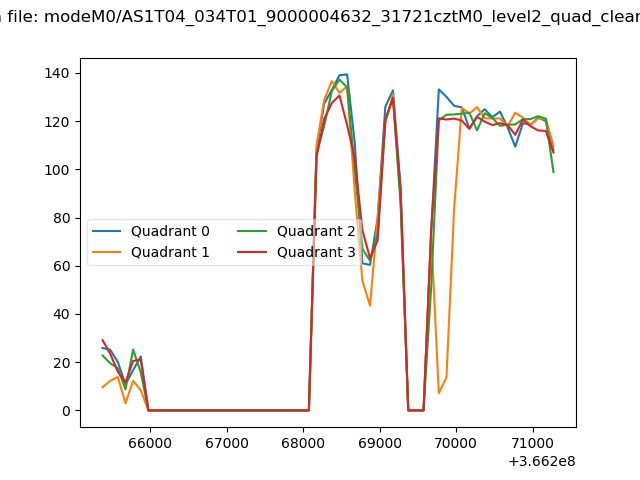
| Quadrant-wise count rates Data is divided into 100 sec bins |
 |
|
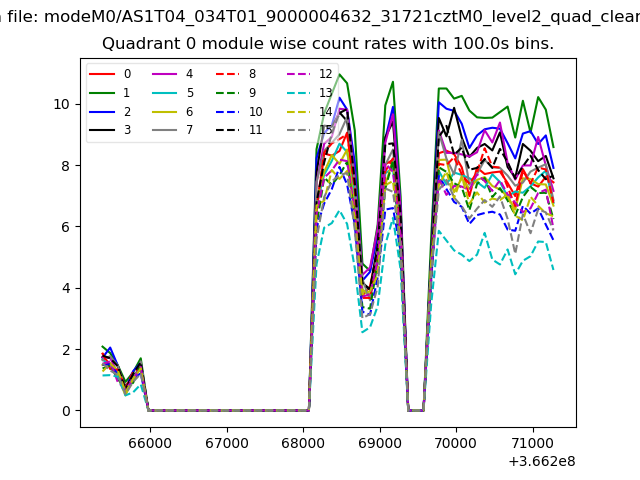
| Module-wise count rates for Quadrant A Data is divided into 100 sec bins |
 |
 |
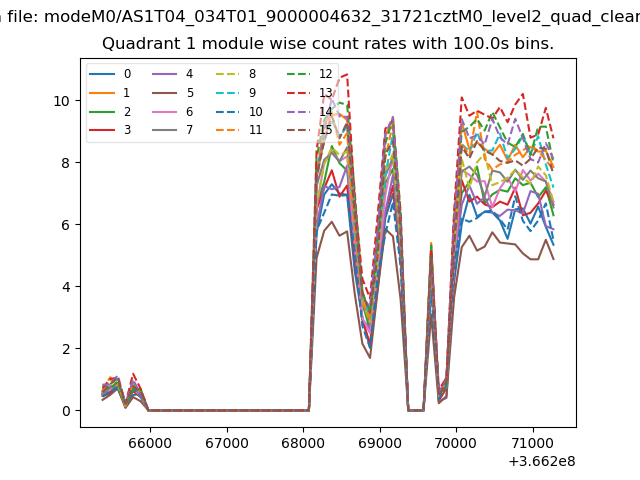
| Module-wise count rates for Quadrant B Data is divided into 100 sec bins |
 |
 |
| Module-wise count rates for Quadrant C Data is divided into 100 sec bins |
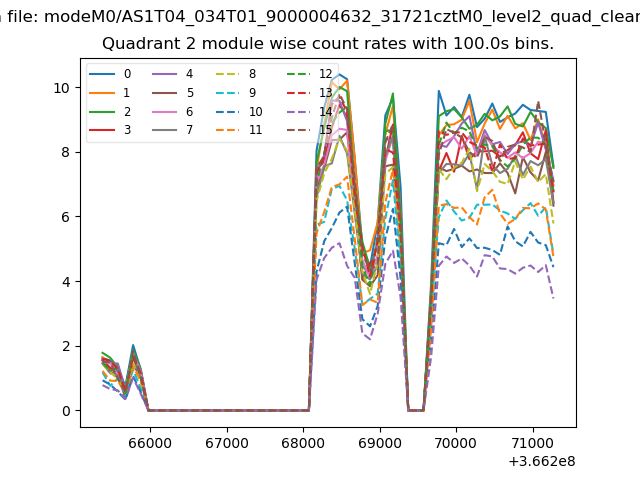 |
 |
| Module-wise count rates for Quadrant D Data is divided into 100 sec bins |
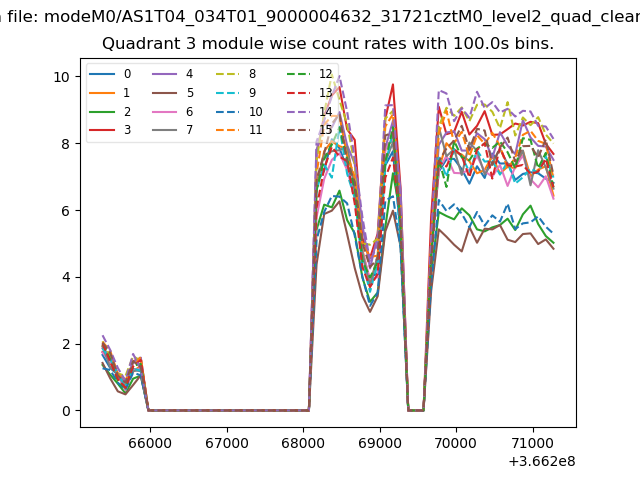 |
 |
| Parameter | Plot |
|---|---|
| CZT HV Monitor | 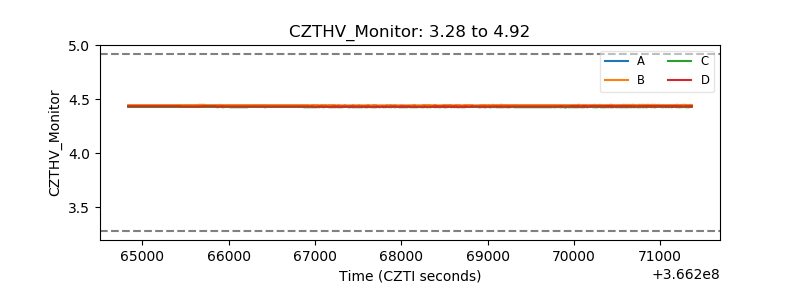 |
| D_VDD | 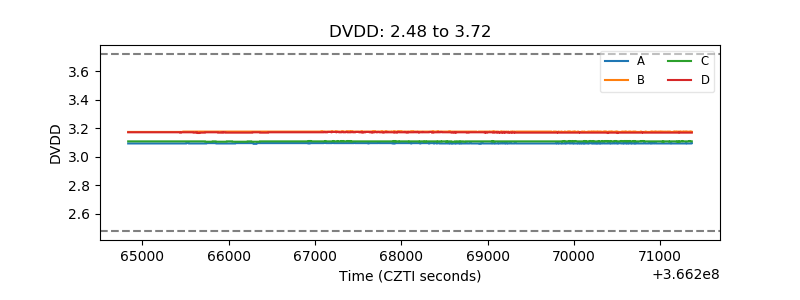 |
| Temperature 1 | 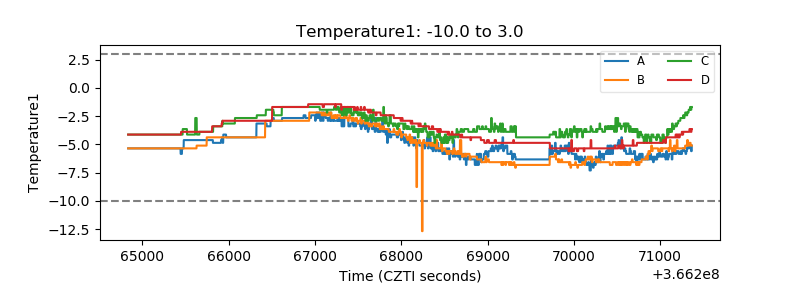 |
| Veto HV Monitor | 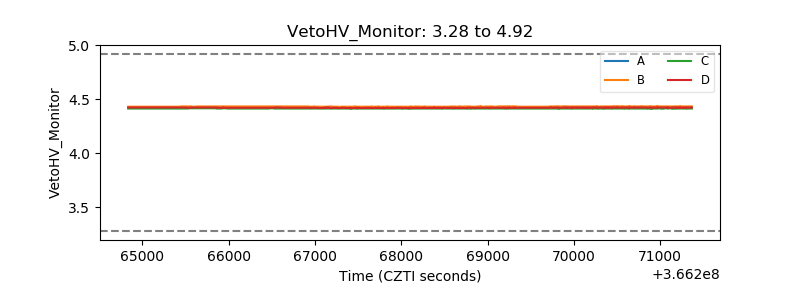 |
| Veto LLD | 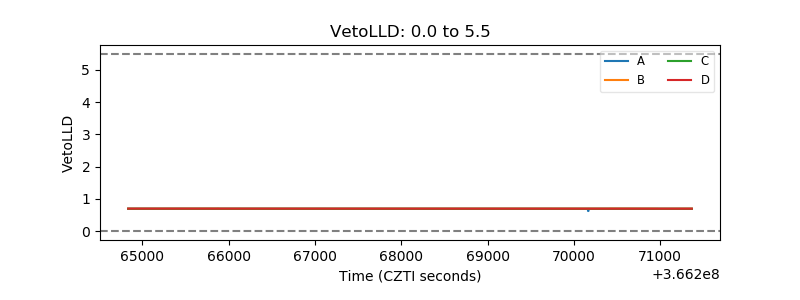 |
| Alpha Counter | 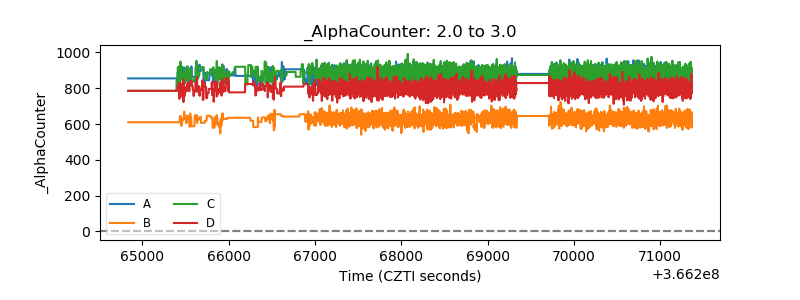 |
| _CPM_Rate | 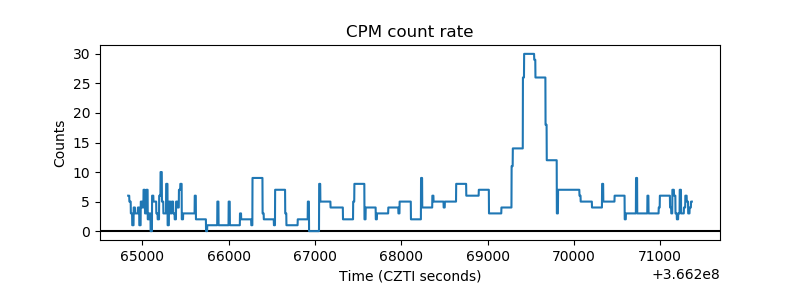 |
| CZT Counter | 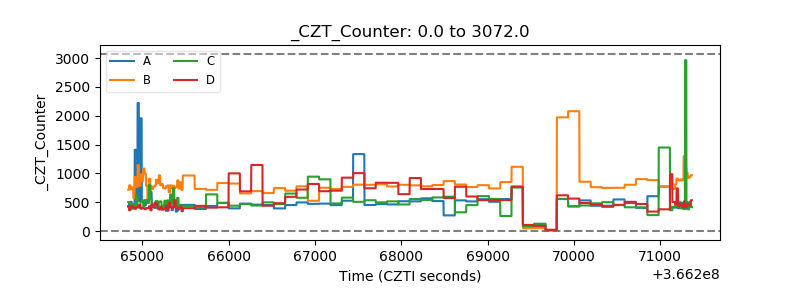 |
| +2.5 Volts monitor |  |
| +5 Volts monitor |  |
| _ROLL_ROT | 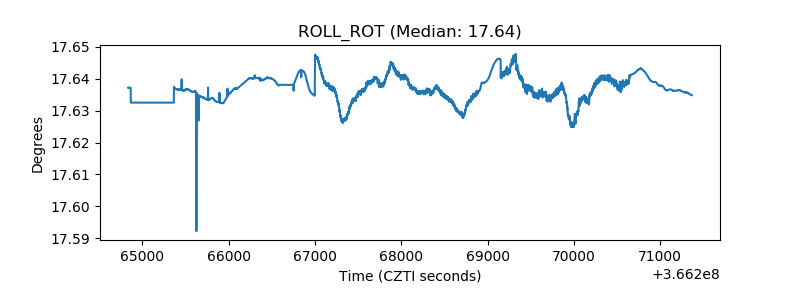 |
| _Roll_DEC | 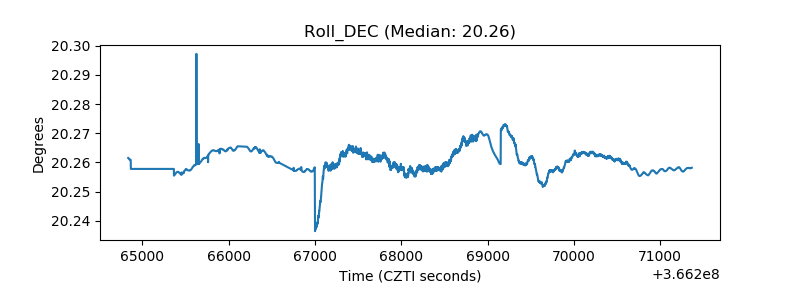 |
| _Roll_RA | 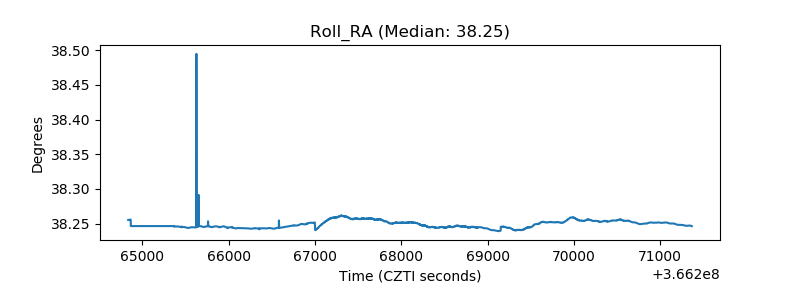 |
| Veto Counter | 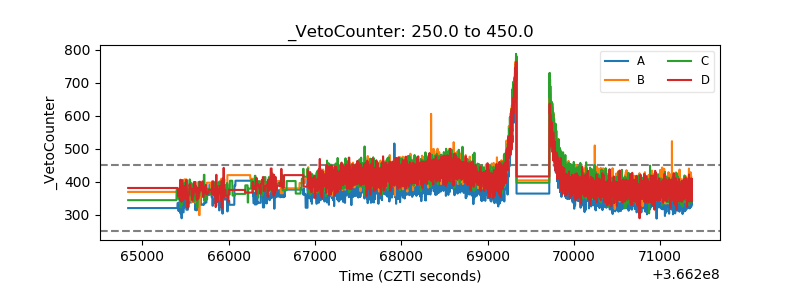 |