| Param | Original file | Final file |
|---|---|---|
| Filename | modeM0/AS1T04_034T01_9000004632_31723cztM0_level2.evt | modeM0/AS1T04_034T01_9000004632_31723cztM0_level2_quad_clean.evt |
| Size (bytes) | 1,142,723,520 | 146,217,600 |
| Size | 1.1 GB | 139.4 MB |
| Events in quadrant A | 8,296,518 | 893,942 |
| Events in quadrant B | 11,684,383 | 922,434 |
| Events in quadrant C | 7,074,776 | 889,175 |
| Events in quadrant D | 6,734,031 | 882,998 |
| Mode M9 | |||
|---|---|---|---|
| Quadrant | BADHDUFLAG | Total packets | Discarded packets |
| A | 0 | 14 | 0 |
| B | 0 | 14 | 0 |
| C | 0 | 14 | 0 |
| D | 0 | 14 | 0 |
| Mode SS | |||
|---|---|---|---|
| Quadrant | BADHDUFLAG | Total packets | Discarded packets |
| A | 0 | 246 | 0 |
| B | 0 | 246 | 0 |
| C | 0 | 246 | 0 |
| D | 0 | 246 | 0 |
| Mode M0 | |||
|---|---|---|---|
| Quadrant | BADHDUFLAG | Total packets | Discarded packets |
| A | 0 | 32561 | 6 |
| B | 0 | 43019 | 2 |
| C | 0 | 28510 | 2 |
| D | 0 | 27224 | 2 |
| Quadrant | Total seconds | Saturated seconds | Saturation percentage |
|---|---|---|---|
| A | 12139 | 676 | 5.568828% |
| B | 12139 | 871 | 7.175220% |
| C | 12139 | 444 | 3.657632% |
| D | 12139 | 186 | 1.532251% |
Noise dominated data is calculated using 1-second bins in cleaned event files. If a bin has >2000 counts, and if more than 50% of those come from <1% of pixels, then it is considered to be noise-dominated and hence unusable.
| Quadrant | # 1 sec bins | Bins with >0 counts | Bins with >2000 counts | High rate bins dominated by noise | Noise dominated (total time) | Noise dominated (detector-on time) | Marked lightcurve |
|---|---|---|---|---|---|---|---|
| A | 13459 | 12141 | 359 | 359 | 2.67% | 2.96% | 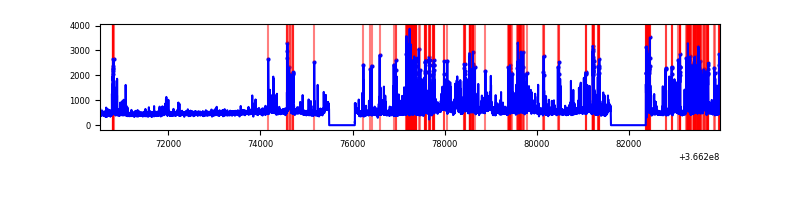 |
| B | 13459 | 12141 | 454 | 454 | 3.37% | 3.74% | 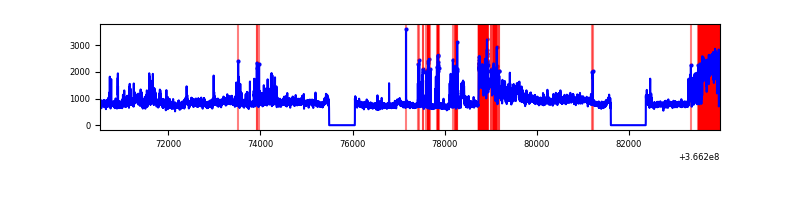 |
| C | 13459 | 12141 | 175 | 175 | 1.30% | 1.44% | 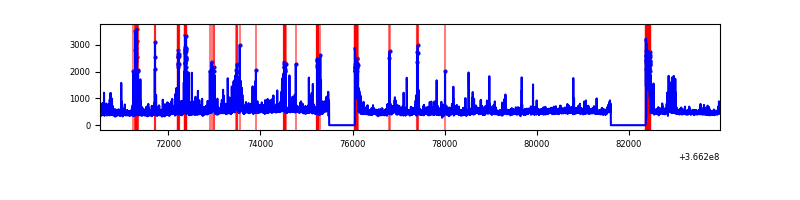 |
| D | 13459 | 12141 | 78 | 78 | 0.58% | 0.64% | 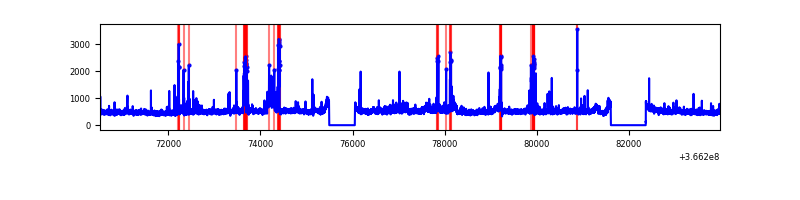 |
Top three noisy pixels from each quadrant. If the there are fewer than three noisy pixels in the level2.evt file, extra rows are filled as -1
| Pixel properties | Quadrant properties | ||||||
|---|---|---|---|---|---|---|---|
| Quadrant | DetID | PixID | Counts | Sigma | Mean | Median | Sigma |
| A | 0 | 13 | 2717573 | 9293.59 | 1446 | 1414 | 292.3 |
| A | 13 | 254 | 21928 | 70.19 | 1446 | 1414 | 292.3 |
| A | 3 | 137 | 14987 | 46.44 | 1446 | 1414 | 292.3 |
| B | 6 | 159 | 3197837 | 11616.89 | 1430 | 1393 | 275.2 |
| B | 4 | 80 | 2486073 | 9030.12 | 1430 | 1393 | 275.2 |
| B | 10 | 245 | 130244 | 468.29 | 1430 | 1393 | 275.2 |
| C | 0 | 10 | 1126826 | 3406.67 | 1396 | 1403 | 330.4 |
| C | 14 | 238 | 220656 | 663.68 | 1396 | 1403 | 330.4 |
| C | 3 | 233 | 111011 | 331.78 | 1396 | 1403 | 330.4 |
| D | 8 | 195 | 783294 | 2288.9 | 1429 | 1391 | 341.6 |
| D | 13 | 249 | 204194 | 593.67 | 1429 | 1391 | 341.6 |
| D | 12 | 233 | 123078 | 356.22 | 1429 | 1391 | 341.6 |
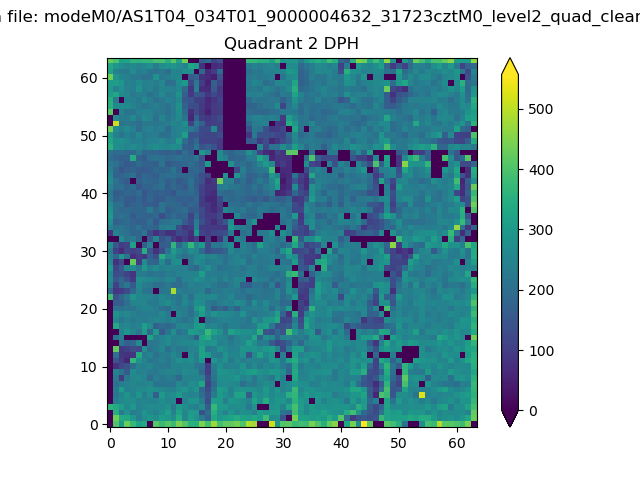
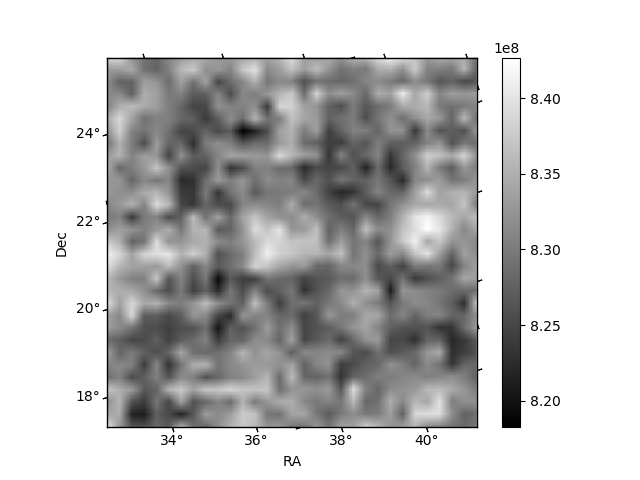
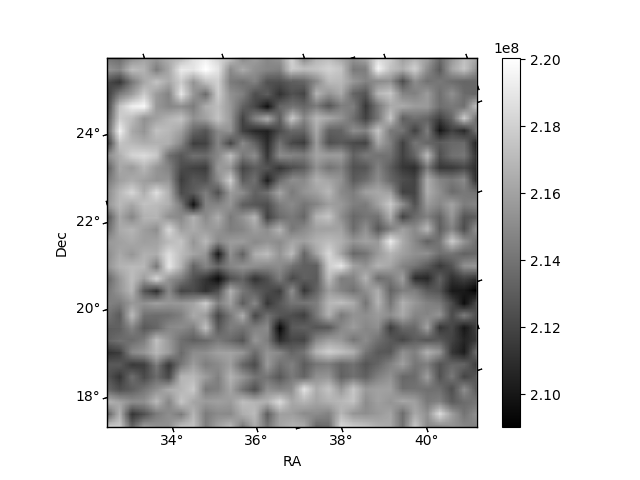
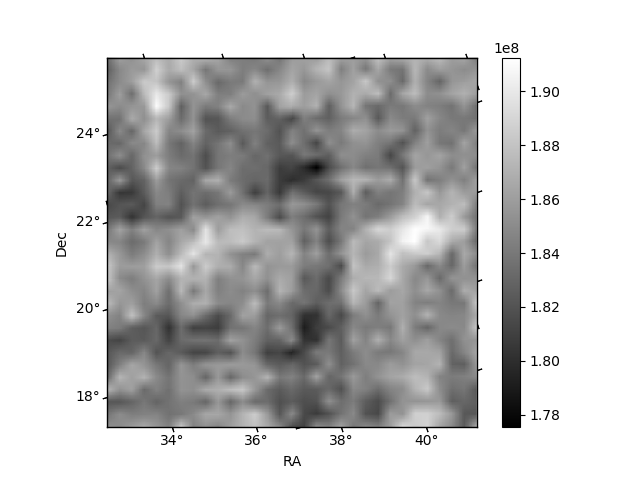
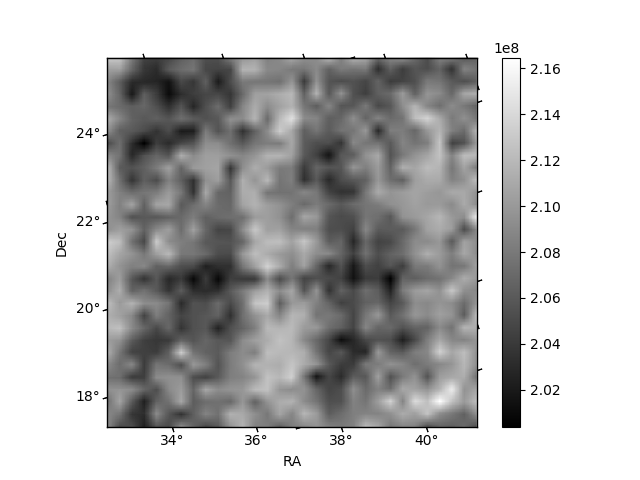
Histogram calculated using DETX and DETY for each event in the final _common_clean file
| Quadrant A | 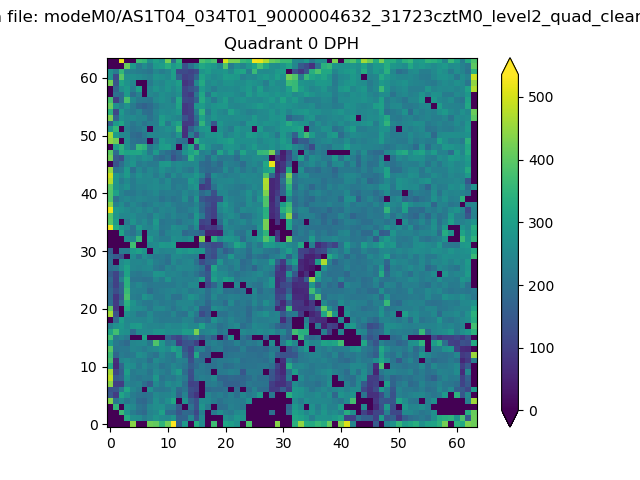 |
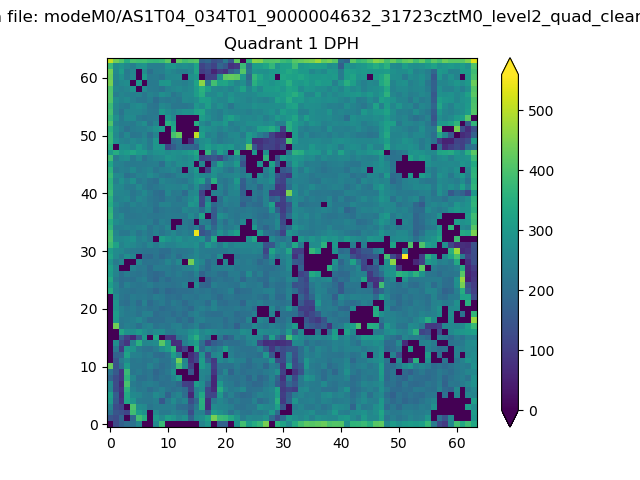 |
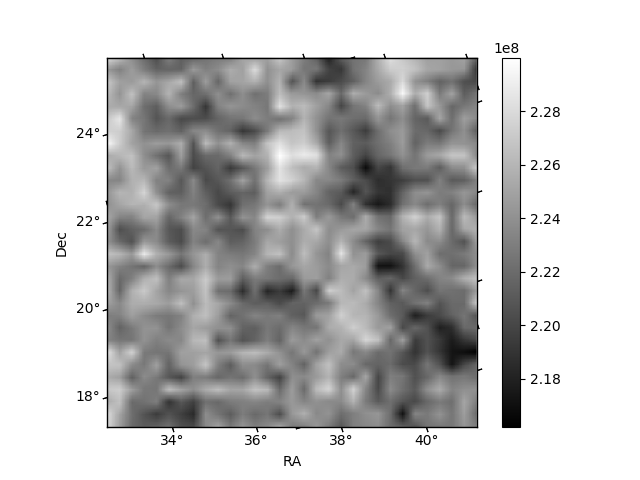
Quadrant B |
|---|---|---|---|
| Quadrant D | 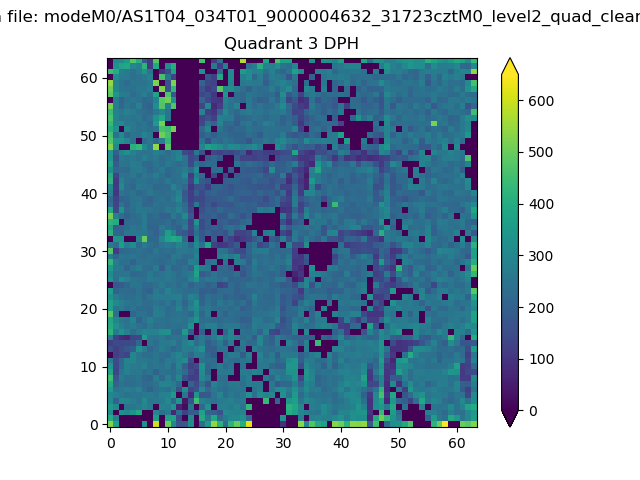 |
 |
Quadrant C |
| Plot type | Count rate plots | Images |
|---|---|---|
| Comparison with Poisson distribution Blue bars denote a histogram of data divided into 1 sec bins. Red curve is a Poisson curve with rate = median count rate of data. |
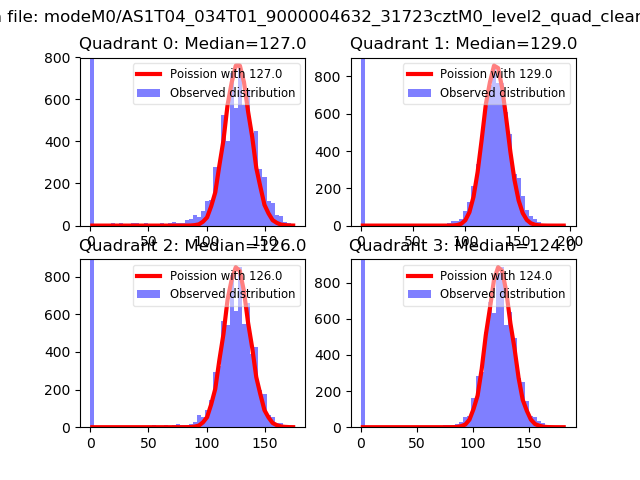 |
 |
| Quadrant-wise count rates Data is divided into 100 sec bins |
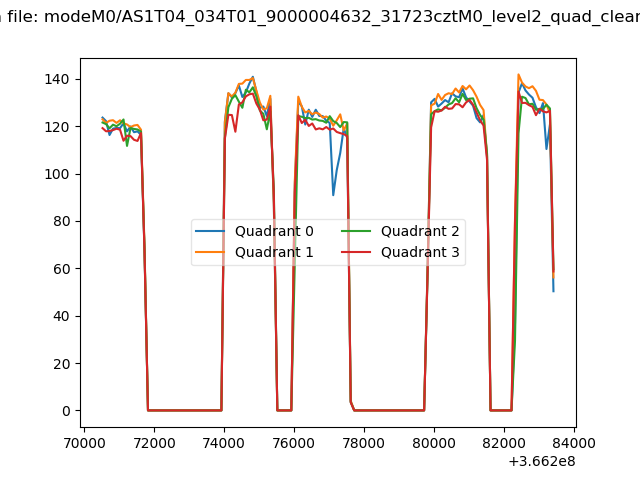 |
|
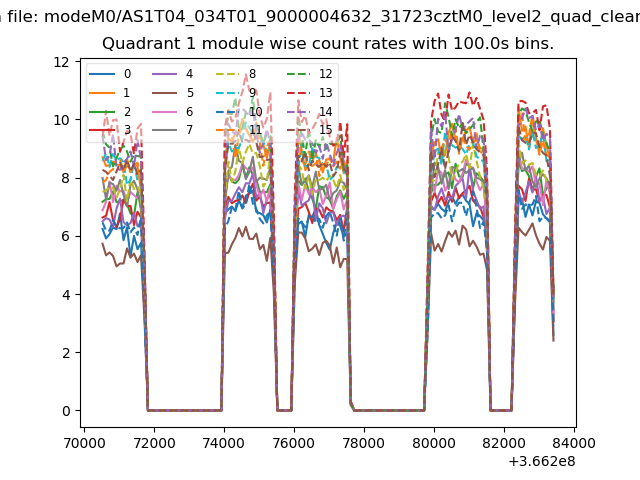
| Module-wise count rates for Quadrant A Data is divided into 100 sec bins |
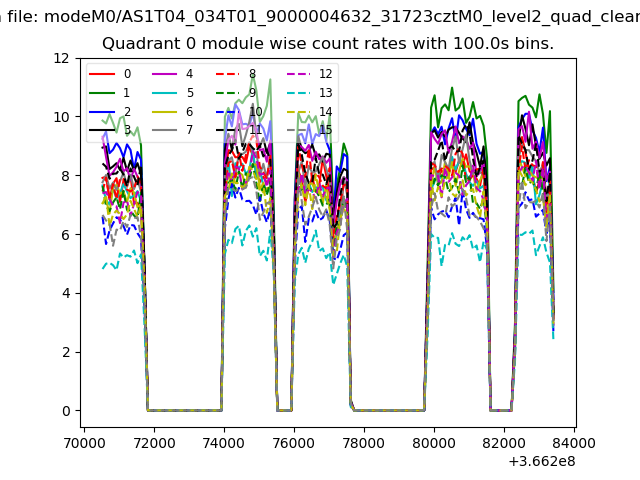 |
 |
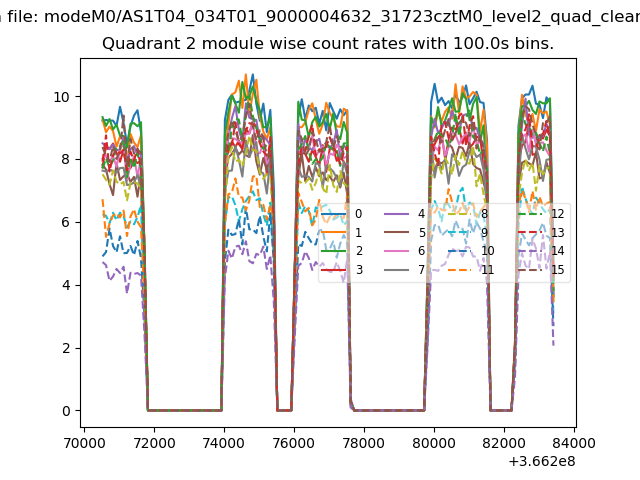
| Module-wise count rates for Quadrant B Data is divided into 100 sec bins |
 |
 |
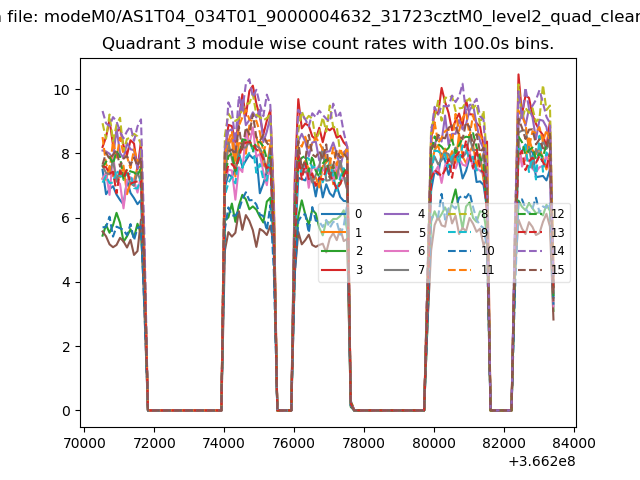
| Module-wise count rates for Quadrant C Data is divided into 100 sec bins |
 |
 |
| Module-wise count rates for Quadrant D Data is divided into 100 sec bins |
 |
 |
| Parameter | Plot |
|---|---|
| CZT HV Monitor | 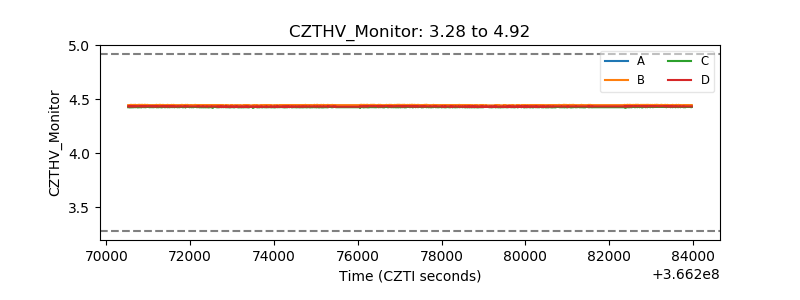 |
| D_VDD | 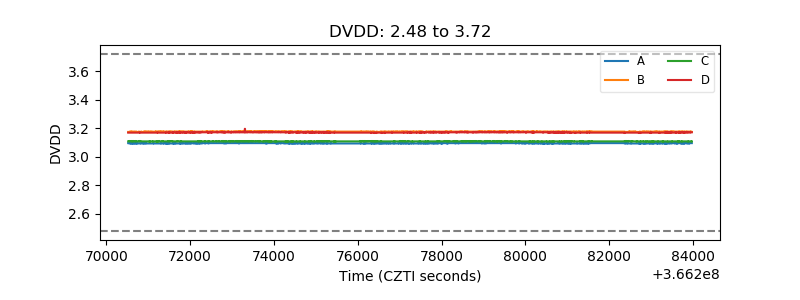 |
| Temperature 1 | 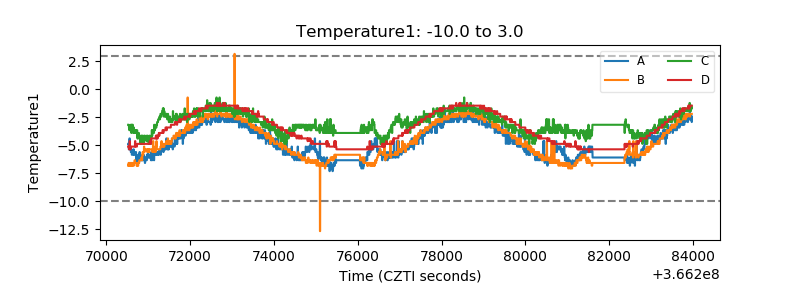 |
| Veto HV Monitor | 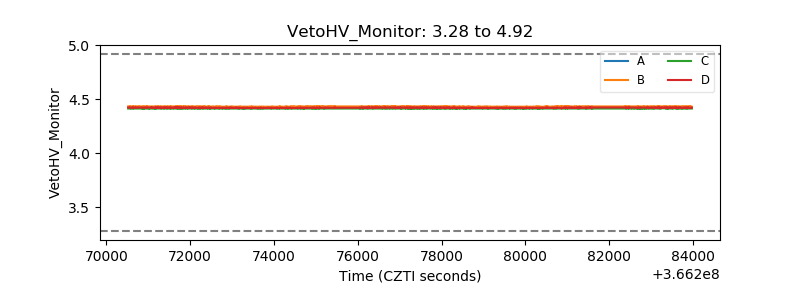 |
| Veto LLD | 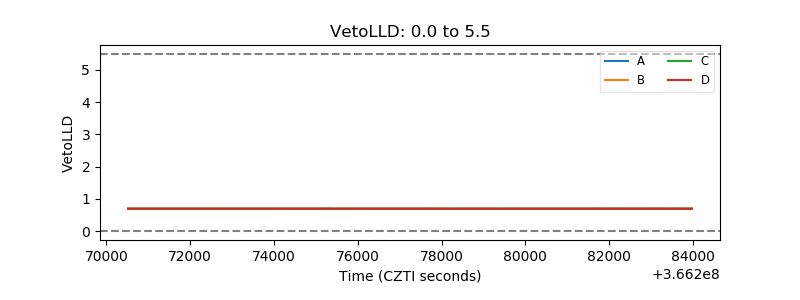 |
| Alpha Counter | 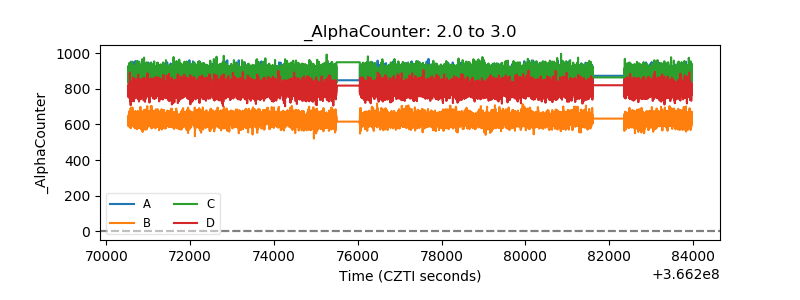 |
| _CPM_Rate | 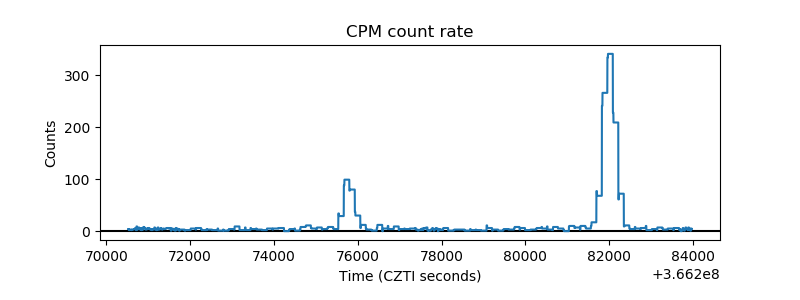 |
| CZT Counter | 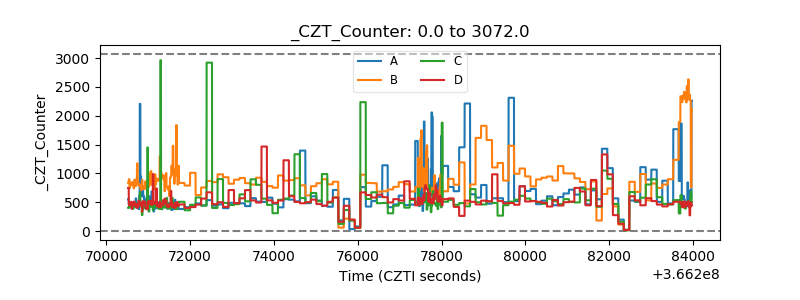 |
| +2.5 Volts monitor | 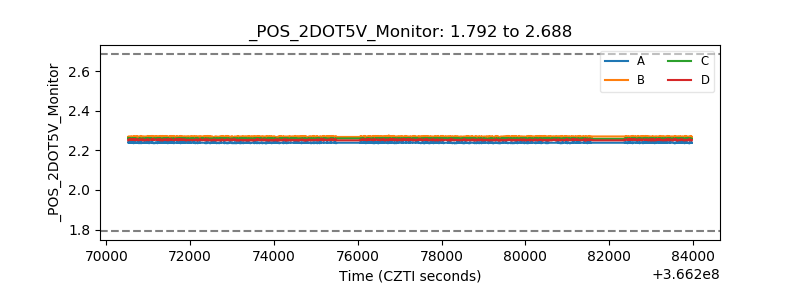 |
| +5 Volts monitor |  |
| _ROLL_ROT | 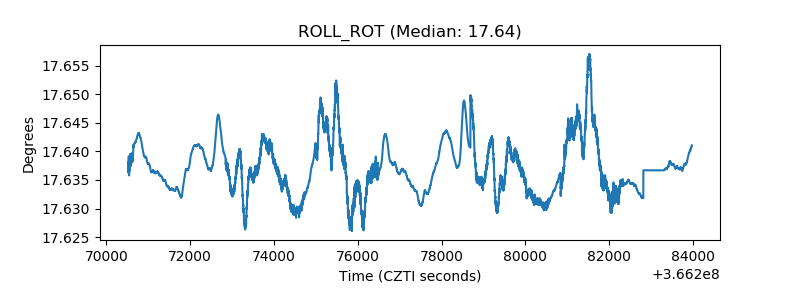 |
| _Roll_DEC | 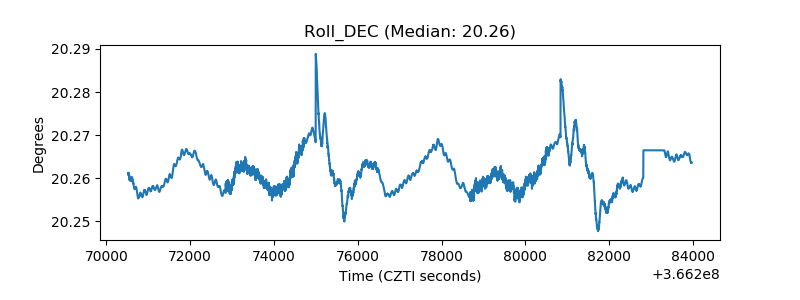 |
| _Roll_RA | 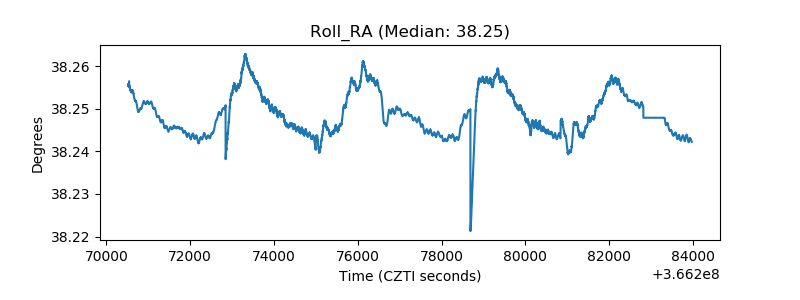 |
| Veto Counter | 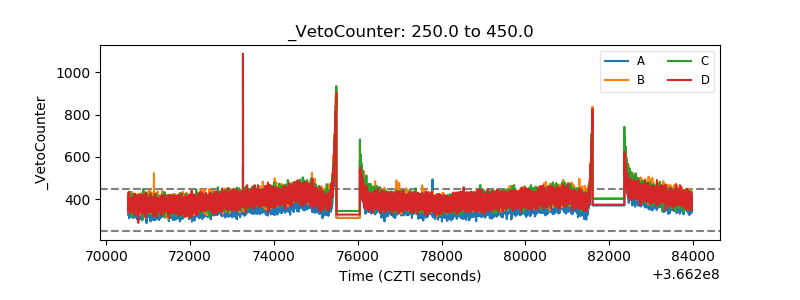 |