| Param | Original file | Final file |
|---|---|---|
| Filename | modeM0/AS1T04_034T01_9000004632_31725cztM0_level2.evt | modeM0/AS1T04_034T01_9000004632_31725cztM0_level2_quad_clean.evt |
| Size (bytes) | 2,800,967,040 | 320,788,800 |
| Size | 2.6 GB | 305.9 MB |
| Events in quadrant A | 19,573,148 | 1,961,671 |
| Events in quadrant B | 29,488,718 | 1,957,633 |
| Events in quadrant C | 16,205,786 | 1,948,052 |
| Events in quadrant D | 17,679,182 | 1,921,140 |
| Mode M9 | |||
|---|---|---|---|
| Quadrant | BADHDUFLAG | Total packets | Discarded packets |
| A | 0 | 38 | 0 |
| B | 0 | 38 | 0 |
| C | 0 | 38 | 0 |
| D | 0 | 38 | 0 |
| Mode SS | |||
|---|---|---|---|
| Quadrant | BADHDUFLAG | Total packets | Discarded packets |
| A | 0 | 568 | 0 |
| B | 0 | 568 | 0 |
| C | 0 | 568 | 0 |
| D | 0 | 568 | 0 |
| Mode M0 | |||
|---|---|---|---|
| Quadrant | BADHDUFLAG | Total packets | Discarded packets |
| A | 0 | 76120 | 5 |
| B | 0 | 106749 | 5 |
| C | 0 | 65374 | 5 |
| D | 0 | 70733 | 5 |
| Quadrant | Total seconds | Saturated seconds | Saturation percentage |
|---|---|---|---|
| A | 28013 | 1860 | 6.639774% |
| B | 28014 | 3132 | 11.180124% |
| C | 28014 | 947 | 3.380453% |
| D | 28014 | 770 | 2.748626% |
Noise dominated data is calculated using 1-second bins in cleaned event files. If a bin has >2000 counts, and if more than 50% of those come from <1% of pixels, then it is considered to be noise-dominated and hence unusable.
| Quadrant | # 1 sec bins | Bins with >0 counts | Bins with >2000 counts | High rate bins dominated by noise | Noise dominated (total time) | Noise dominated (detector-on time) | Marked lightcurve |
|---|---|---|---|---|---|---|---|
| A | 31723 | 28018 | 1074 | 1074 | 3.39% | 3.83% | 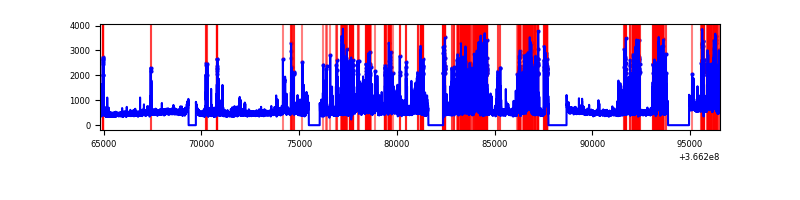 |
| B | 31724 | 28019 | 1594 | 1594 | 5.02% | 5.69% | 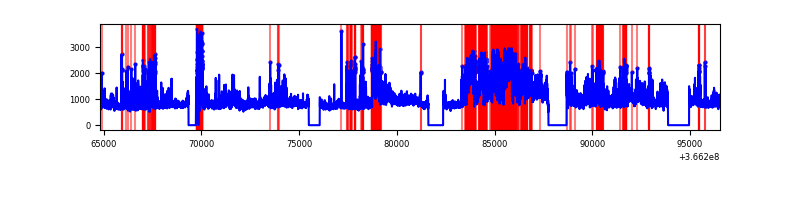 |
| C | 31724 | 28019 | 311 | 311 | 0.98% | 1.11% | 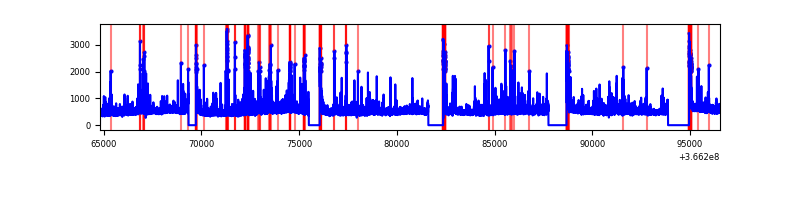 |
| D | 31724 | 28019 | 534 | 534 | 1.68% | 1.91% | 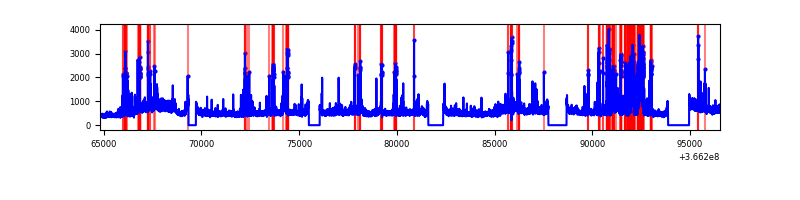 |
Top three noisy pixels from each quadrant. If the there are fewer than three noisy pixels in the level2.evt file, extra rows are filled as -1
| Pixel properties | Quadrant properties | ||||||
|---|---|---|---|---|---|---|---|
| Quadrant | DetID | PixID | Counts | Sigma | Mean | Median | Sigma |
| A | 0 | 13 | 6445366 | 9487.29 | 3401 | 3332 | 679.0 |
| A | 13 | 254 | 50744 | 69.82 | 3401 | 3332 | 679.0 |
| A | 3 | 137 | 34916 | 46.51 | 3401 | 3332 | 679.0 |
| B | 4 | 80 | 8168047 | 12939.96 | 3318 | 3235 | 631.0 |
| B | 6 | 159 | 7324926 | 11603.74 | 3318 | 3235 | 631.0 |
| B | 10 | 245 | 412609 | 648.79 | 3318 | 3235 | 631.0 |
| C | 0 | 10 | 2270455 | 2918.86 | 3301 | 3320 | 776.7 |
| C | 14 | 238 | 529607 | 677.58 | 3301 | 3320 | 776.7 |
| C | 3 | 233 | 208307 | 263.91 | 3301 | 3320 | 776.7 |
| D | 8 | 195 | 2447195 | 3071.76 | 3360 | 3269 | 795.6 |
| D | 12 | 233 | 1559598 | 1956.15 | 3360 | 3269 | 795.6 |
| D | 12 | 227 | 409695 | 510.84 | 3360 | 3269 | 795.6 |
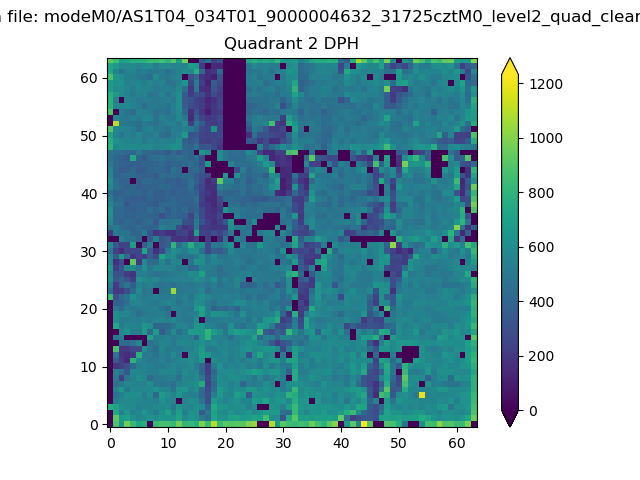
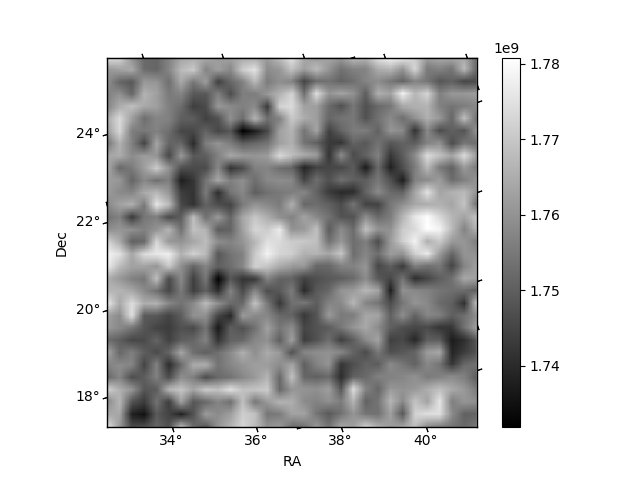
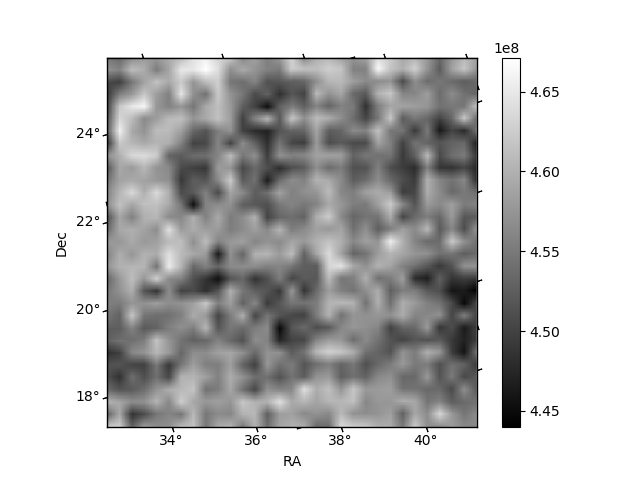
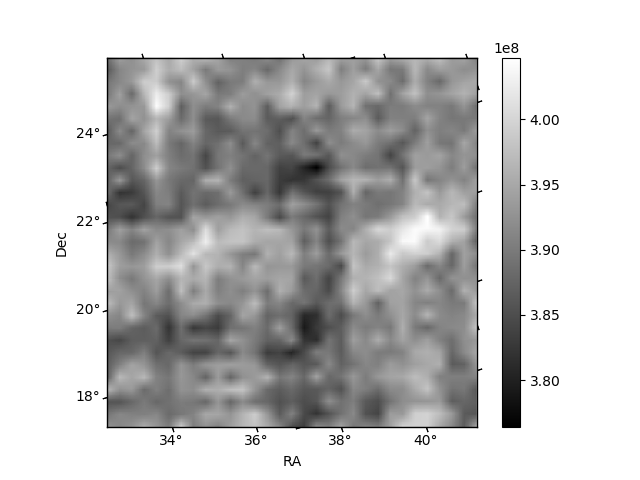
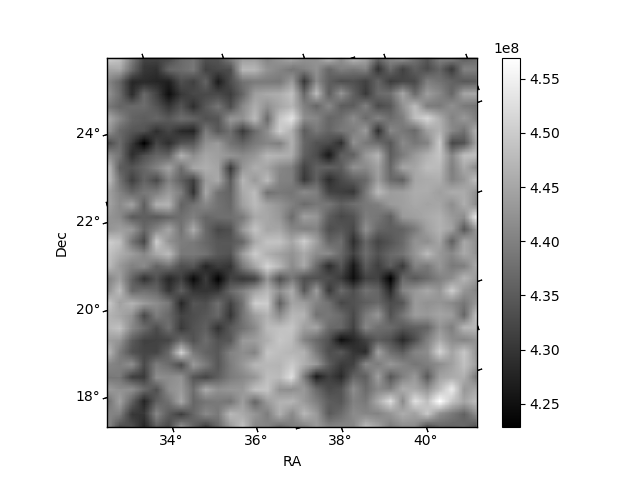
Histogram calculated using DETX and DETY for each event in the final _common_clean file
| Quadrant A | 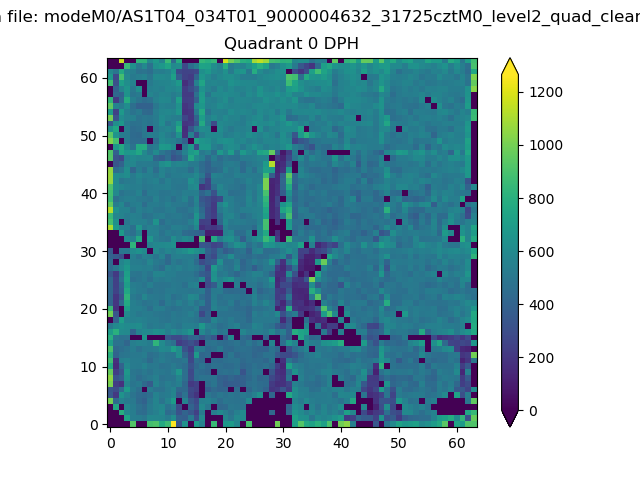 |
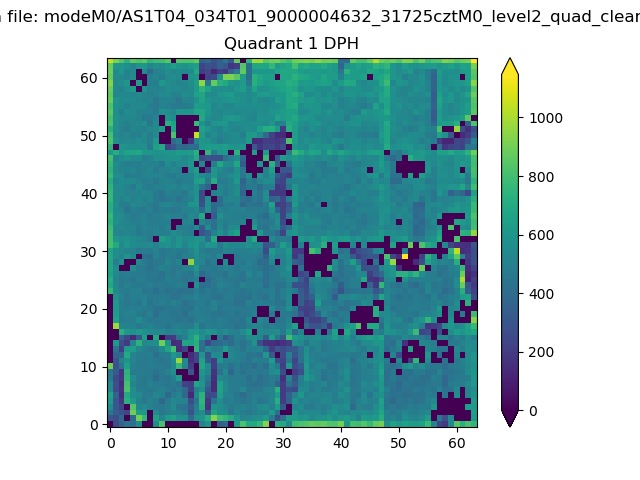 |
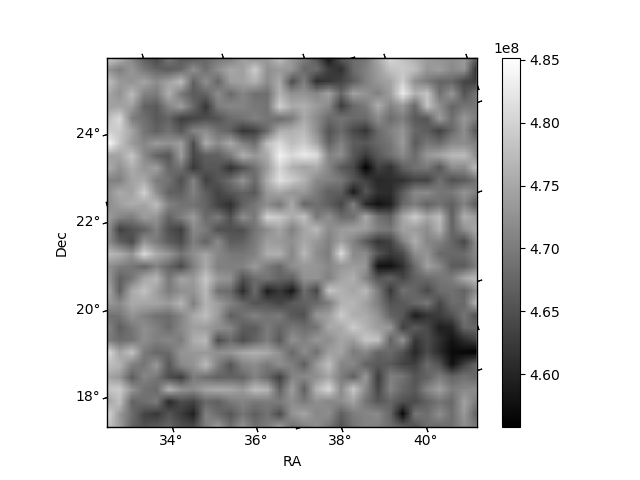
Quadrant B |
|---|---|---|---|
| Quadrant D | 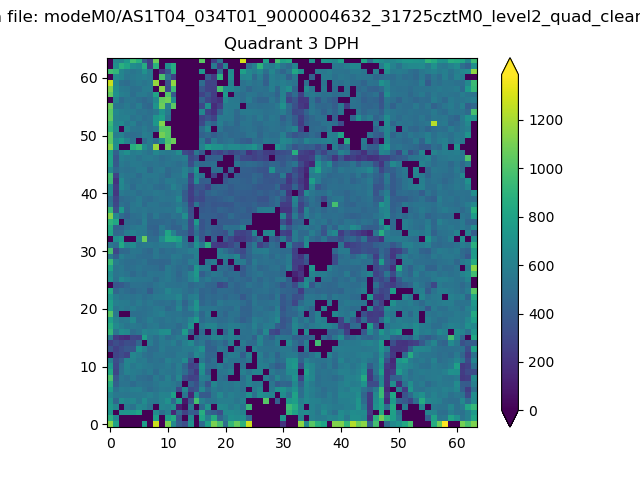 |
 |
Quadrant C |
| Plot type | Count rate plots | Images |
|---|---|---|
| Comparison with Poisson distribution Blue bars denote a histogram of data divided into 1 sec bins. Red curve is a Poisson curve with rate = median count rate of data. |
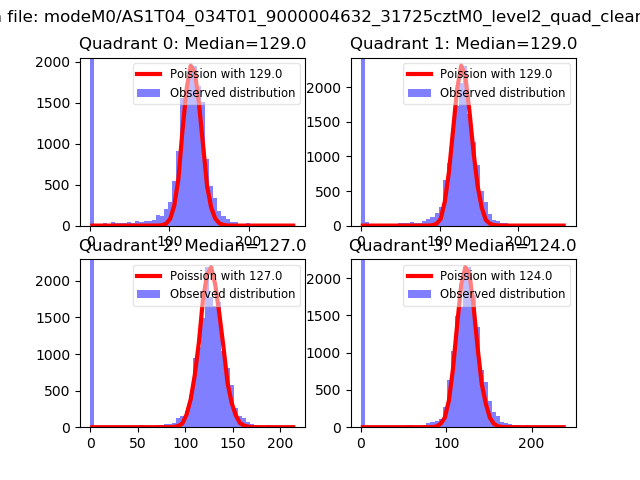 |
 |
| Quadrant-wise count rates Data is divided into 100 sec bins |
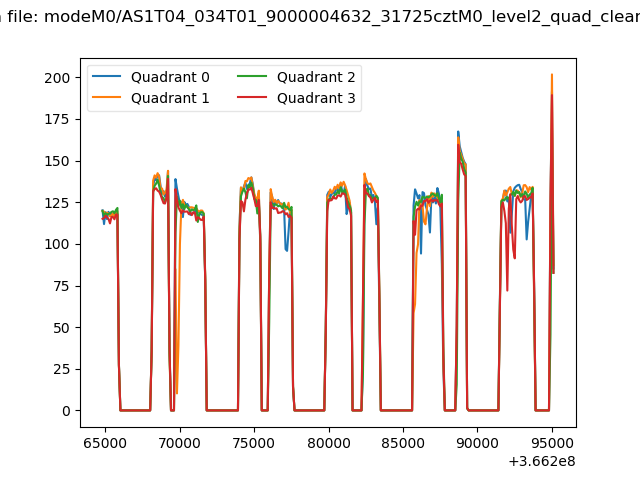 |
|
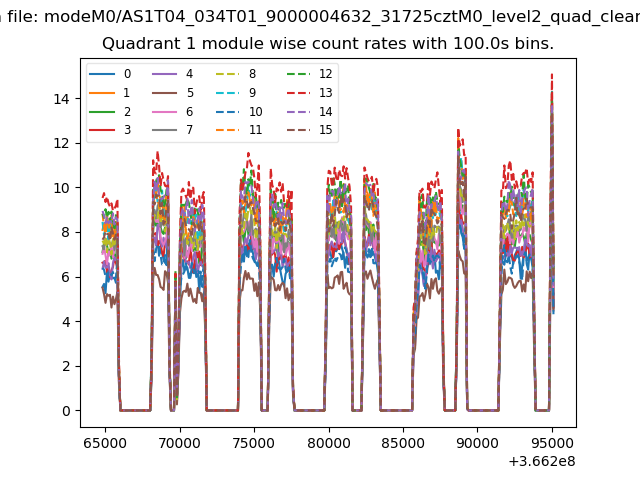
| Module-wise count rates for Quadrant A Data is divided into 100 sec bins |
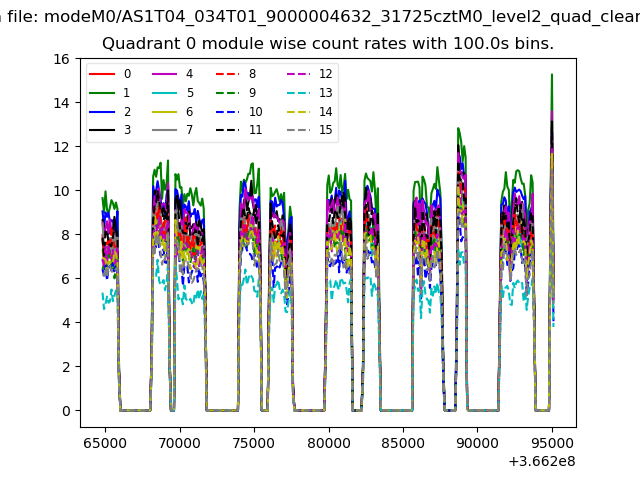 |
 |
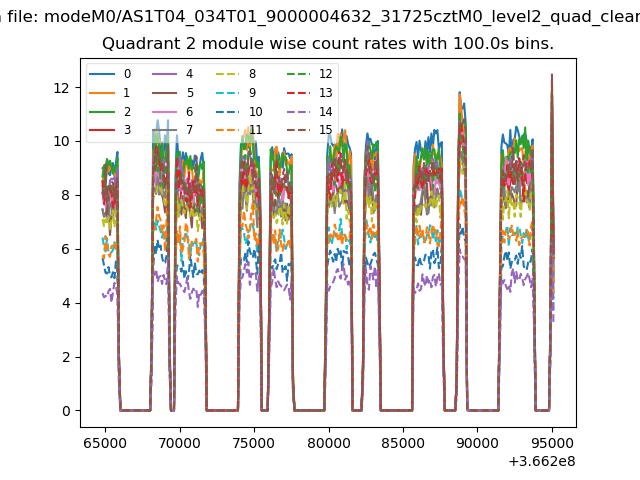
| Module-wise count rates for Quadrant B Data is divided into 100 sec bins |
 |
 |
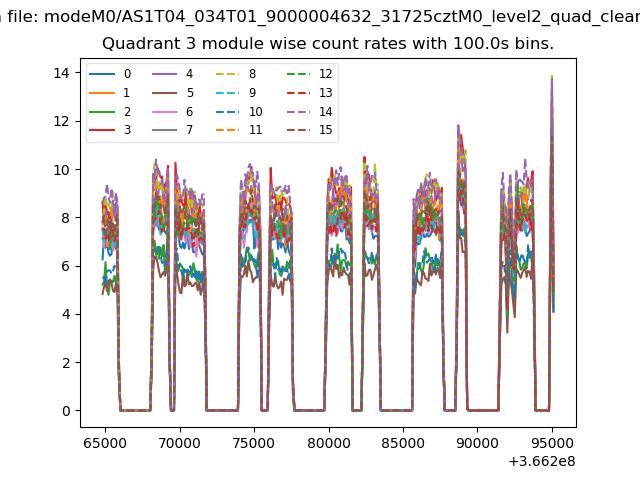
| Module-wise count rates for Quadrant C Data is divided into 100 sec bins |
 |
 |
| Module-wise count rates for Quadrant D Data is divided into 100 sec bins |
 |
 |
| Parameter | Plot |
|---|---|
| CZT HV Monitor | 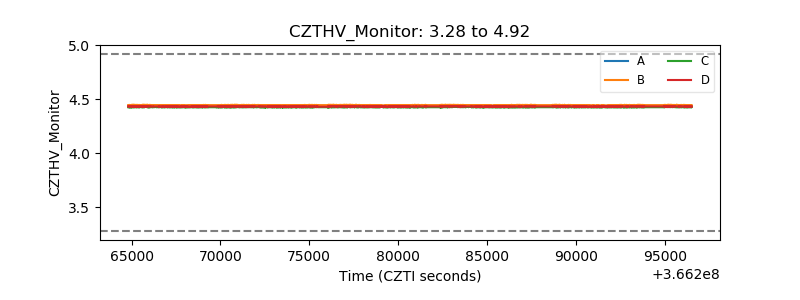 |
| D_VDD | 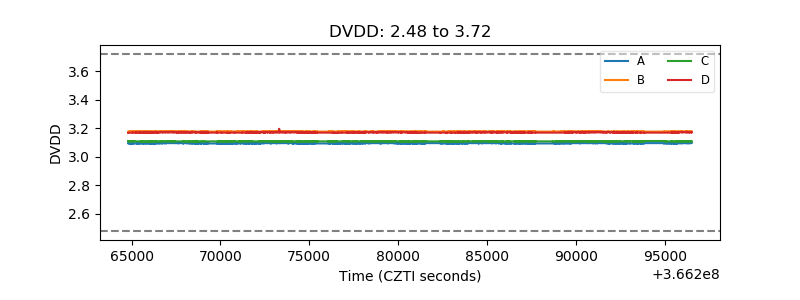 |
| Temperature 1 | 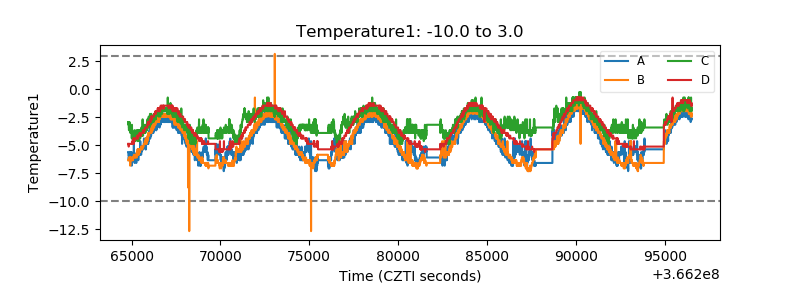 |
| Veto HV Monitor | 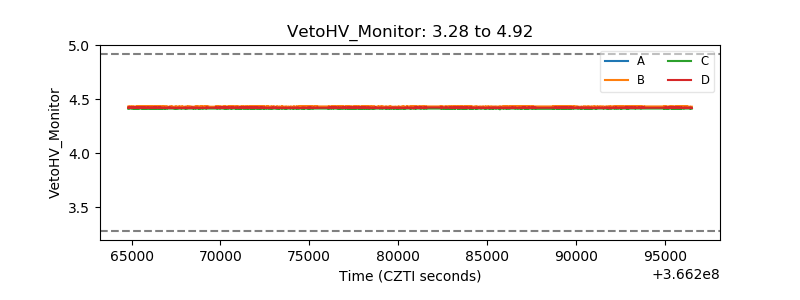 |
| Veto LLD | 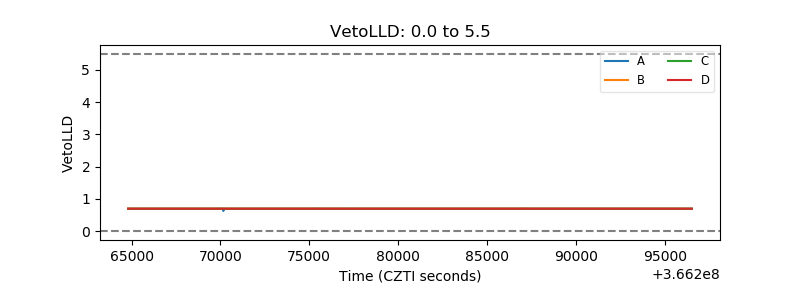 |
| Alpha Counter | 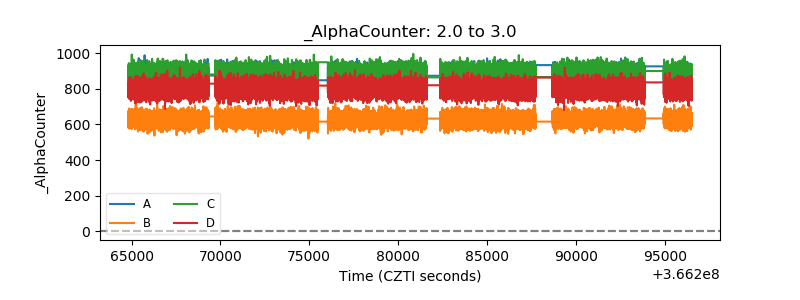 |
| _CPM_Rate | 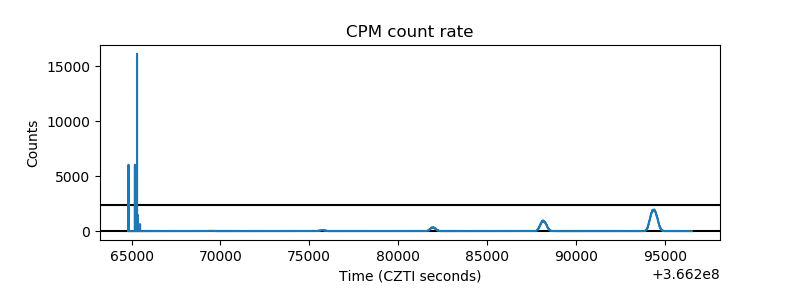 |
| CZT Counter | 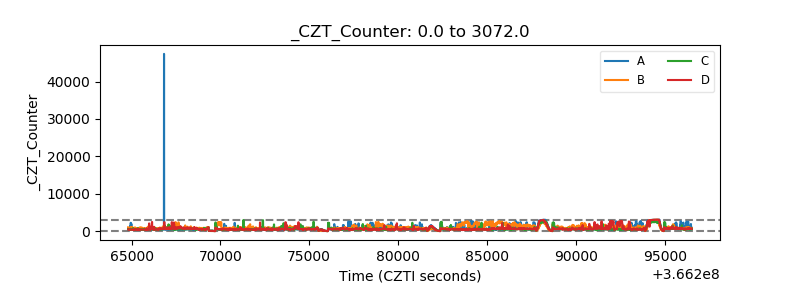 |
| +2.5 Volts monitor | 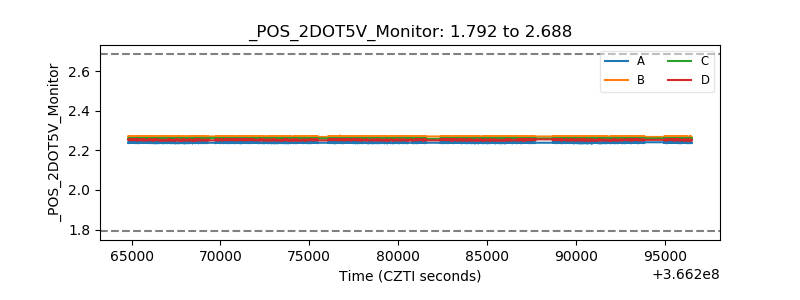 |
| +5 Volts monitor |  |
| _ROLL_ROT | 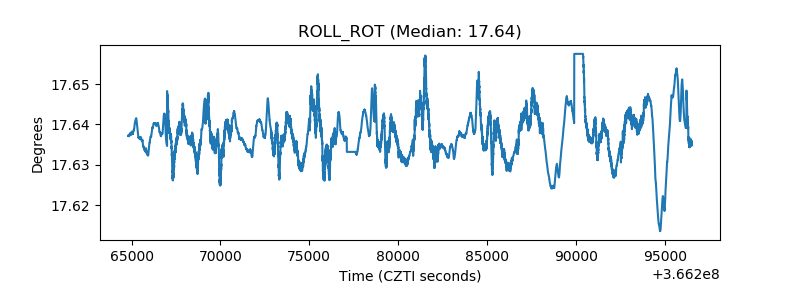 |
| _Roll_DEC | 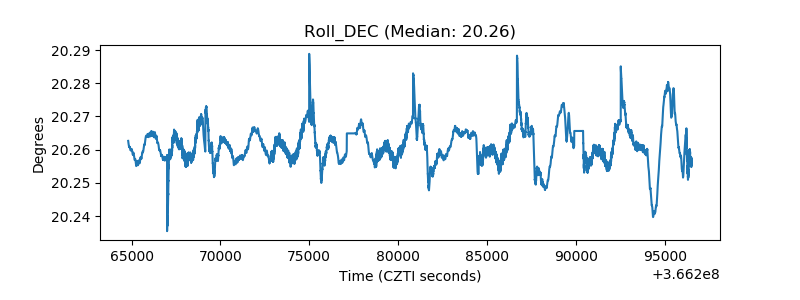 |
| _Roll_RA | 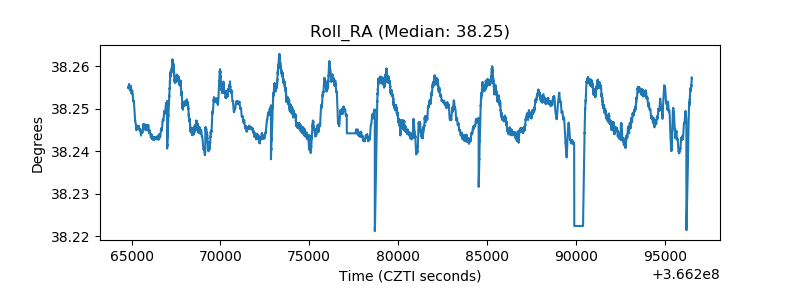 |
| Veto Counter | 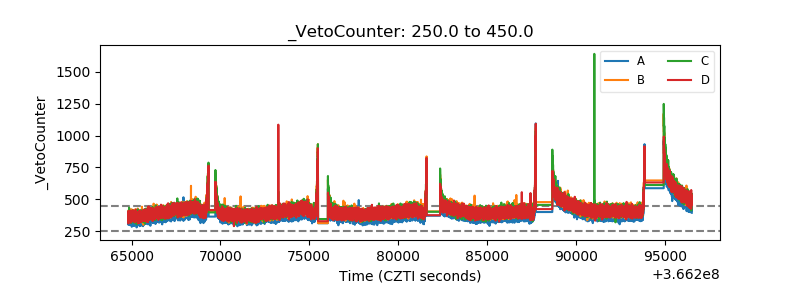 |