| Param | Original file | Final file |
|---|---|---|
| Filename | modeM0/AS1T04_034T01_9000004632_31727cztM0_level2.evt | modeM0/AS1T04_034T01_9000004632_31727cztM0_level2_quad_clean.evt |
| Size (bytes) | 740,157,120 | 65,730,240 |
| Size | 705.9 MB | 62.7 MB |
| Events in quadrant A | 7,187,717 | 363,960 |
| Events in quadrant B | 6,045,798 | 404,095 |
| Events in quadrant C | 4,028,981 | 385,084 |
| Events in quadrant D | 4,718,528 | 386,625 |
| Mode M9 | |||
|---|---|---|---|
| Quadrant | BADHDUFLAG | Total packets | Discarded packets |
| A | 0 | 13 | 0 |
| B | 0 | 13 | 0 |
| C | 0 | 13 | 0 |
| D | 0 | 13 | 0 |
| Mode SS | |||
|---|---|---|---|
| Quadrant | BADHDUFLAG | Total packets | Discarded packets |
| A | 0 | 128 | 0 |
| B | 0 | 128 | 0 |
| C | 0 | 128 | 0 |
| D | 0 | 128 | 0 |
| Mode M0 | |||
|---|---|---|---|
| Quadrant | BADHDUFLAG | Total packets | Discarded packets |
| A | 0 | 26021 | 2 |
| B | 0 | 22195 | 2 |
| C | 0 | 16178 | 2 |
| D | 0 | 18674 | 2 |
| Quadrant | Total seconds | Saturated seconds | Saturation percentage |
|---|---|---|---|
| A | 6458 | 1233 | 19.092598% |
| B | 6458 | 368 | 5.698359% |
| C | 6458 | 307 | 4.753794% |
| D | 6459 | 112 | 1.734015% |
Noise dominated data is calculated using 1-second bins in cleaned event files. If a bin has >2000 counts, and if more than 50% of those come from <1% of pixels, then it is considered to be noise-dominated and hence unusable.
| Quadrant | # 1 sec bins | Bins with >0 counts | Bins with >2000 counts | High rate bins dominated by noise | Noise dominated (total time) | Noise dominated (detector-on time) | Marked lightcurve |
|---|---|---|---|---|---|---|---|
| A | 7683 | 6459 | 809 | 809 | 10.53% | 12.53% |  |
| B | 7683 | 6459 | 122 | 122 | 1.59% | 1.89% | 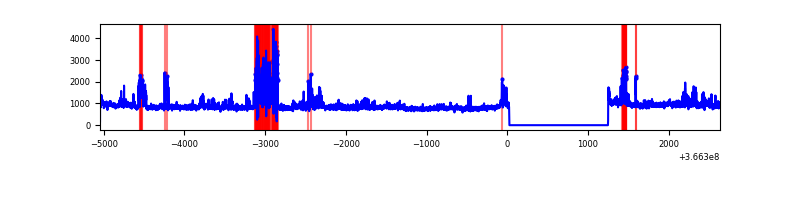 |
| C | 7683 | 6459 | 120 | 120 | 1.56% | 1.86% | 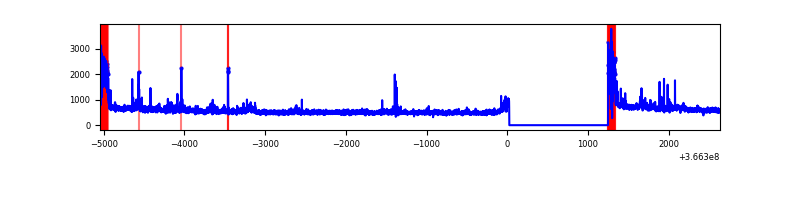 |
| D | 7684 | 6460 | 43 | 43 | 0.56% | 0.67% | 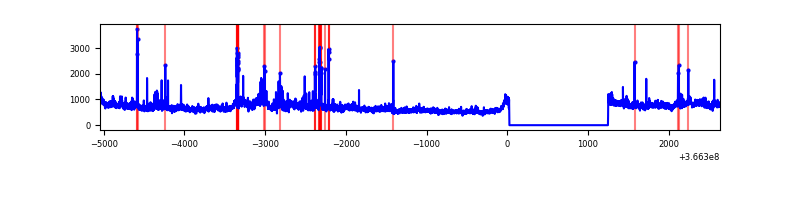 |
Top three noisy pixels from each quadrant. If the there are fewer than three noisy pixels in the level2.evt file, extra rows are filled as -1
| Pixel properties | Quadrant properties | ||||||
|---|---|---|---|---|---|---|---|
| Quadrant | DetID | PixID | Counts | Sigma | Mean | Median | Sigma |
| A | 0 | 13 | 3988201 | 24571.65 | 829 | 818 | 162.3 |
| A | 13 | 254 | 11209 | 64.03 | 829 | 818 | 162.3 |
| A | 3 | 137 | 7654 | 42.13 | 829 | 818 | 162.3 |
| B | 6 | 159 | 1716290 | 10354.31 | 880 | 860 | 165.7 |
| B | 4 | 80 | 660136 | 3979.38 | 880 | 860 | 165.7 |
| B | 0 | 229 | 124700 | 747.5 | 880 | 860 | 165.7 |
| C | 0 | 10 | 504689 | 2569.72 | 850 | 859 | 196.1 |
| C | 14 | 238 | 138672 | 702.9 | 850 | 859 | 196.1 |
| C | 3 | 233 | 33605 | 167.02 | 850 | 859 | 196.1 |
| D | 8 | 195 | 1111658 | 5336.6 | 884 | 865 | 208.1 |
| D | 13 | 249 | 106398 | 507.01 | 884 | 865 | 208.1 |
| D | 12 | 233 | 99531 | 474.02 | 884 | 865 | 208.1 |
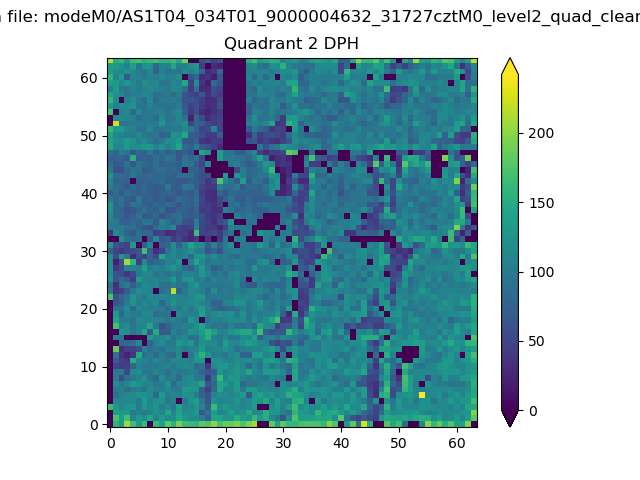
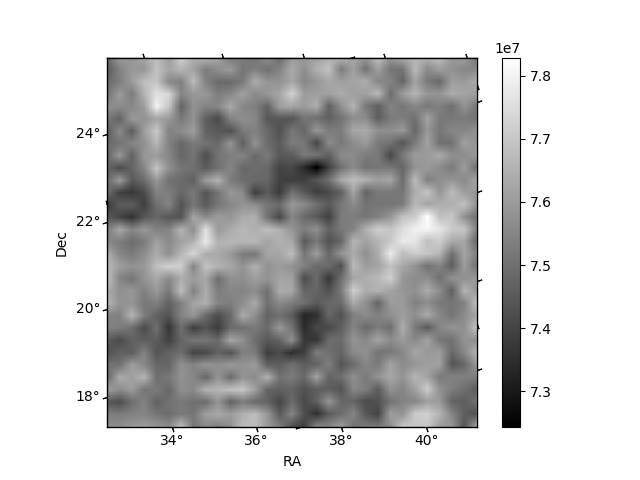
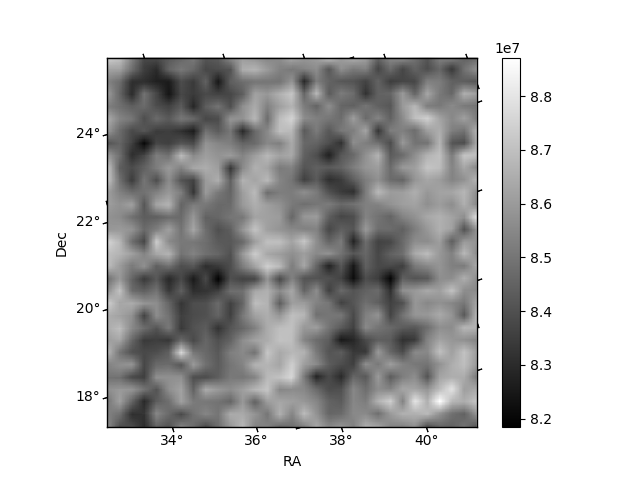
Histogram calculated using DETX and DETY for each event in the final _common_clean file
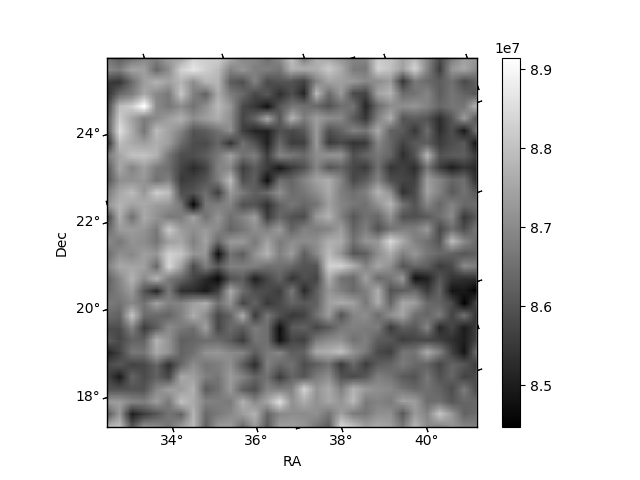
| Quadrant A | 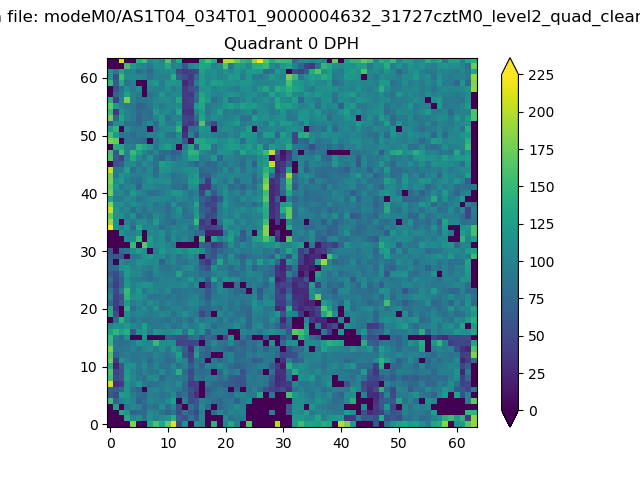 |
 |
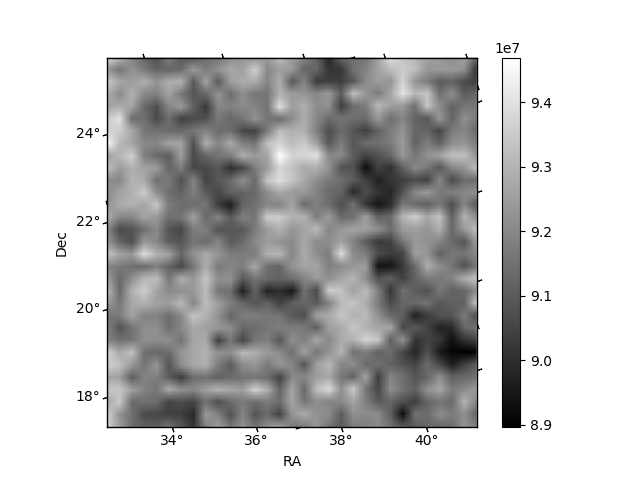
Quadrant B |
|---|---|---|---|
| Quadrant D |  |
 |
Quadrant C |
| Plot type | Count rate plots | Images |
|---|---|---|
| Comparison with Poisson distribution Blue bars denote a histogram of data divided into 1 sec bins. Red curve is a Poisson curve with rate = median count rate of data. |
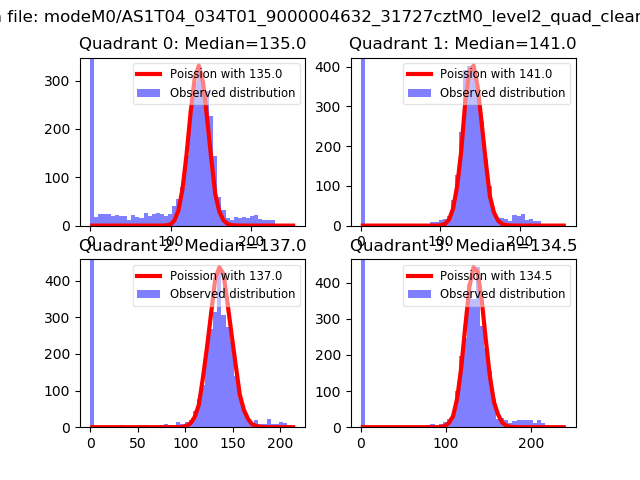 |
 |
| Quadrant-wise count rates Data is divided into 100 sec bins |
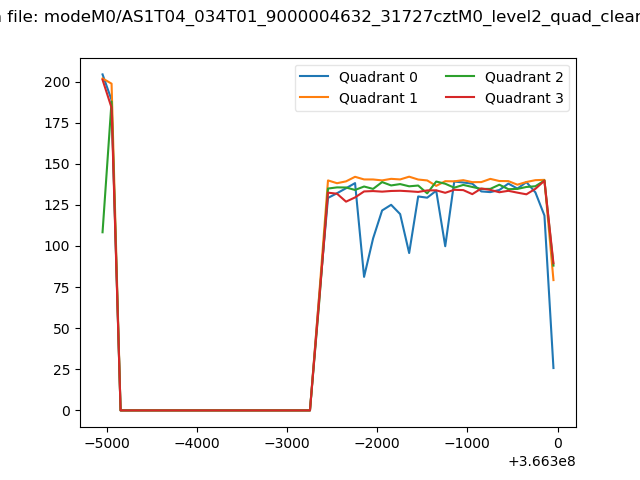 |
|
| Module-wise count rates for Quadrant A Data is divided into 100 sec bins |
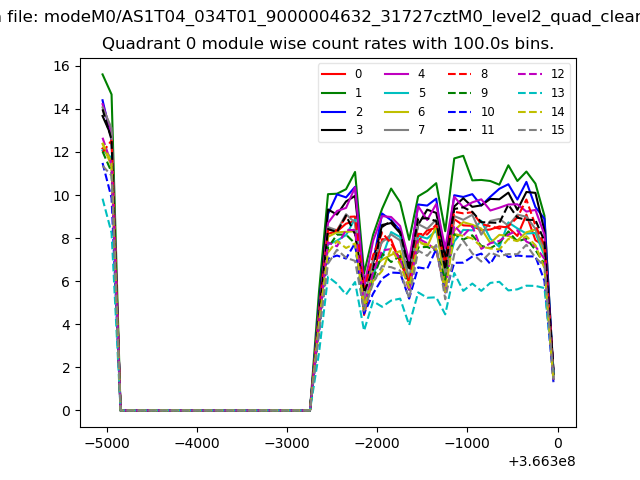 |
 |
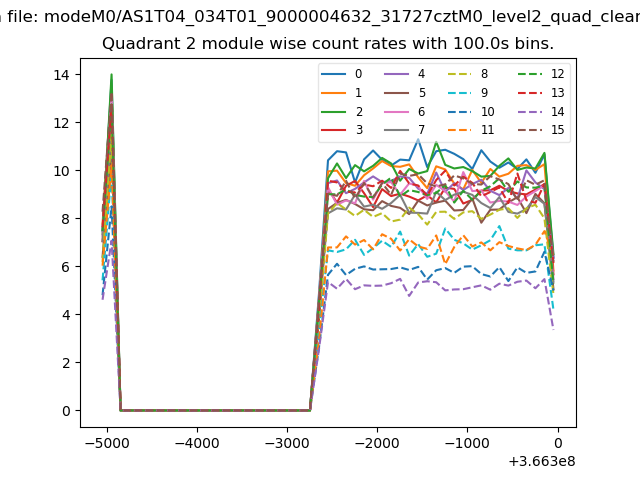
| Module-wise count rates for Quadrant B Data is divided into 100 sec bins |
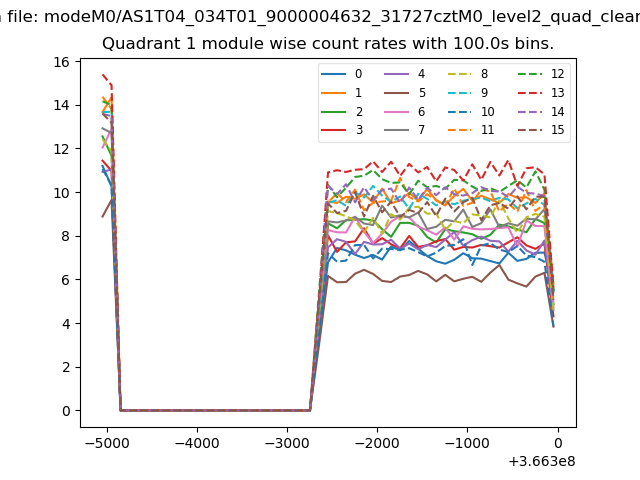 |
 |
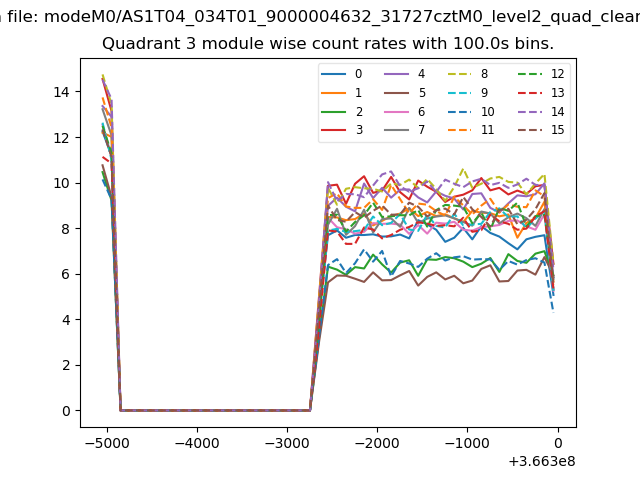
| Module-wise count rates for Quadrant C Data is divided into 100 sec bins |
 |
 |
| Module-wise count rates for Quadrant D Data is divided into 100 sec bins |
 |
 |
| Parameter | Plot |
|---|---|
| CZT HV Monitor | 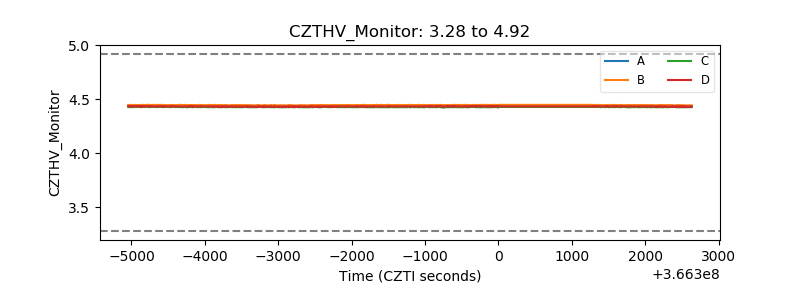 |
| D_VDD | 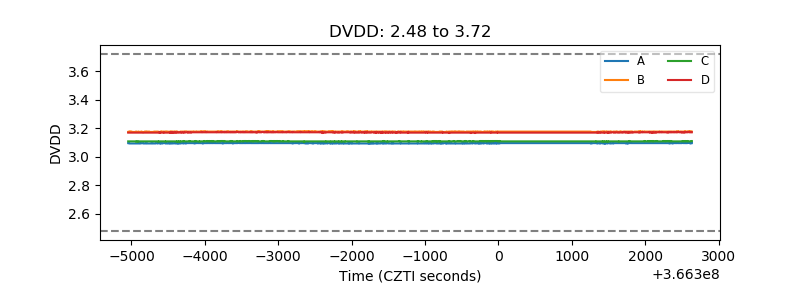 |
| Temperature 1 | 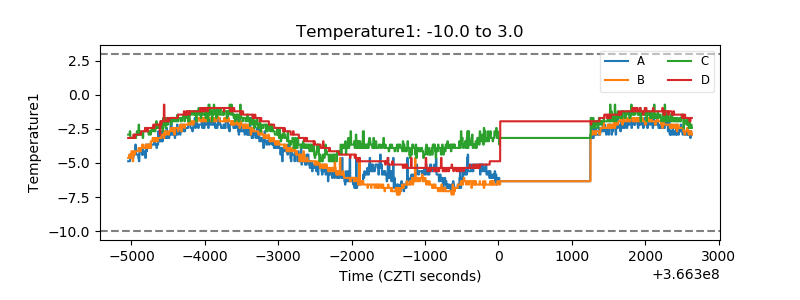 |
| Veto HV Monitor | 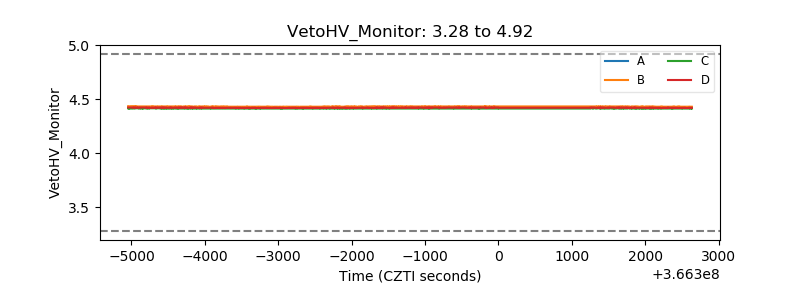 |
| Veto LLD |  |
| Alpha Counter | 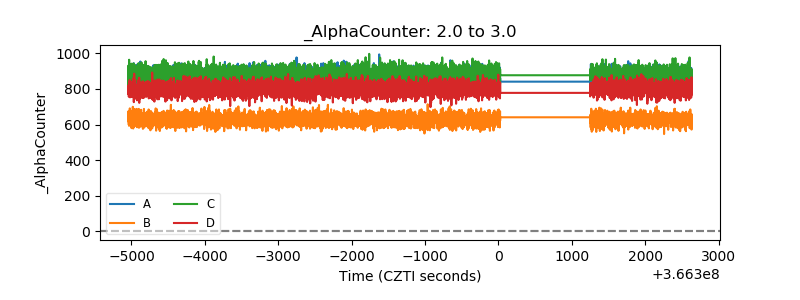 |
| _CPM_Rate | 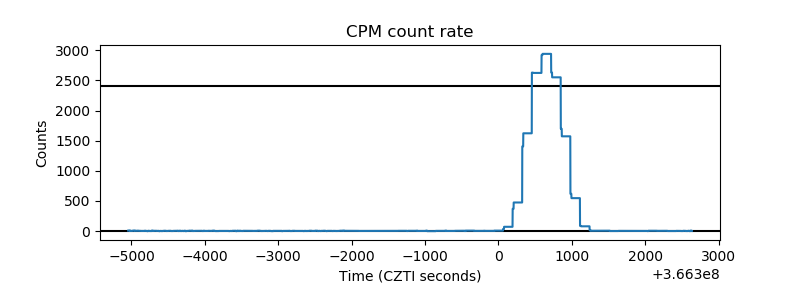 |
| CZT Counter | 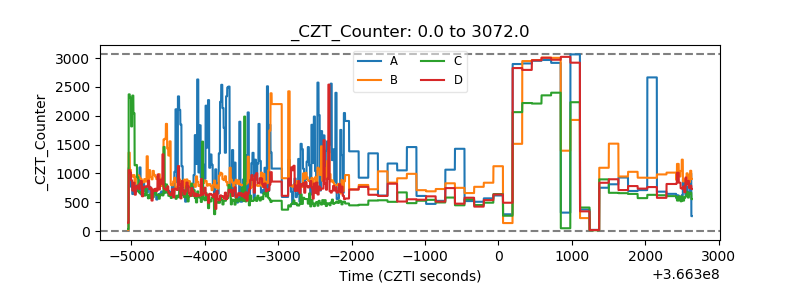 |
| +2.5 Volts monitor |  |
| +5 Volts monitor |  |
| _ROLL_ROT | 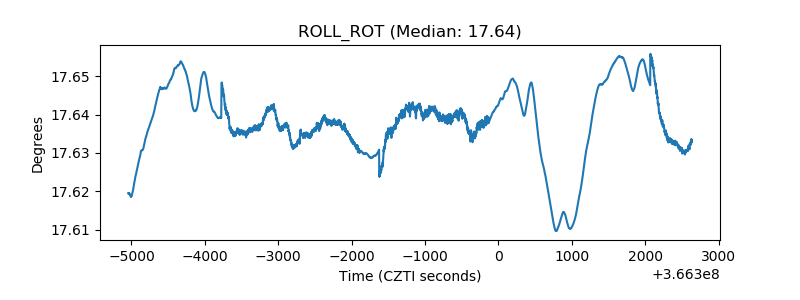 |
| _Roll_DEC | 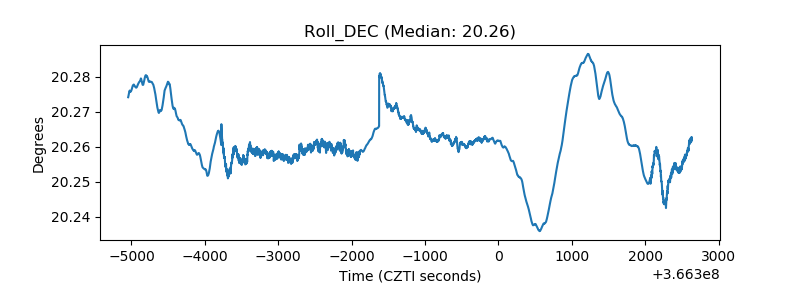 |
| _Roll_RA | 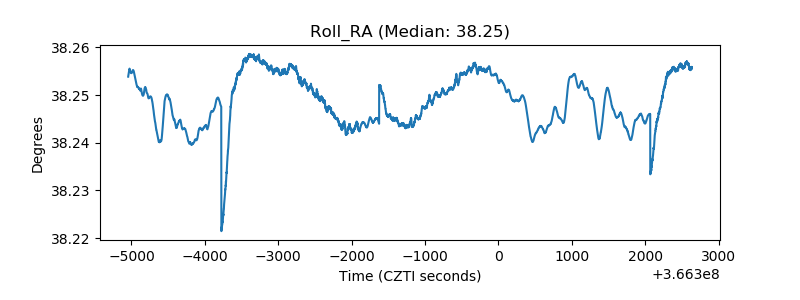 |
| Veto Counter | 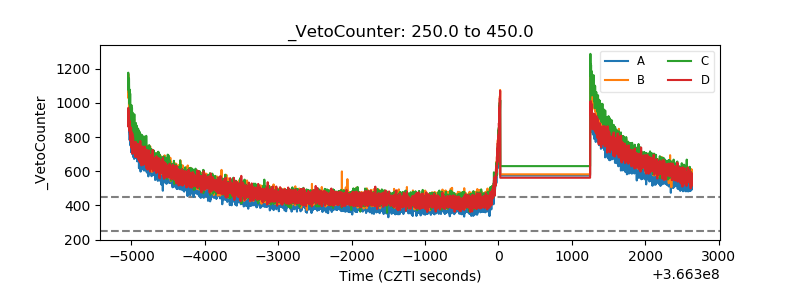 |