| Param | Original file | Final file |
|---|---|---|
| Filename | modeM0/AS1T04_034T01_9000004632_31728cztM0_level2.evt | modeM0/AS1T04_034T01_9000004632_31728cztM0_level2_quad_clean.evt |
| Size (bytes) | 666,777,600 | 70,416,000 |
| Size | 635.9 MB | 67.2 MB |
| Events in quadrant A | 4,972,826 | 427,860 |
| Events in quadrant B | 6,242,728 | 429,757 |
| Events in quadrant C | 4,085,435 | 422,563 |
| Events in quadrant D | 4,472,096 | 417,075 |
| Mode M9 | |||
|---|---|---|---|
| Quadrant | BADHDUFLAG | Total packets | Discarded packets |
| A | 0 | 20 | 0 |
| B | 0 | 21 | 0 |
| C | 0 | 21 | 0 |
| D | 0 | 21 | 0 |
| Mode SS | |||
|---|---|---|---|
| Quadrant | BADHDUFLAG | Total packets | Discarded packets |
| A | 0 | 126 | 0 |
| B | 0 | 126 | 0 |
| C | 0 | 126 | 0 |
| D | 0 | 126 | 0 |
| Mode M0 | |||
|---|---|---|---|
| Quadrant | BADHDUFLAG | Total packets | Discarded packets |
| A | 0 | 19084 | 2 |
| B | 0 | 22695 | 2 |
| C | 0 | 16208 | 2 |
| D | 0 | 17273 | 2 |
| Quadrant | Total seconds | Saturated seconds | Saturation percentage |
|---|---|---|---|
| A | 6233 | 494 | 7.925558% |
| B | 6233 | 350 | 5.615274% |
| C | 6233 | 333 | 5.342532% |
| D | 6233 | 81 | 1.299535% |
Noise dominated data is calculated using 1-second bins in cleaned event files. If a bin has >2000 counts, and if more than 50% of those come from <1% of pixels, then it is considered to be noise-dominated and hence unusable.
| Quadrant | # 1 sec bins | Bins with >0 counts | Bins with >2000 counts | High rate bins dominated by noise | Noise dominated (total time) | Noise dominated (detector-on time) | Marked lightcurve |
|---|---|---|---|---|---|---|---|
| A | 7568 | 6234 | 303 | 303 | 4.00% | 4.86% | 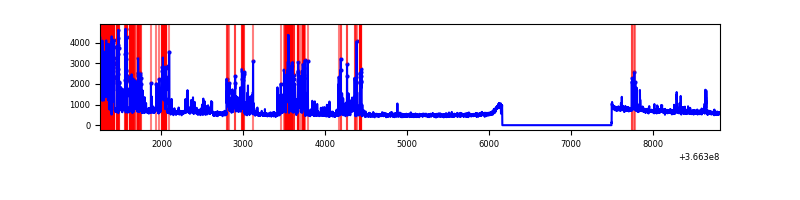 |
| B | 7568 | 6234 | 99 | 99 | 1.31% | 1.59% |  |
| C | 7568 | 6234 | 135 | 135 | 1.78% | 2.17% | 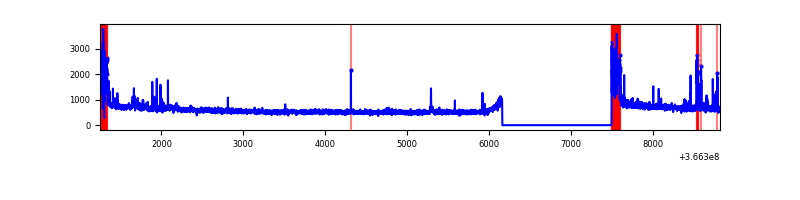 |
| D | 7568 | 6234 | 21 | 21 | 0.28% | 0.34% | 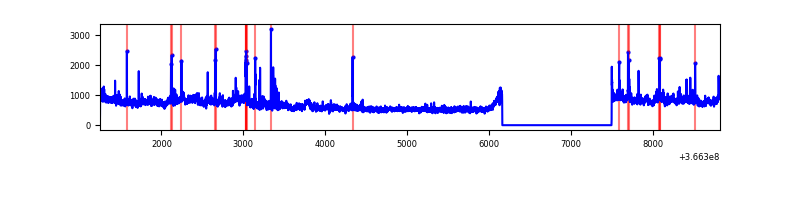 |
Top three noisy pixels from each quadrant. If the there are fewer than three noisy pixels in the level2.evt file, extra rows are filled as -1
| Pixel properties | Quadrant properties | ||||||
|---|---|---|---|---|---|---|---|
| Quadrant | DetID | PixID | Counts | Sigma | Mean | Median | Sigma |
| A | 0 | 13 | 1538897 | 8804.18 | 888 | 875 | 174.7 |
| A | 13 | 254 | 11966 | 63.49 | 888 | 875 | 174.7 |
| A | 3 | 137 | 8111 | 41.42 | 888 | 875 | 174.7 |
| B | 6 | 159 | 1703069 | 10390.88 | 894 | 876 | 163.8 |
| B | 4 | 80 | 765643 | 4668.45 | 894 | 876 | 163.8 |
| B | 0 | 229 | 97132 | 587.59 | 894 | 876 | 163.8 |
| C | 0 | 10 | 508010 | 2549.17 | 865 | 872 | 198.9 |
| C | 14 | 238 | 143808 | 718.48 | 865 | 872 | 198.9 |
| C | 10 | 22 | 22965 | 111.05 | 865 | 872 | 198.9 |
| D | 8 | 195 | 881617 | 4097.24 | 903 | 883 | 215.0 |
| D | 12 | 233 | 82483 | 379.61 | 903 | 883 | 215.0 |
| D | 13 | 249 | 63044 | 289.18 | 903 | 883 | 215.0 |
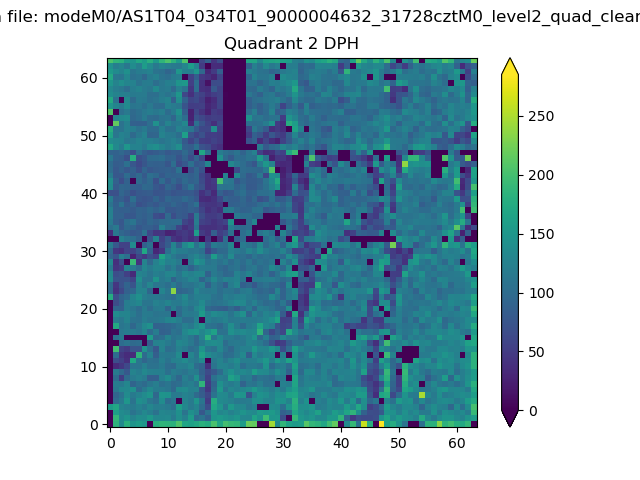
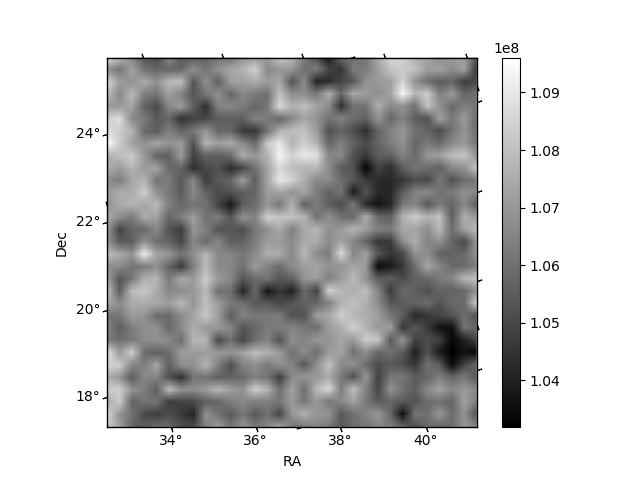
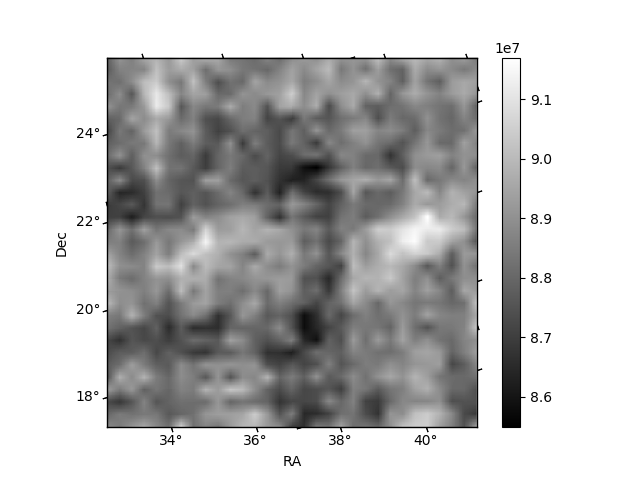
Histogram calculated using DETX and DETY for each event in the final _common_clean file
| Quadrant A | 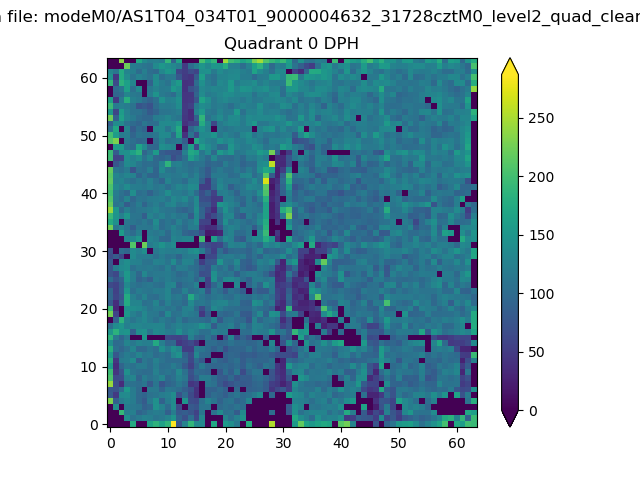 |
 |
Quadrant B |
|---|---|---|---|
| Quadrant D | 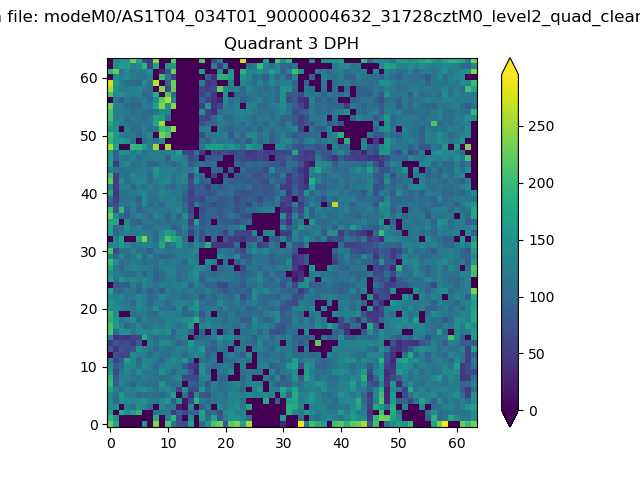 |
 |
Quadrant C |
| Plot type | Count rate plots | Images |
|---|---|---|
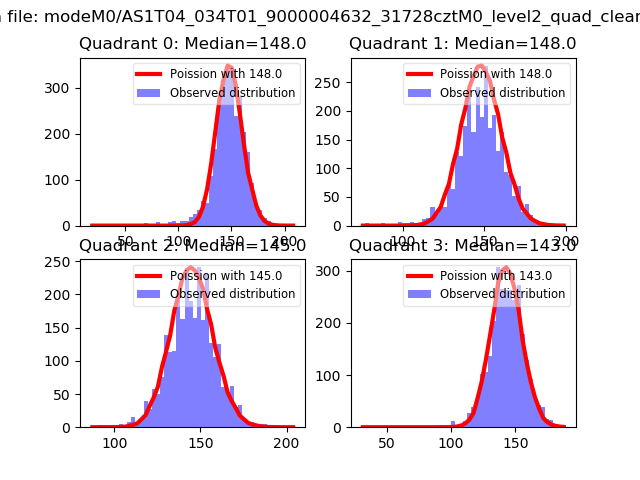
| Comparison with Poisson distribution Blue bars denote a histogram of data divided into 1 sec bins. Red curve is a Poisson curve with rate = median count rate of data. |
 |
 |
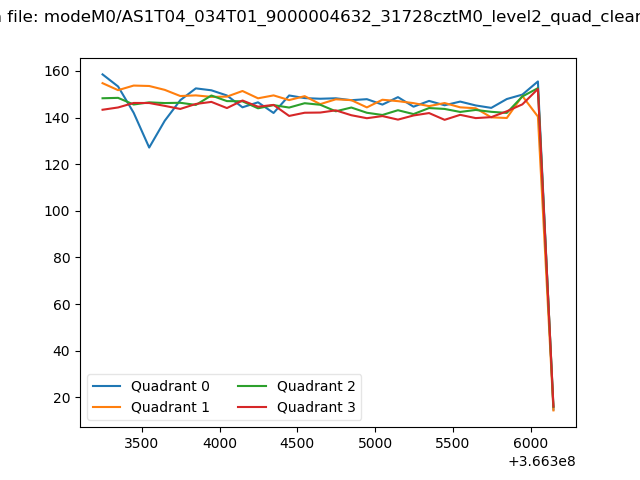
| Quadrant-wise count rates Data is divided into 100 sec bins |
 |
|
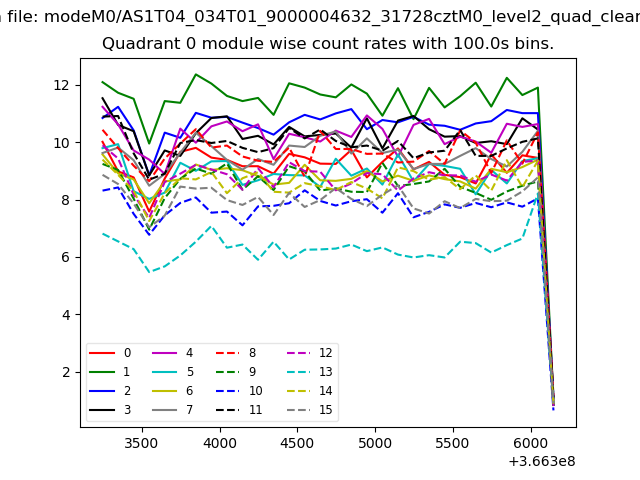
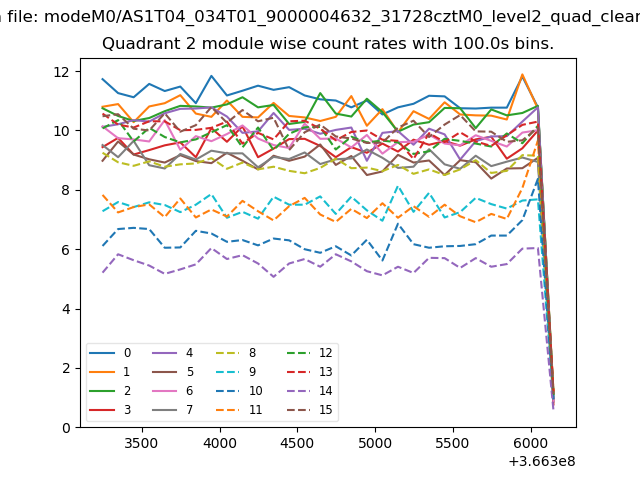
| Module-wise count rates for Quadrant A Data is divided into 100 sec bins |
 |
 |
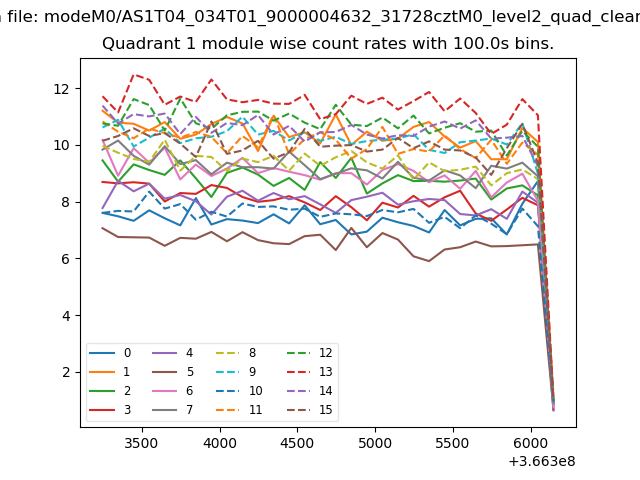
| Module-wise count rates for Quadrant B Data is divided into 100 sec bins |
 |
 |
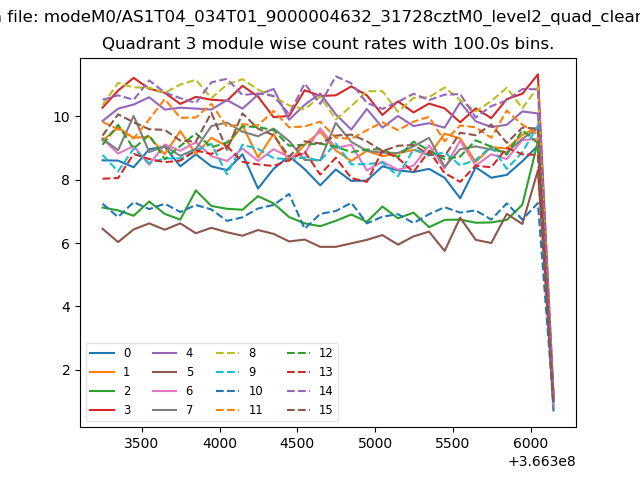
| Module-wise count rates for Quadrant C Data is divided into 100 sec bins |
 |
 |
| Module-wise count rates for Quadrant D Data is divided into 100 sec bins |
 |
 |
| Parameter | Plot |
|---|---|
| CZT HV Monitor | 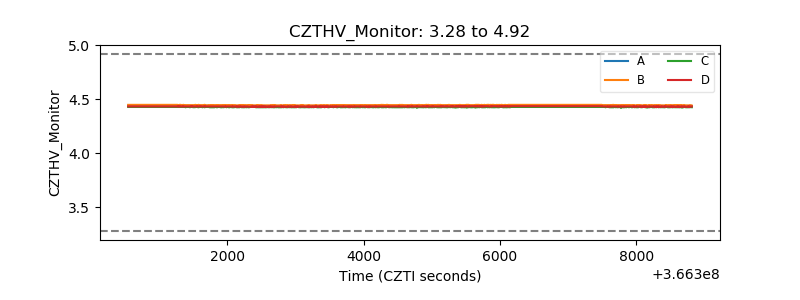 |
| D_VDD | 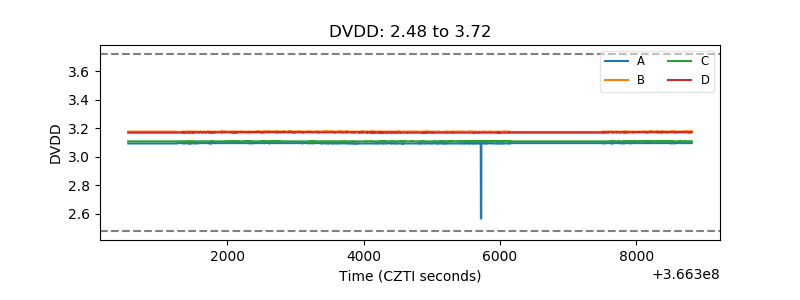 |
| Temperature 1 | 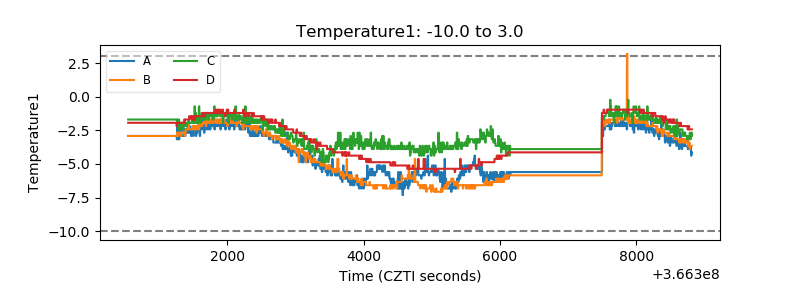 |
| Veto HV Monitor | 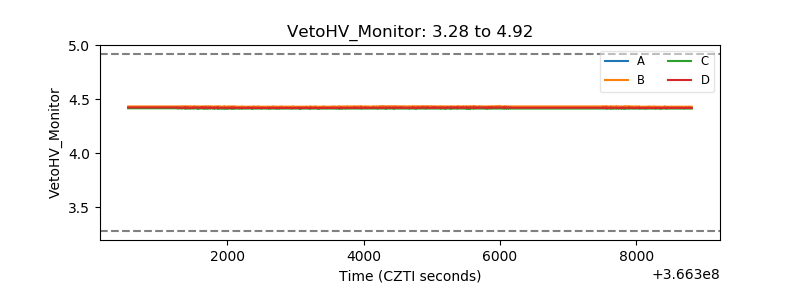 |
| Veto LLD | 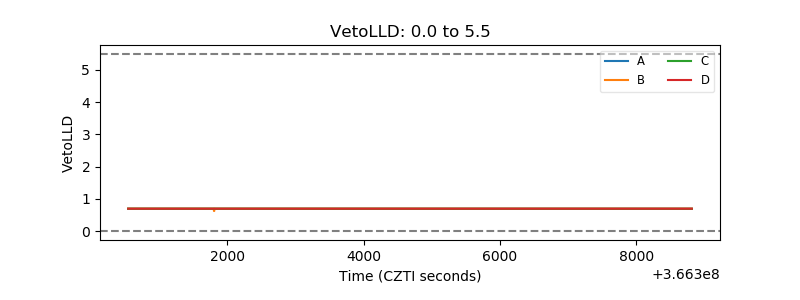 |
| Alpha Counter | 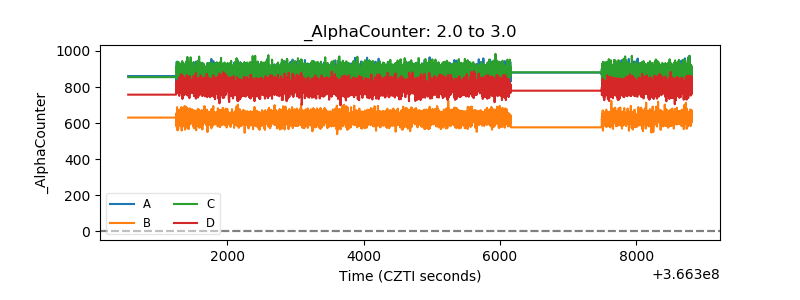 |
| _CPM_Rate | 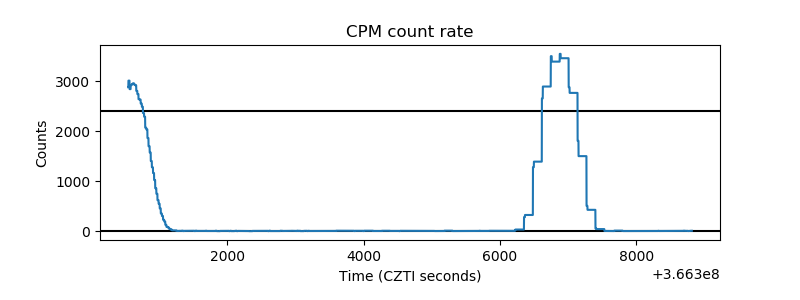 |
| CZT Counter | 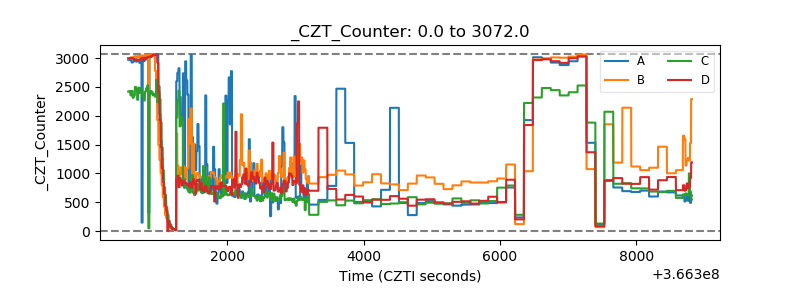 |
| +2.5 Volts monitor |  |
| +5 Volts monitor |  |
| _ROLL_ROT | 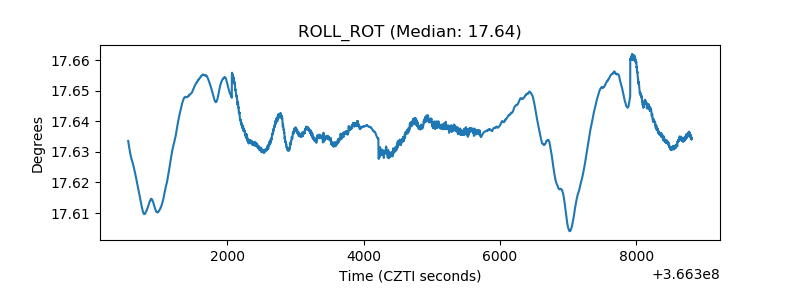 |
| _Roll_DEC | 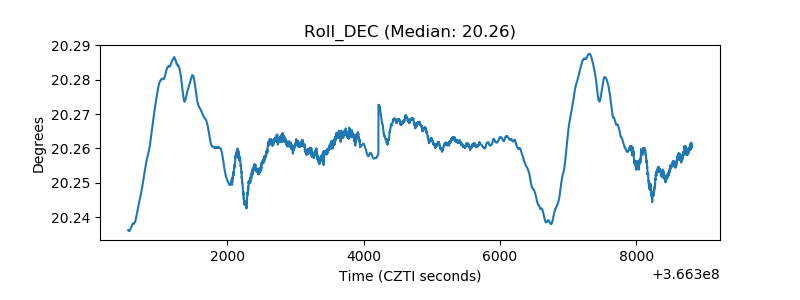 |
| _Roll_RA | 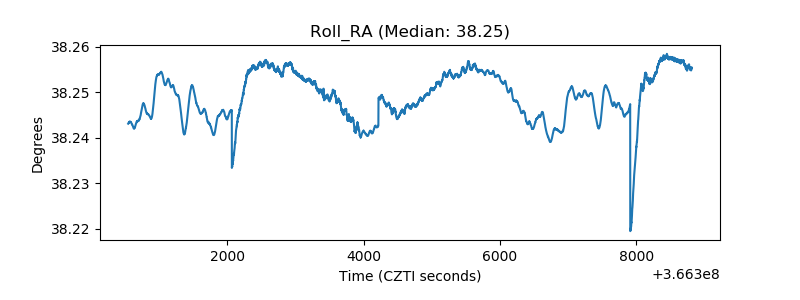 |
| Veto Counter | 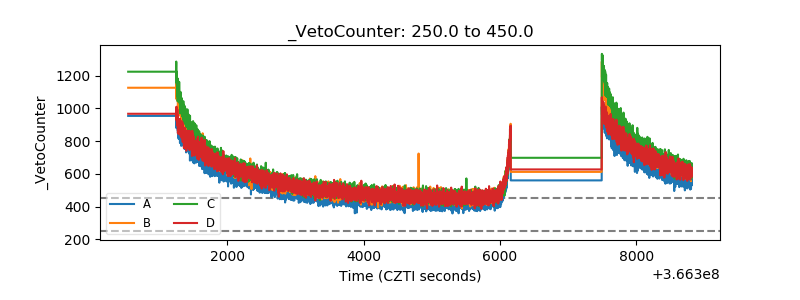 |