| Param | Original file | Final file |
|---|---|---|
| Filename | modeM0/AS1T04_034T01_9000004632_31729cztM0_level2.evt | modeM0/AS1T04_034T01_9000004632_31729cztM0_level2_quad_clean.evt |
| Size (bytes) | 629,599,680 | 78,750,720 |
| Size | 600.4 MB | 75.1 MB |
| Events in quadrant A | 4,427,952 | 500,269 |
| Events in quadrant B | 6,023,198 | 501,312 |
| Events in quadrant C | 4,072,524 | 496,344 |
| Events in quadrant D | 4,158,766 | 487,355 |
| Mode M9 | |||
|---|---|---|---|
| Quadrant | BADHDUFLAG | Total packets | Discarded packets |
| A | 0 | 13 | 0 |
| B | 0 | 13 | 0 |
| C | 0 | 13 | 0 |
| D | 0 | 13 | 0 |
| Mode SS | |||
|---|---|---|---|
| Quadrant | BADHDUFLAG | Total packets | Discarded packets |
| A | 0 | 116 | 0 |
| B | 0 | 116 | 0 |
| C | 0 | 116 | 0 |
| D | 0 | 116 | 0 |
| Mode M0 | |||
|---|---|---|---|
| Quadrant | BADHDUFLAG | Total packets | Discarded packets |
| A | 0 | 17081 | 1 |
| B | 0 | 21749 | 3 |
| C | 0 | 15980 | 1 |
| D | 0 | 16318 | 1 |
| Quadrant | Total seconds | Saturated seconds | Saturation percentage |
|---|---|---|---|
| A | 5709 | 406 | 7.111578% |
| B | 5709 | 468 | 8.197583% |
| C | 5709 | 318 | 5.570152% |
| D | 5709 | 122 | 2.136977% |
Noise dominated data is calculated using 1-second bins in cleaned event files. If a bin has >2000 counts, and if more than 50% of those come from <1% of pixels, then it is considered to be noise-dominated and hence unusable.
| Quadrant | # 1 sec bins | Bins with >0 counts | Bins with >2000 counts | High rate bins dominated by noise | Noise dominated (total time) | Noise dominated (detector-on time) | Marked lightcurve |
|---|---|---|---|---|---|---|---|
| A | 7049 | 5710 | 178 | 178 | 2.53% | 3.12% | 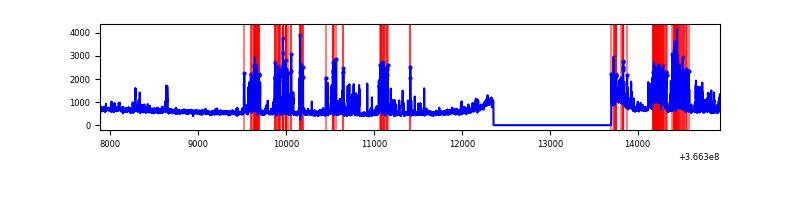 |
| B | 7049 | 5710 | 171 | 171 | 2.43% | 2.99% |  |
| C | 7049 | 5710 | 87 | 87 | 1.23% | 1.52% | 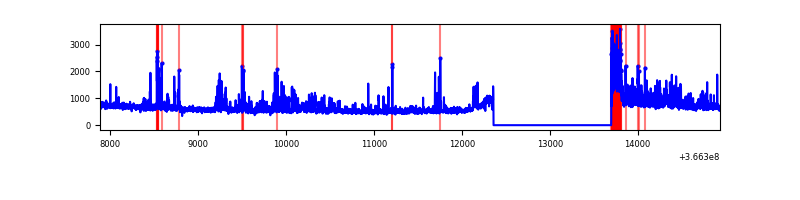 |
| D | 7049 | 5710 | 26 | 26 | 0.37% | 0.46% | 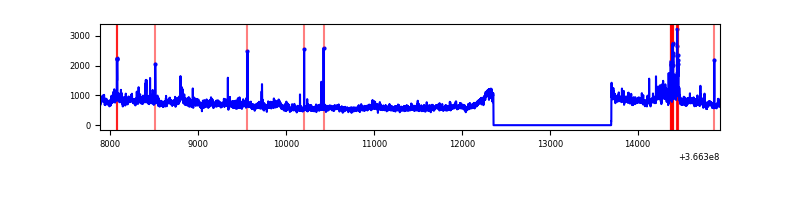 |
Top three noisy pixels from each quadrant. If the there are fewer than three noisy pixels in the level2.evt file, extra rows are filled as -1
| Pixel properties | Quadrant properties | ||||||
|---|---|---|---|---|---|---|---|
| Quadrant | DetID | PixID | Counts | Sigma | Mean | Median | Sigma |
| A | 0 | 13 | 1221427 | 7445.53 | 828 | 815 | 163.9 |
| A | 13 | 254 | 11575 | 65.63 | 828 | 815 | 163.9 |
| A | 4 | 2 | 9499 | 52.97 | 828 | 815 | 163.9 |
| B | 6 | 159 | 1590446 | 10565.16 | 817 | 801 | 150.5 |
| B | 4 | 80 | 966609 | 6418.99 | 817 | 801 | 150.5 |
| B | 5 | 172 | 75629 | 497.32 | 817 | 801 | 150.5 |
| C | 0 | 10 | 715927 | 3869.49 | 804 | 814 | 184.8 |
| C | 14 | 238 | 131557 | 707.45 | 804 | 814 | 184.8 |
| C | 10 | 22 | 42410 | 225.08 | 804 | 814 | 184.8 |
| D | 8 | 195 | 852730 | 4372.13 | 830 | 813 | 194.9 |
| D | 13 | 249 | 92893 | 472.56 | 830 | 813 | 194.9 |
| D | 12 | 227 | 27538 | 137.16 | 830 | 813 | 194.9 |
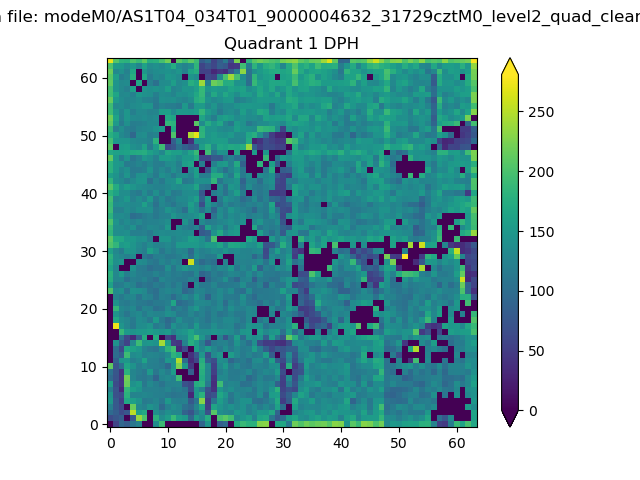
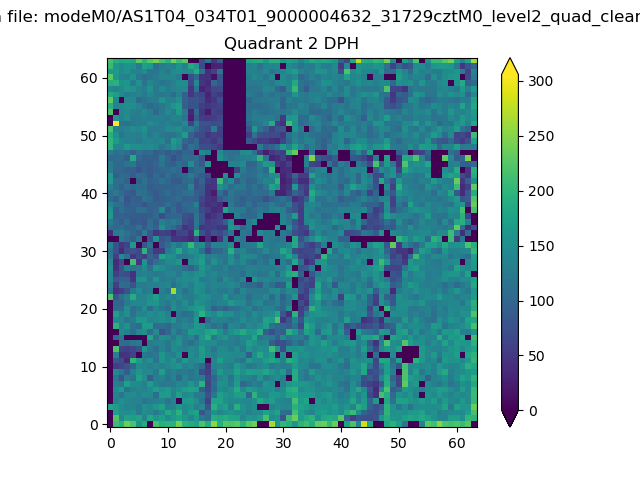
Histogram calculated using DETX and DETY for each event in the final _common_clean file
| Quadrant A | 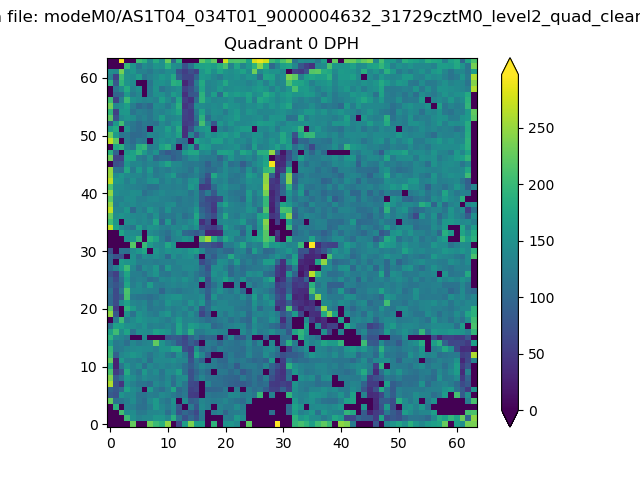 |
 |
Quadrant B |
|---|---|---|---|
| Quadrant D | 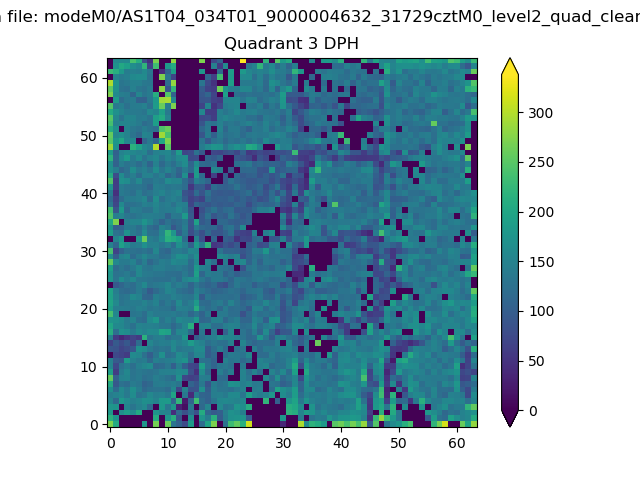 |
 |
Quadrant C |
| Plot type | Count rate plots | Images |
|---|---|---|
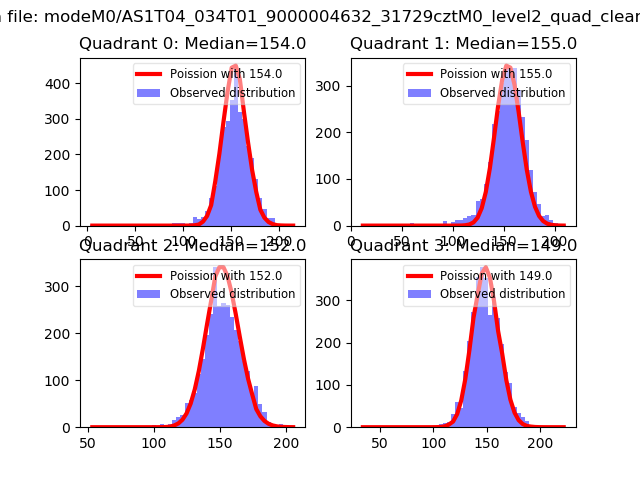
| Comparison with Poisson distribution Blue bars denote a histogram of data divided into 1 sec bins. Red curve is a Poisson curve with rate = median count rate of data. |
 |
 |
| Quadrant-wise count rates Data is divided into 100 sec bins |
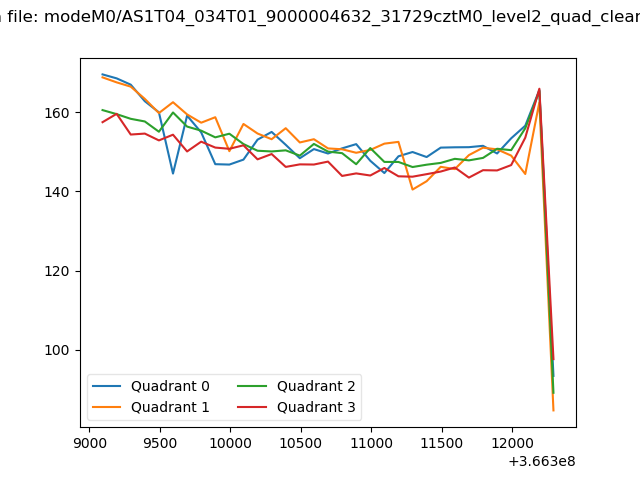 |
|
| Module-wise count rates for Quadrant A Data is divided into 100 sec bins |
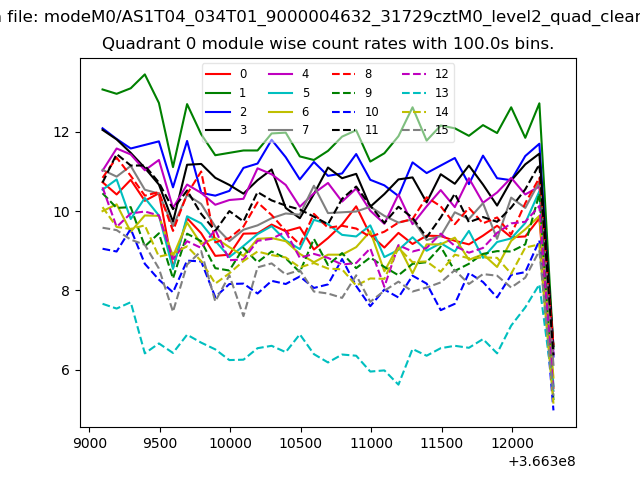 |
 |
| Module-wise count rates for Quadrant B Data is divided into 100 sec bins |
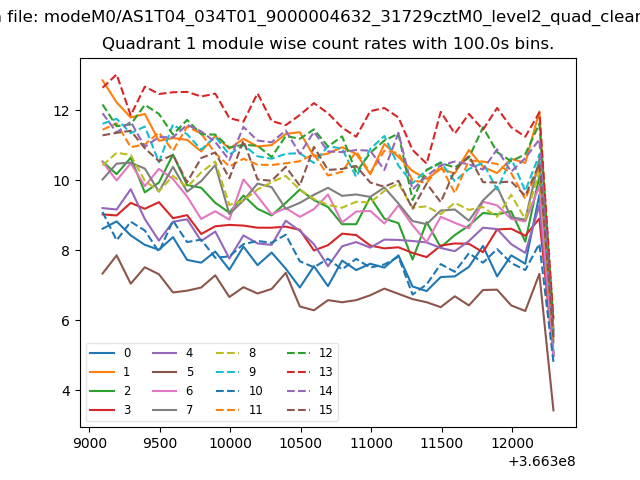 |
 |
| Module-wise count rates for Quadrant C Data is divided into 100 sec bins |
 |
 |
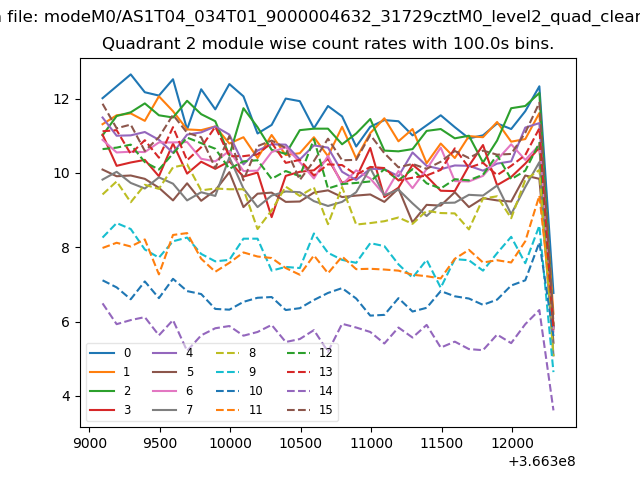
| Module-wise count rates for Quadrant D Data is divided into 100 sec bins |
 |
 |
| Parameter | Plot |
|---|---|
| CZT HV Monitor | 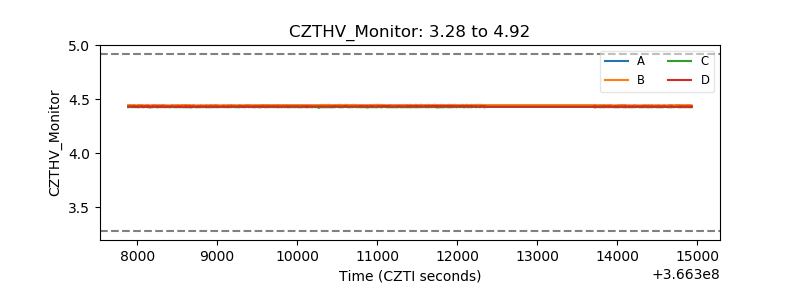 |
| D_VDD | 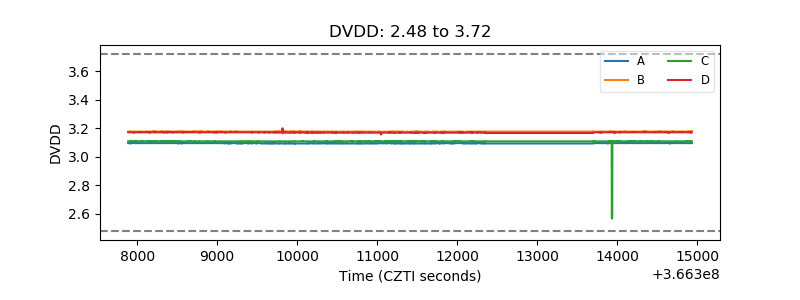 |
| Temperature 1 | 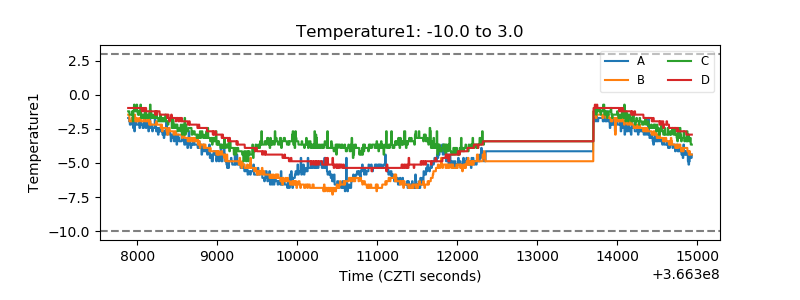 |
| Veto HV Monitor | 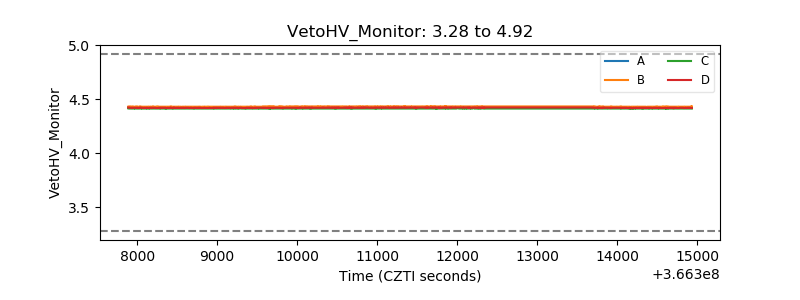 |
| Veto LLD | 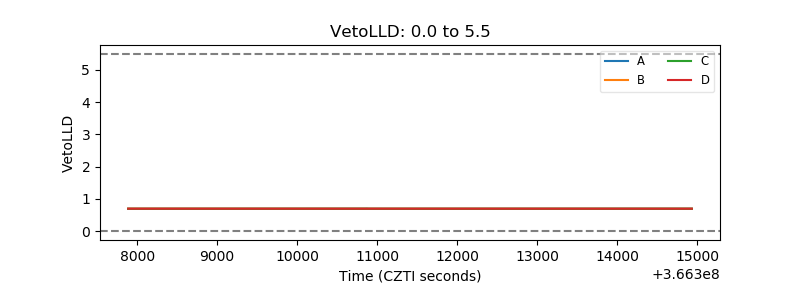 |
| Alpha Counter | 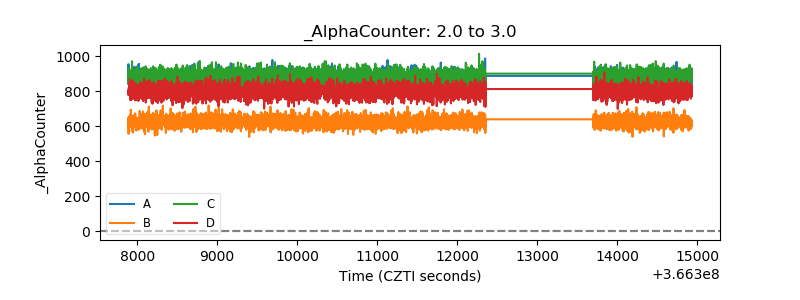 |
| _CPM_Rate | 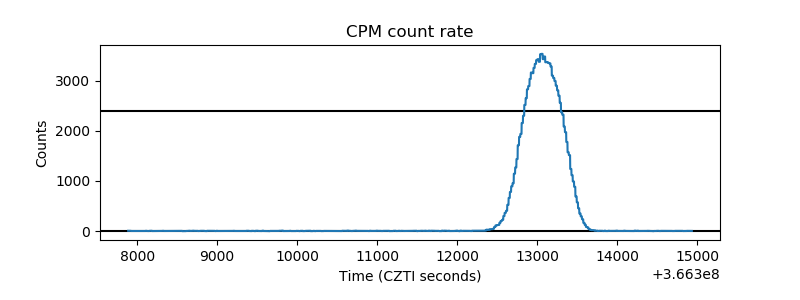 |
| CZT Counter | 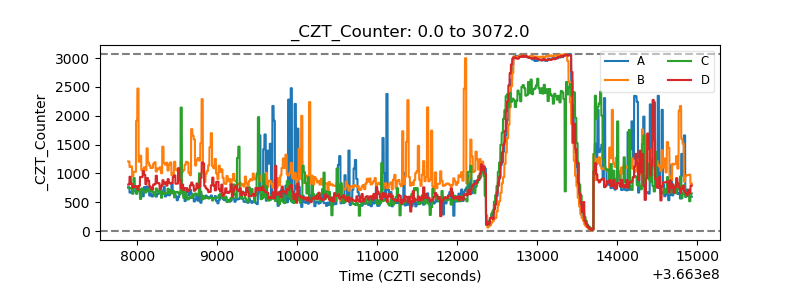 |
| +2.5 Volts monitor |  |
| +5 Volts monitor |  |
| _ROLL_ROT | 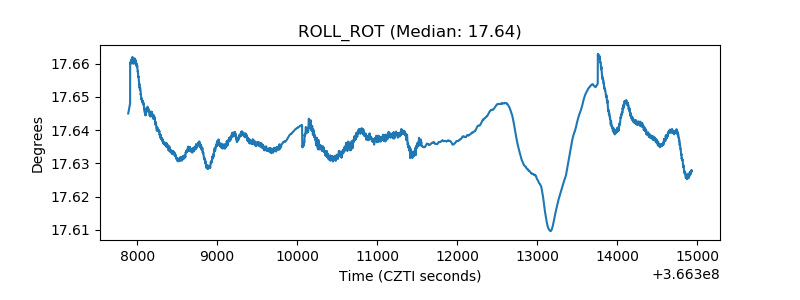 |
| _Roll_DEC | 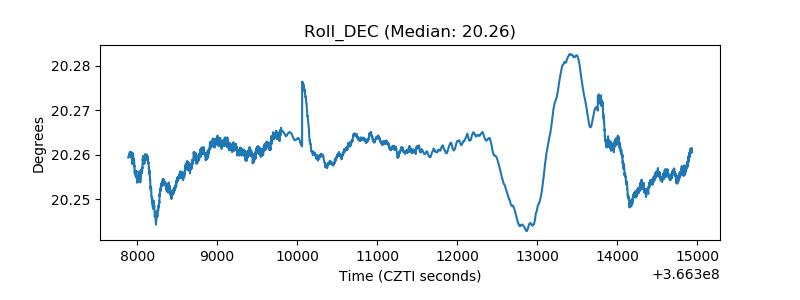 |
| _Roll_RA | 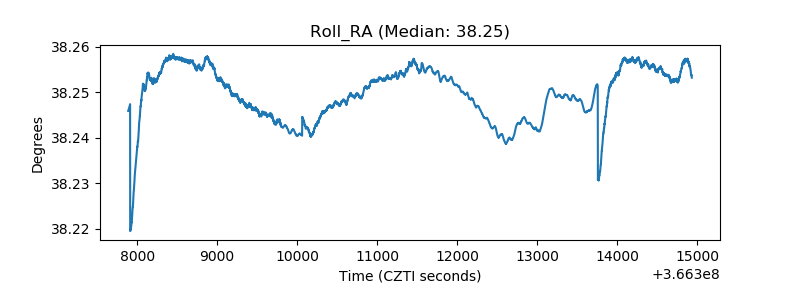 |
| Veto Counter | 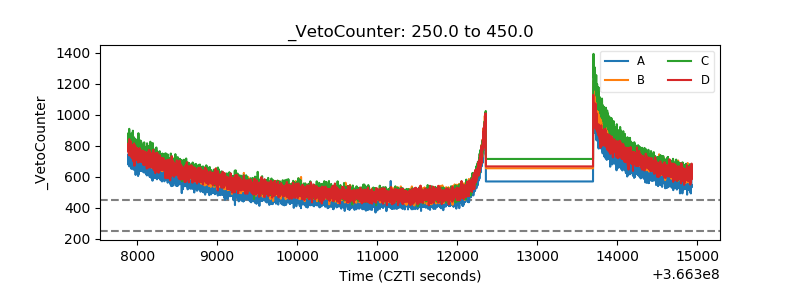 |