| Param | Original file | Final file |
|---|---|---|
| Filename | modeM0/AS1T04_034T01_9000004632_31730cztM0_level2.evt | modeM0/AS1T04_034T01_9000004632_31730cztM0_level2_quad_clean.evt |
| Size (bytes) | 712,728,000 | 94,608,000 |
| Size | 679.7 MB | 90.2 MB |
| Events in quadrant A | 5,753,726 | 595,988 |
| Events in quadrant B | 6,575,032 | 623,229 |
| Events in quadrant C | 4,270,452 | 622,099 |
| Events in quadrant D | 4,579,731 | 602,634 |
| Mode M9 | |||
|---|---|---|---|
| Quadrant | BADHDUFLAG | Total packets | Discarded packets |
| A | 0 | 13 | 0 |
| B | 0 | 13 | 0 |
| C | 0 | 13 | 0 |
| D | 0 | 13 | 0 |
| Mode SS | |||
|---|---|---|---|
| Quadrant | BADHDUFLAG | Total packets | Discarded packets |
| A | 0 | 122 | 0 |
| B | 0 | 122 | 0 |
| C | 0 | 122 | 0 |
| D | 0 | 122 | 0 |
| Mode M0 | |||
|---|---|---|---|
| Quadrant | BADHDUFLAG | Total packets | Discarded packets |
| A | 0 | 21354 | 1 |
| B | 0 | 23649 | 4 |
| C | 0 | 16823 | 1 |
| D | 0 | 17620 | 1 |
| Quadrant | Total seconds | Saturated seconds | Saturation percentage |
|---|---|---|---|
| A | 6028 | 791 | 13.122097% |
| B | 6027 | 727 | 12.062386% |
| C | 6027 | 331 | 5.491953% |
| D | 6027 | 245 | 4.065041% |
Noise dominated data is calculated using 1-second bins in cleaned event files. If a bin has >2000 counts, and if more than 50% of those come from <1% of pixels, then it is considered to be noise-dominated and hence unusable.
| Quadrant | # 1 sec bins | Bins with >0 counts | Bins with >2000 counts | High rate bins dominated by noise | Noise dominated (total time) | Noise dominated (detector-on time) | Marked lightcurve |
|---|---|---|---|---|---|---|---|
| A | 7368 | 6028 | 438 | 438 | 5.94% | 7.27% | 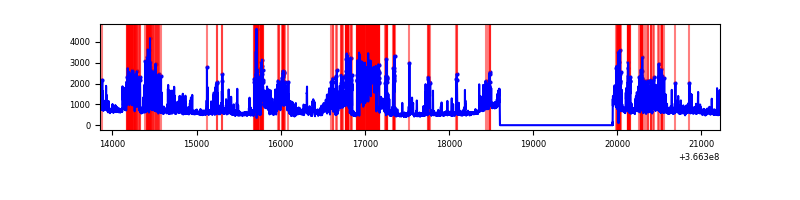 |
| B | 7367 | 6028 | 258 | 258 | 3.50% | 4.28% |  |
| C | 7367 | 6028 | 77 | 77 | 1.05% | 1.28% | 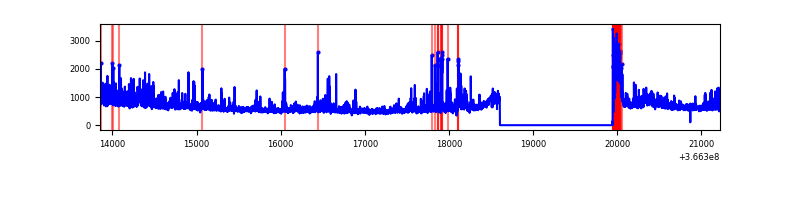 |
| D | 7367 | 6027 | 142 | 142 | 1.93% | 2.36% | 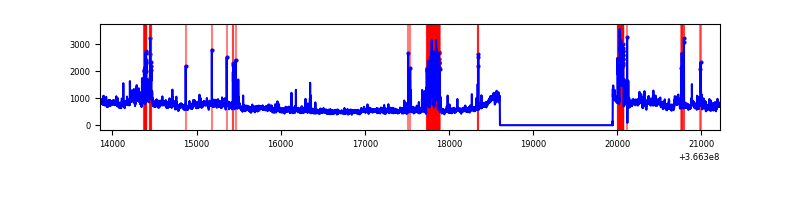 |
Top three noisy pixels from each quadrant. If the there are fewer than three noisy pixels in the level2.evt file, extra rows are filled as -1
| Pixel properties | Quadrant properties | ||||||
|---|---|---|---|---|---|---|---|
| Quadrant | DetID | PixID | Counts | Sigma | Mean | Median | Sigma |
| A | 0 | 13 | 2540186 | 15413.95 | 832 | 818 | 164.7 |
| A | 13 | 254 | 11934 | 67.47 | 832 | 818 | 164.7 |
| A | 3 | 137 | 7557 | 40.91 | 832 | 818 | 164.7 |
| B | 6 | 159 | 1666096 | 10681.42 | 833 | 816 | 155.9 |
| B | 4 | 80 | 1312742 | 8414.94 | 833 | 816 | 155.9 |
| B | 0 | 190 | 174994 | 1117.21 | 833 | 816 | 155.9 |
| C | 0 | 10 | 740507 | 3790.21 | 840 | 851 | 195.1 |
| C | 14 | 238 | 136936 | 697.34 | 840 | 851 | 195.1 |
| C | 3 | 233 | 44634 | 224.36 | 840 | 851 | 195.1 |
| D | 8 | 195 | 823818 | 4122.28 | 851 | 834 | 199.6 |
| D | 12 | 233 | 265194 | 1324.16 | 851 | 834 | 199.6 |
| D | 13 | 249 | 139550 | 694.82 | 851 | 834 | 199.6 |
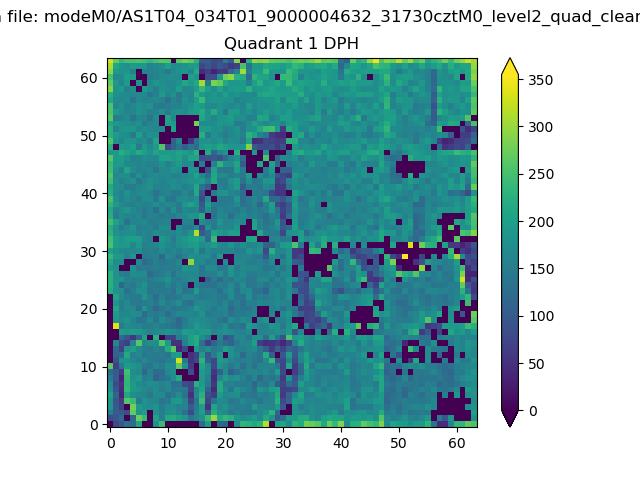
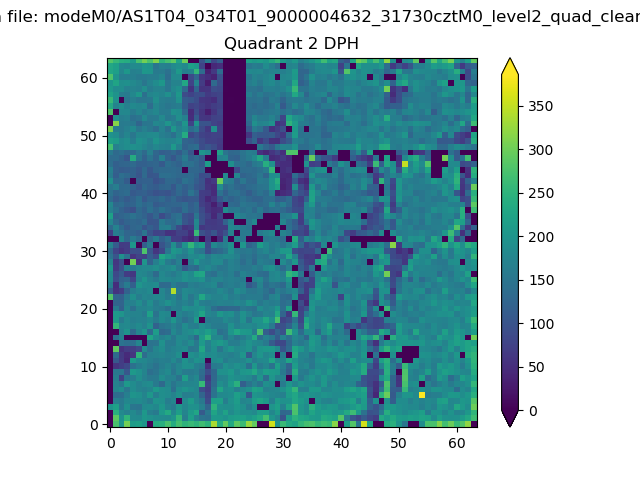
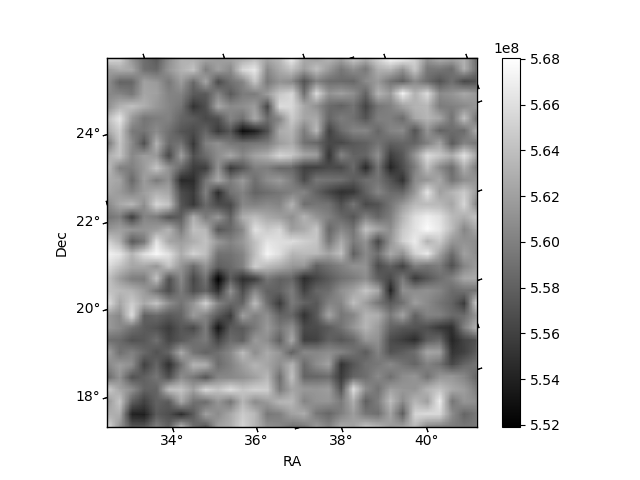
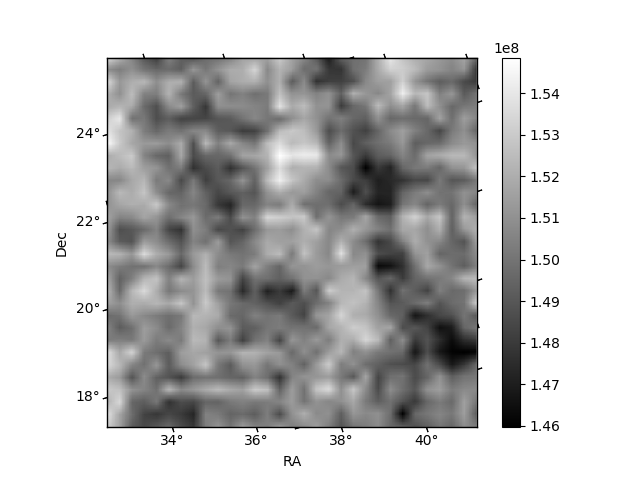
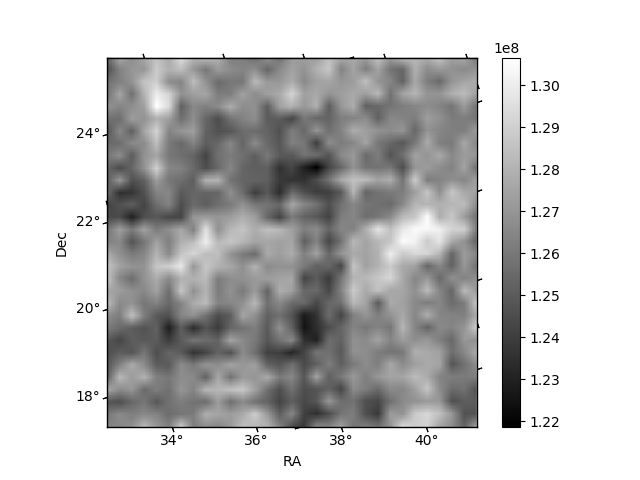
Histogram calculated using DETX and DETY for each event in the final _common_clean file
| Quadrant A | 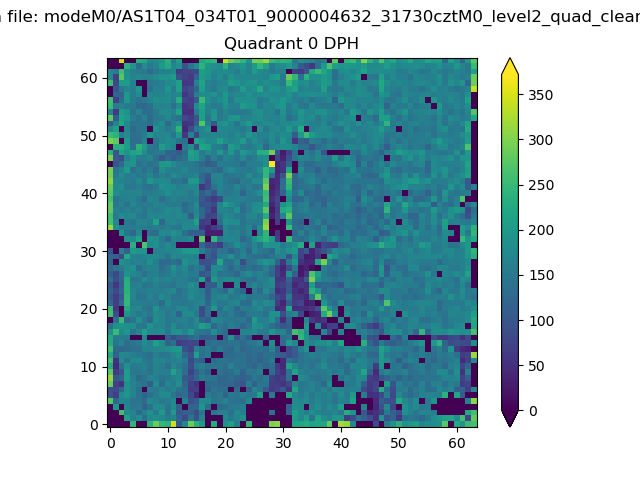 |
 |
Quadrant B |
|---|---|---|---|
| Quadrant D | 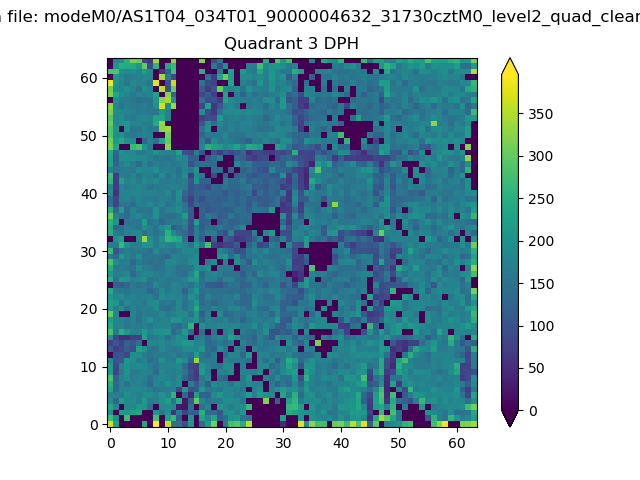 |
 |
Quadrant C |
| Plot type | Count rate plots | Images |
|---|---|---|
| Comparison with Poisson distribution Blue bars denote a histogram of data divided into 1 sec bins. Red curve is a Poisson curve with rate = median count rate of data. |
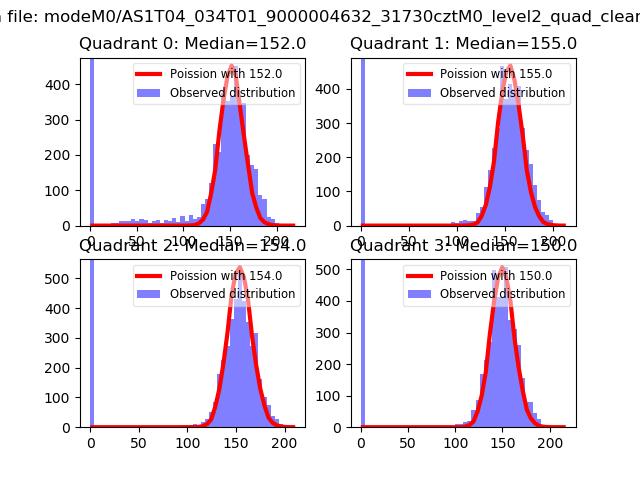 |
 |
| Quadrant-wise count rates Data is divided into 100 sec bins |
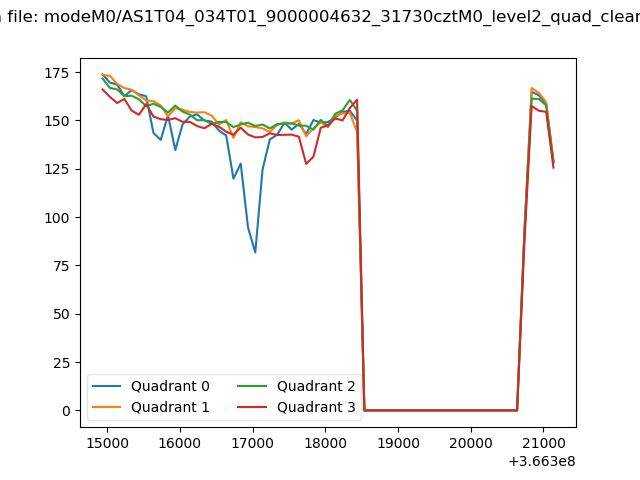 |
|
| Module-wise count rates for Quadrant A Data is divided into 100 sec bins |
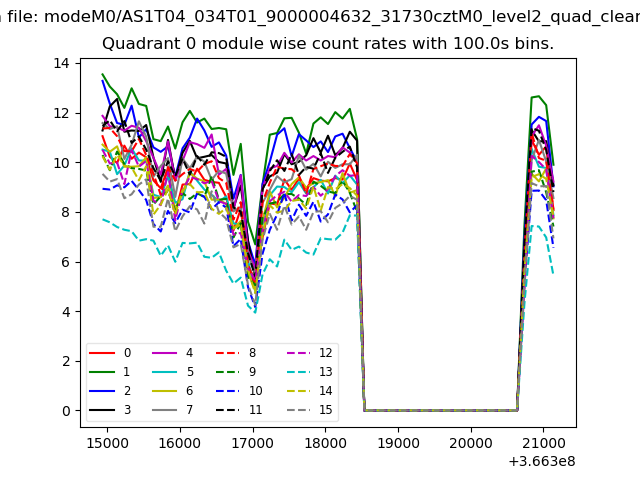 |
 |
| Module-wise count rates for Quadrant B Data is divided into 100 sec bins |
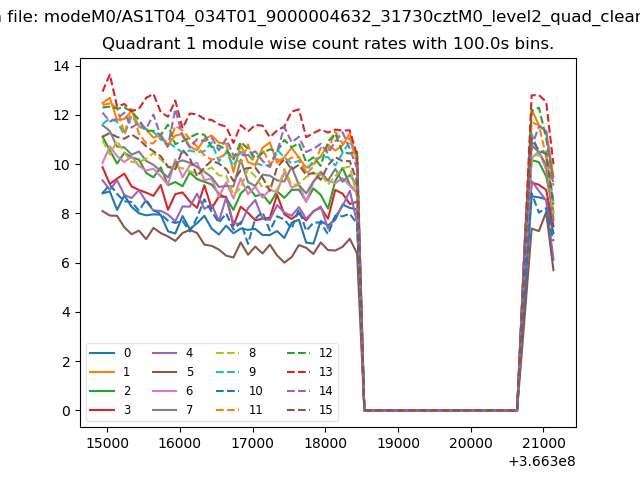 |
 |
| Module-wise count rates for Quadrant C Data is divided into 100 sec bins |
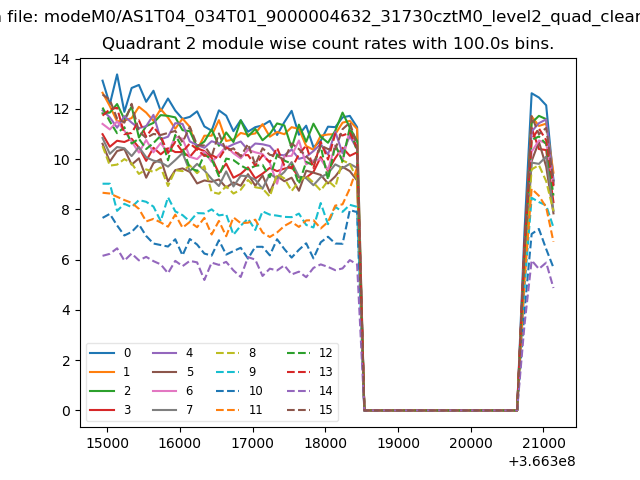 |
 |
| Module-wise count rates for Quadrant D Data is divided into 100 sec bins |
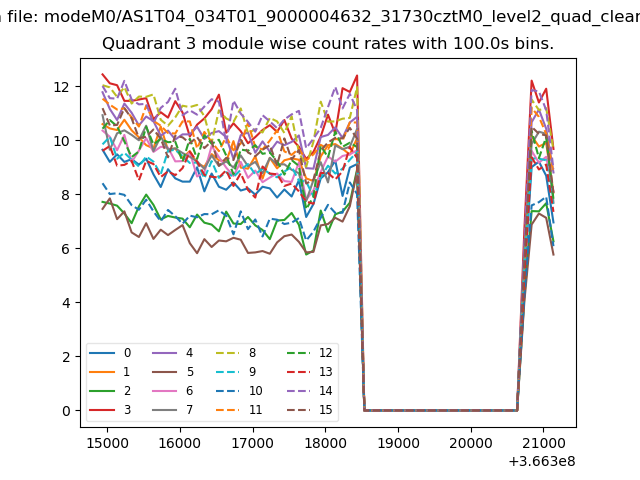 |
 |
| Parameter | Plot |
|---|---|
| CZT HV Monitor | 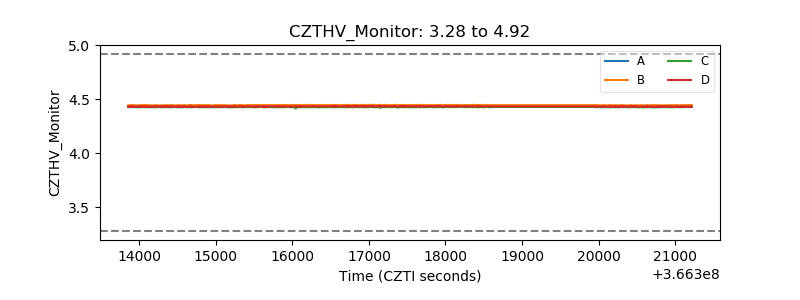 |
| D_VDD | 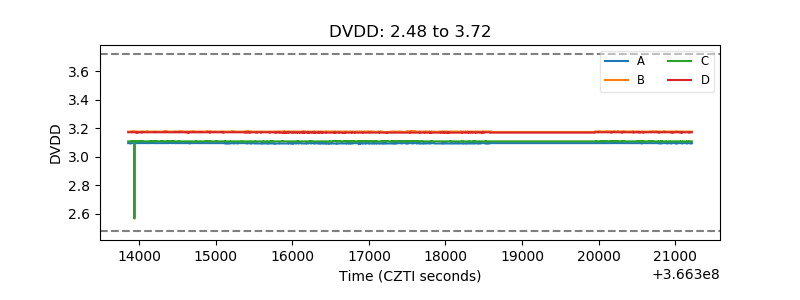 |
| Temperature 1 | 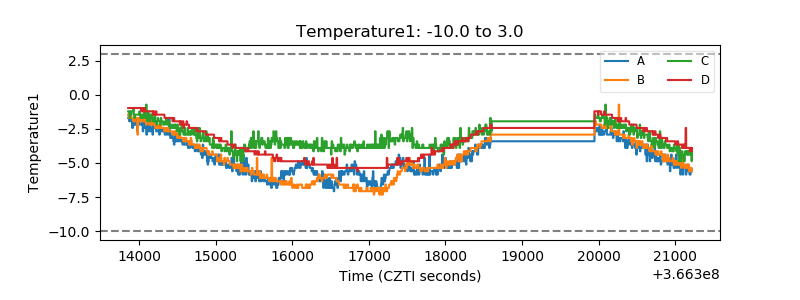 |
| Veto HV Monitor | 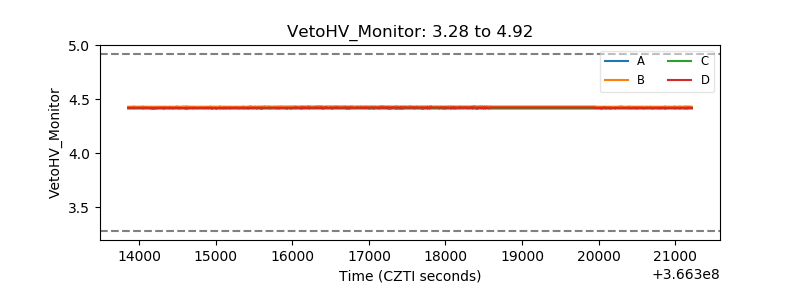 |
| Veto LLD | 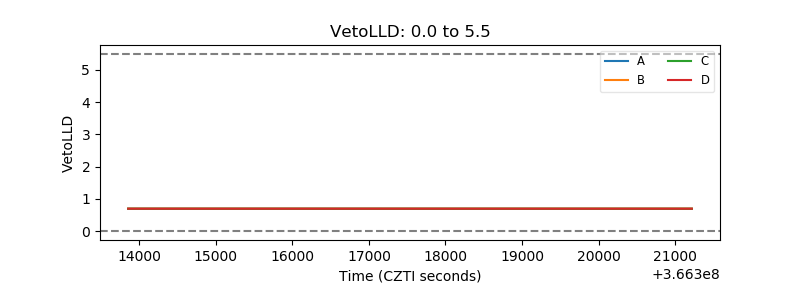 |
| Alpha Counter | 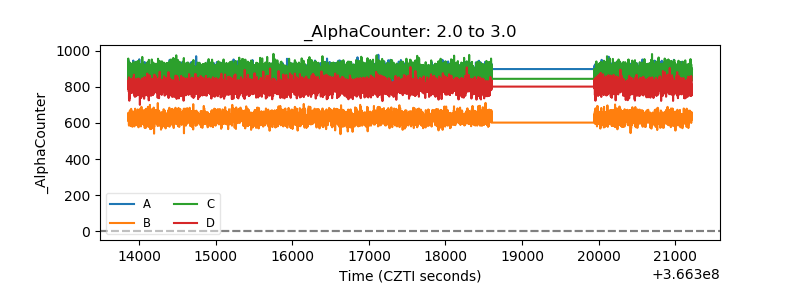 |
| _CPM_Rate | 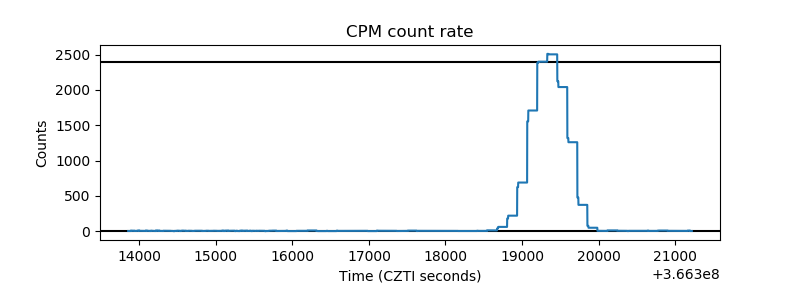 |
| CZT Counter | 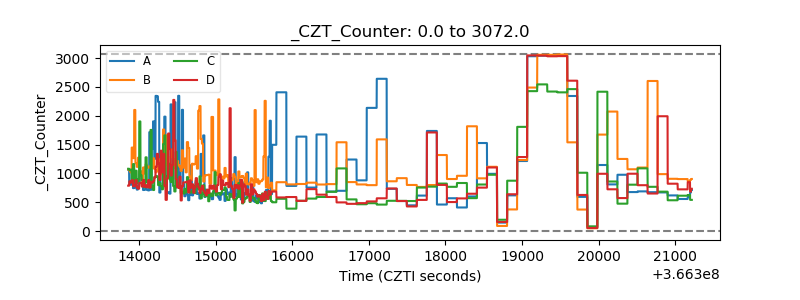 |
| +2.5 Volts monitor |  |
| +5 Volts monitor |  |
| _ROLL_ROT | 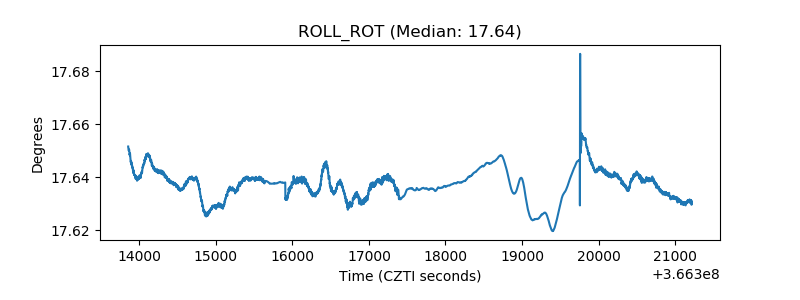 |
| _Roll_DEC | 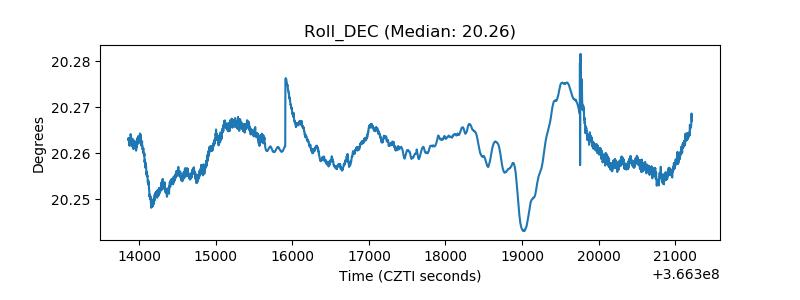 |
| _Roll_RA | 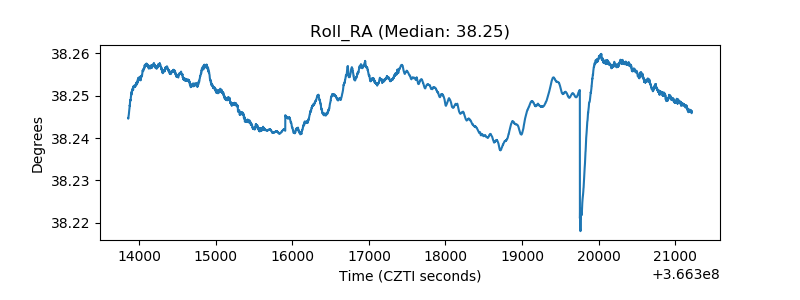 |
| Veto Counter | 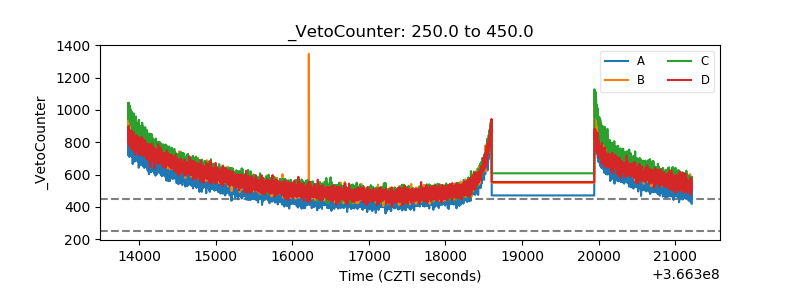 |