| Param | Original file | Final file |
|---|---|---|
| Filename | modeM0/AS1T04_034T01_9000004632_31732cztM0_level2.evt | modeM0/AS1T04_034T01_9000004632_31732cztM0_level2_quad_clean.evt |
| Size (bytes) | 709,021,440 | 103,271,040 |
| Size | 676.2 MB | 98.5 MB |
| Events in quadrant A | 6,223,879 | 647,066 |
| Events in quadrant B | 6,025,305 | 684,790 |
| Events in quadrant C | 4,195,884 | 669,369 |
| Events in quadrant D | 4,570,891 | 654,341 |
| Mode M9 | |||
|---|---|---|---|
| Quadrant | BADHDUFLAG | Total packets | Discarded packets |
| A | 0 | 11 | 0 |
| B | 0 | 12 | 0 |
| C | 0 | 12 | 0 |
| D | 0 | 12 | 0 |
| Mode SS | |||
|---|---|---|---|
| Quadrant | BADHDUFLAG | Total packets | Discarded packets |
| A | 0 | 136 | 0 |
| B | 0 | 136 | 0 |
| C | 0 | 136 | 0 |
| D | 0 | 136 | 0 |
| Mode M0 | |||
|---|---|---|---|
| Quadrant | BADHDUFLAG | Total packets | Discarded packets |
| A | 0 | 23022 | 2 |
| B | 0 | 22446 | 2 |
| C | 0 | 16797 | 2 |
| D | 0 | 18027 | 2 |
| Quadrant | Total seconds | Saturated seconds | Saturation percentage |
|---|---|---|---|
| A | 6774 | 1036 | 15.293770% |
| B | 6774 | 249 | 3.675819% |
| C | 6774 | 352 | 5.196339% |
| D | 6774 | 106 | 1.564807% |
Noise dominated data is calculated using 1-second bins in cleaned event files. If a bin has >2000 counts, and if more than 50% of those come from <1% of pixels, then it is considered to be noise-dominated and hence unusable.
| Quadrant | # 1 sec bins | Bins with >0 counts | Bins with >2000 counts | High rate bins dominated by noise | Noise dominated (total time) | Noise dominated (detector-on time) | Marked lightcurve |
|---|---|---|---|---|---|---|---|
| A | 7639 | 6775 | 592 | 592 | 7.75% | 8.74% | 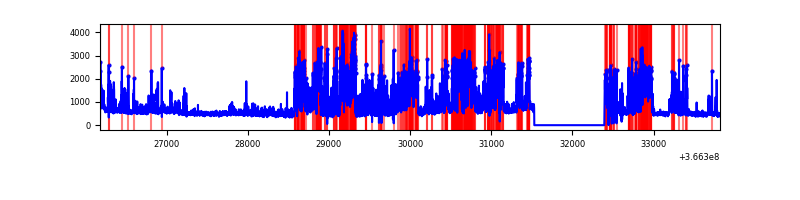 |
| B | 7639 | 6775 | 43 | 43 | 0.56% | 0.63% | 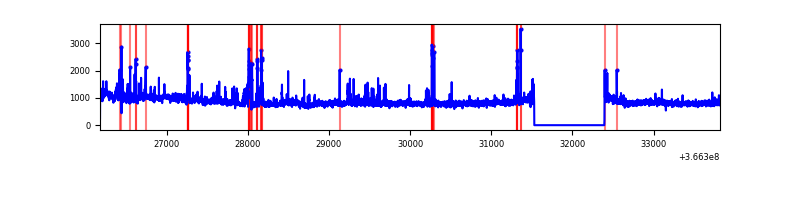 |
| C | 7639 | 6775 | 134 | 134 | 1.75% | 1.98% | 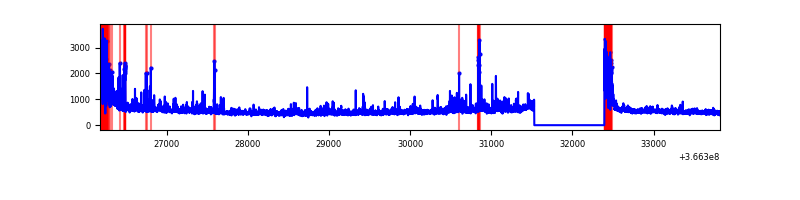 |
| D | 7639 | 6775 | 36 | 36 | 0.47% | 0.53% | 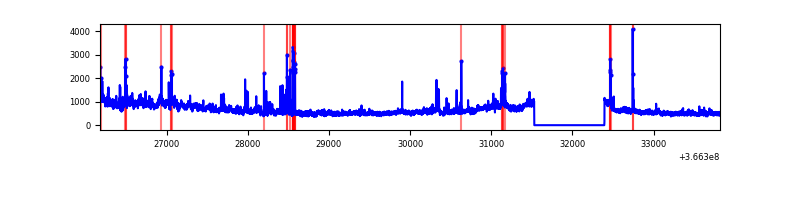 |
Top three noisy pixels from each quadrant. If the there are fewer than three noisy pixels in the level2.evt file, extra rows are filled as -1
| Pixel properties | Quadrant properties | ||||||
|---|---|---|---|---|---|---|---|
| Quadrant | DetID | PixID | Counts | Sigma | Mean | Median | Sigma |
| A | 0 | 13 | 3074931 | 18755.25 | 816 | 801 | 163.9 |
| A | 13 | 254 | 12204 | 69.57 | 816 | 801 | 163.9 |
| A | 3 | 137 | 7989 | 43.85 | 816 | 801 | 163.9 |
| B | 6 | 159 | 1922433 | 11738.1 | 859 | 839 | 163.7 |
| B | 4 | 80 | 514157 | 3135.62 | 859 | 839 | 163.7 |
| B | 5 | 172 | 50408 | 302.79 | 859 | 839 | 163.7 |
| C | 0 | 10 | 778284 | 4056.05 | 820 | 828 | 191.7 |
| C | 14 | 238 | 131606 | 682.28 | 820 | 828 | 191.7 |
| C | 10 | 22 | 27416 | 138.71 | 820 | 828 | 191.7 |
| D | 8 | 195 | 1114692 | 5487.09 | 849 | 829 | 203.0 |
| D | 12 | 233 | 196024 | 961.57 | 849 | 829 | 203.0 |
| D | 13 | 249 | 33714 | 162.0 | 849 | 829 | 203.0 |
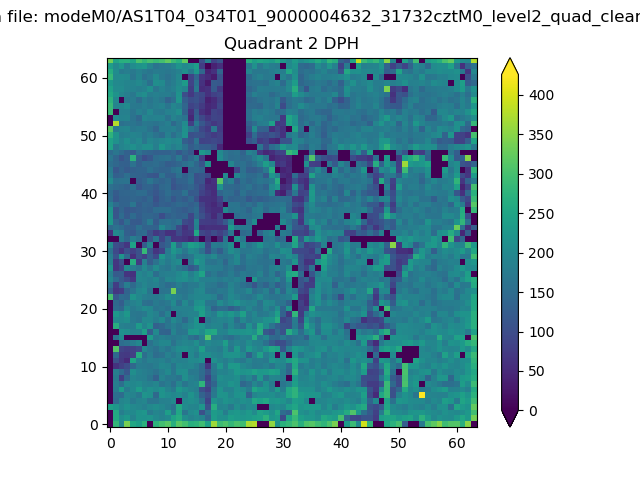
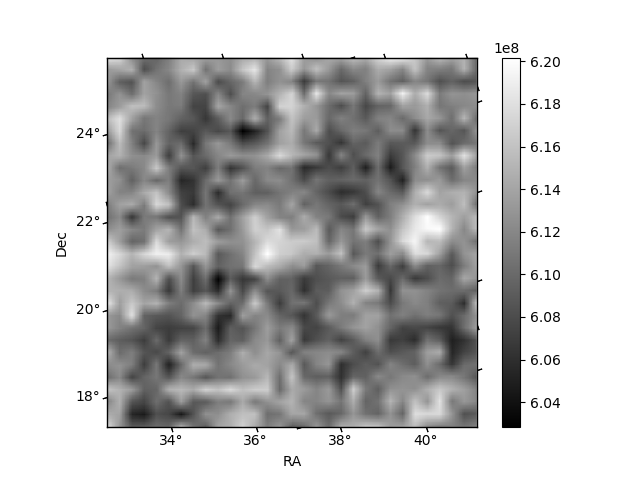
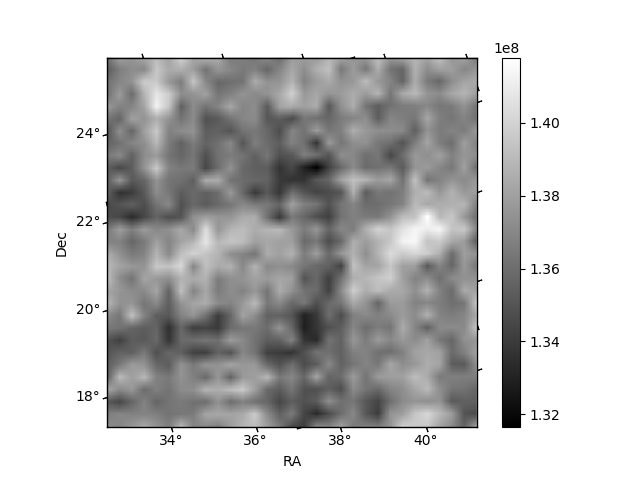
Histogram calculated using DETX and DETY for each event in the final _common_clean file
| Quadrant A | 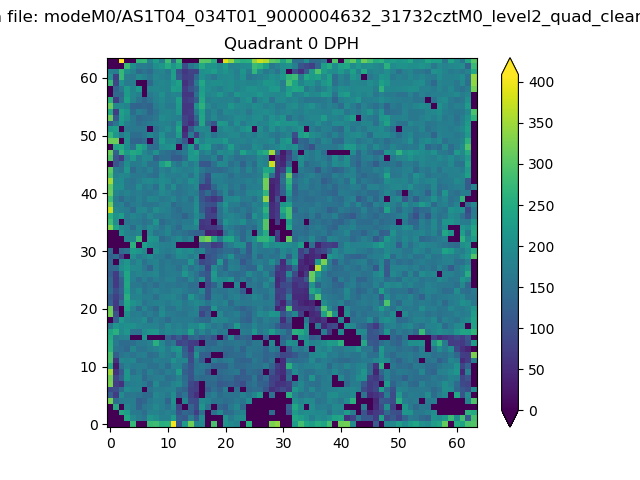 |
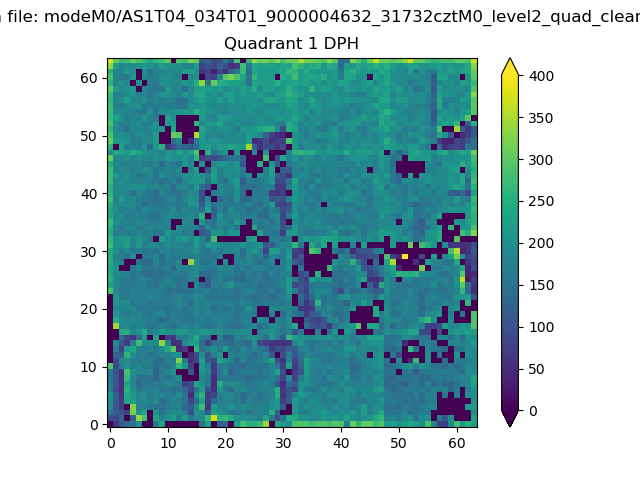 |
Quadrant B |
|---|---|---|---|
| Quadrant D | 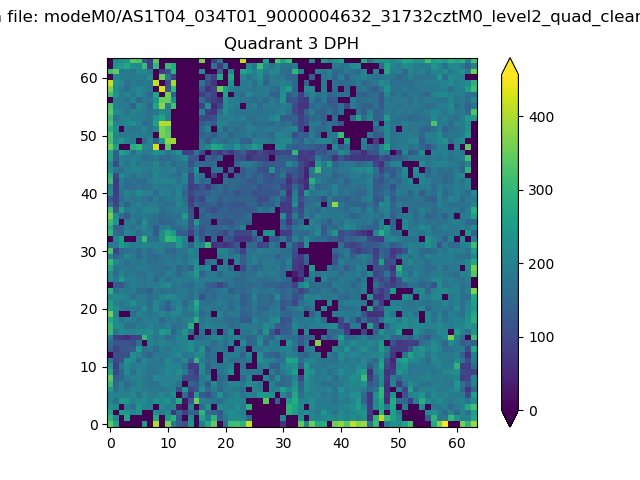 |
 |
Quadrant C |
| Plot type | Count rate plots | Images |
|---|---|---|
| Comparison with Poisson distribution Blue bars denote a histogram of data divided into 1 sec bins. Red curve is a Poisson curve with rate = median count rate of data. |
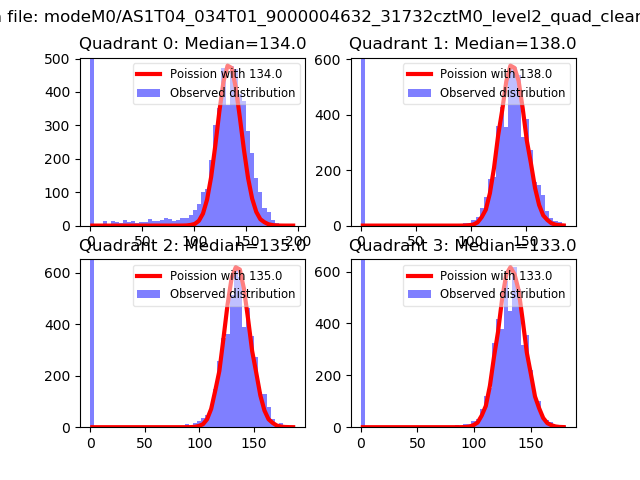 |
 |
| Quadrant-wise count rates Data is divided into 100 sec bins |
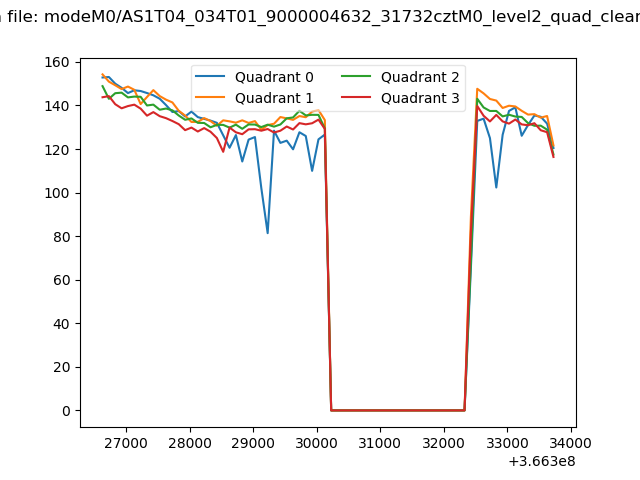 |
|
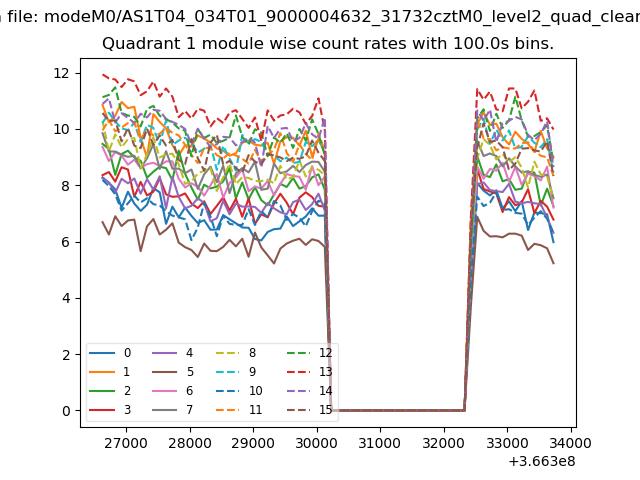
| Module-wise count rates for Quadrant A Data is divided into 100 sec bins |
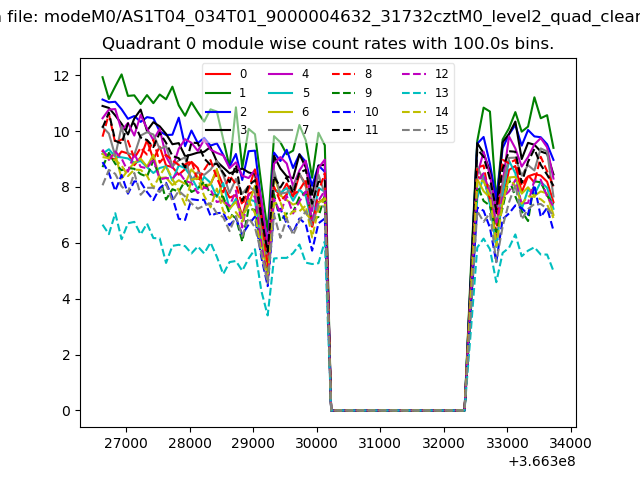 |
 |
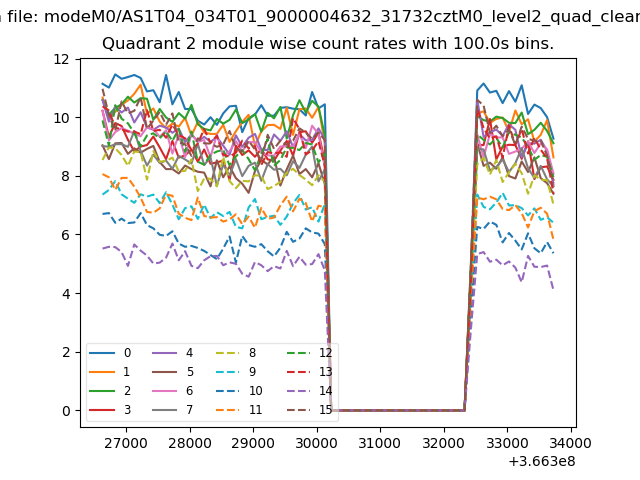
| Module-wise count rates for Quadrant B Data is divided into 100 sec bins |
 |
 |
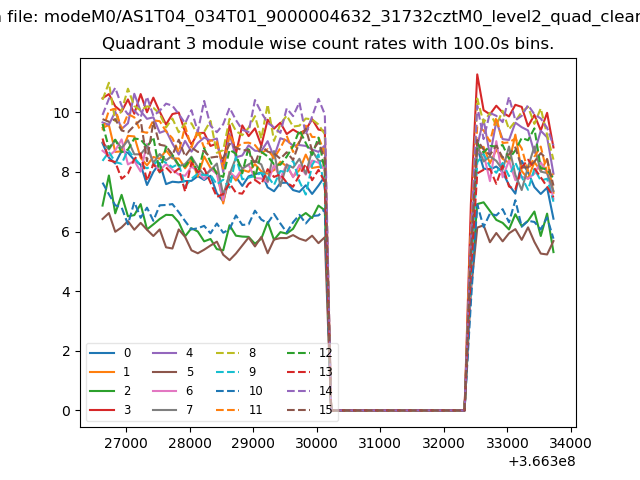
| Module-wise count rates for Quadrant C Data is divided into 100 sec bins |
 |
 |
| Module-wise count rates for Quadrant D Data is divided into 100 sec bins |
 |
 |
| Parameter | Plot |
|---|---|
| CZT HV Monitor | 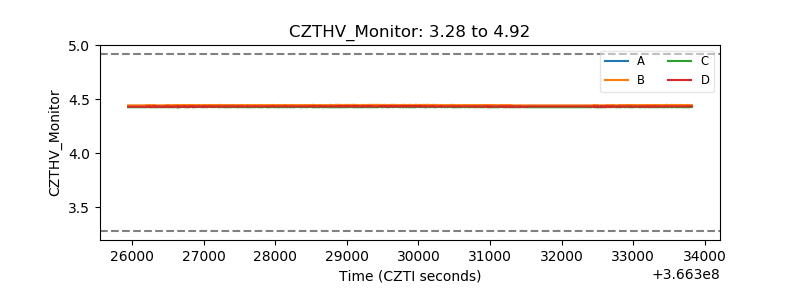 |
| D_VDD | 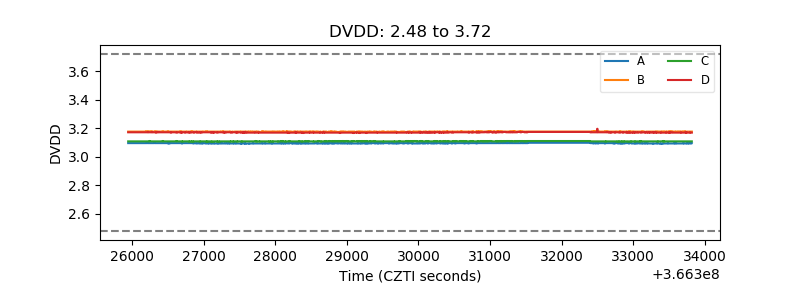 |
| Temperature 1 | 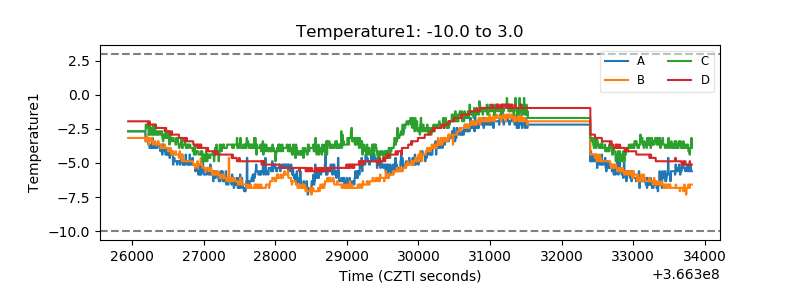 |
| Veto HV Monitor | 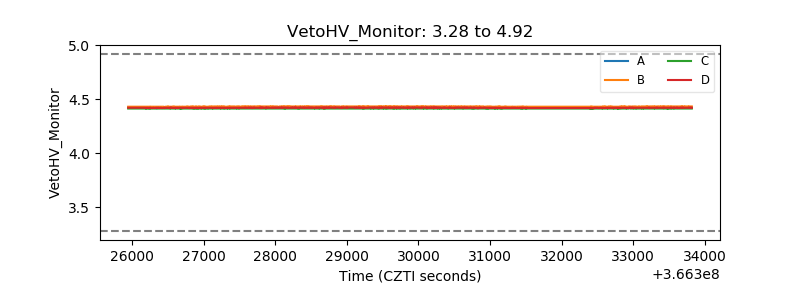 |
| Veto LLD | 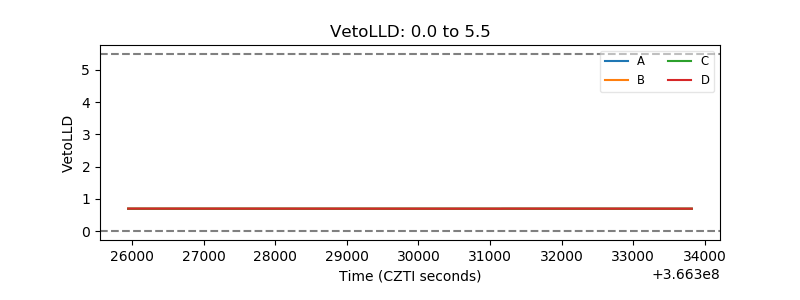 |
| Alpha Counter | 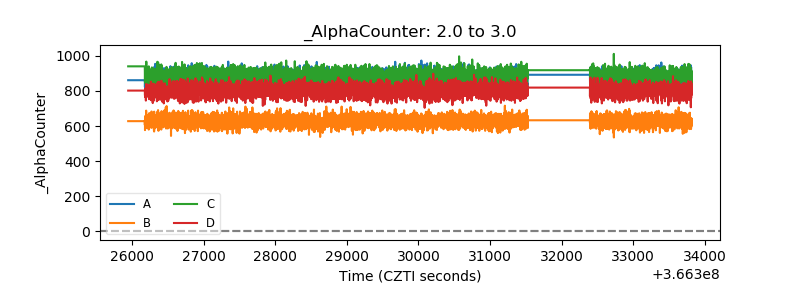 |
| _CPM_Rate | 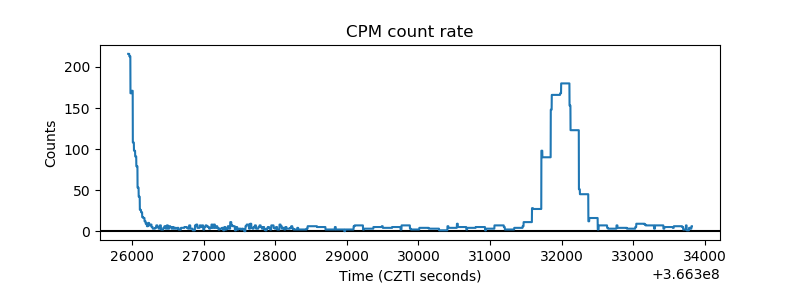 |
| CZT Counter | 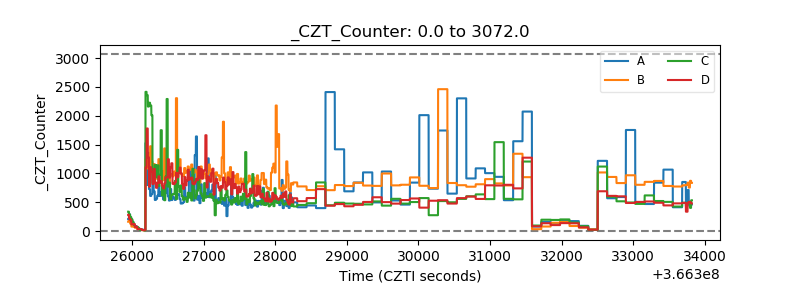 |
| +2.5 Volts monitor |  |
| +5 Volts monitor |  |
| _ROLL_ROT | 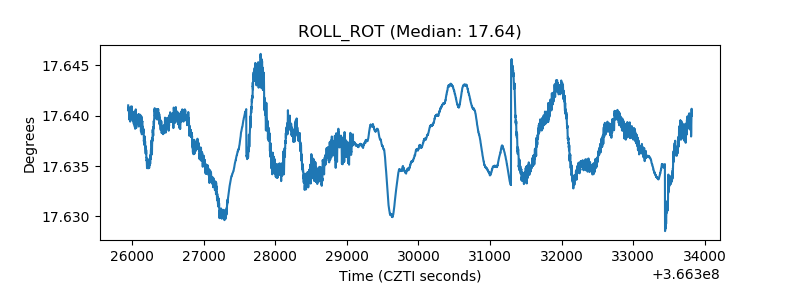 |
| _Roll_DEC | 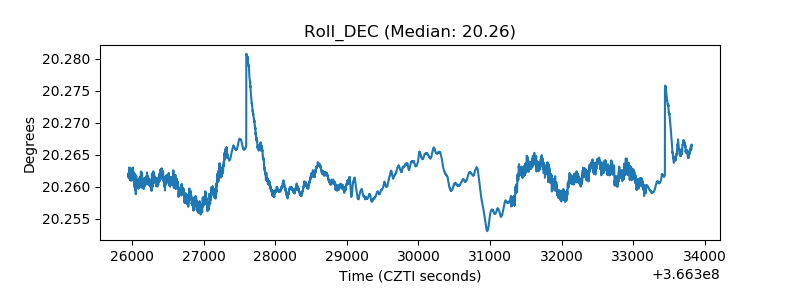 |
| _Roll_RA | 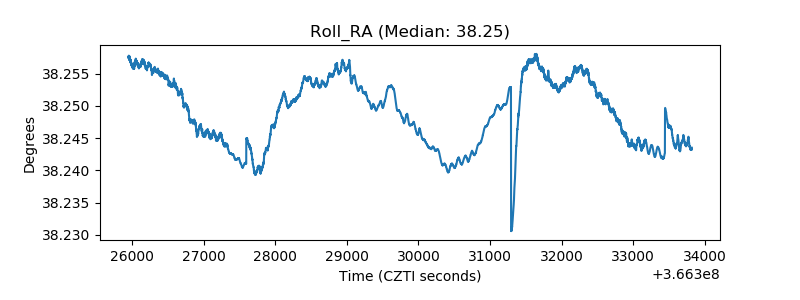 |
| Veto Counter | 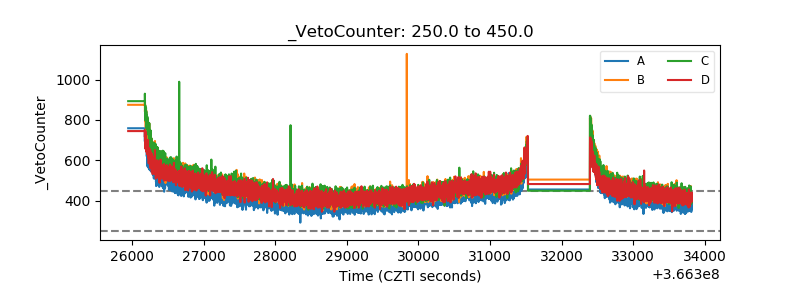 |